


Share crypto content and earn up to 60% commissions through content mining.
placeholder
gatefun
📊 $SOL Technical Analysis Update
💰 Price: $81.50 (24h range: $76.90 – $82.40)
📈 Market Cap: ~$47B | Rank #7
🔄 24h Volume: ~$2.5B–$3.9B
🔑 Key Levels
🟢 Support: $78.84 (7-day SMA) → $75 → $70 psychological zone
🔴 Resistance: $82.26 (61.8% Fib, just broken) → $85 → $90
📐 Indicators
RSI (7D): 65.72 — healthy bullish momentum, not yet overbought
Weekly performance: +19%, one of the strongest among majors
Monthly candle: first green monthly close in 9 months, +38% off the $60 low
🧠 The setup
SOL just reclaimed the $82.26 breakout level on a volume spike (+17.7%), backed by real catalysts —
SOL-3.82%
post-image
  • Reward
  • Comment
  • Repost
  • Share
Strategy Sells 3,588 Bitcoin, Demonstrating Strategic Treasury Management in the Digital Asset Era
Introduction
The cryptocurrency market continues to mature as more publicly traded companies integrate digital assets into their long-term financial strategies. Among the most closely watched corporate Bitcoin holders is Strategy, formerly known as MicroStrategy, a company that has become synonymous with institutional Bitcoin adoption. Its recent decision to sell 3,588 Bitcoin has attracted widespread attention across global financial markets.
According to the company's latest filing, Strategy so
BTC-1.28%
post-image
post-image
post-image
  • Reward
  • 4
  • Repost
  • Share
ShainingMoon:
2026 GOGOGO 👊
View More
SOL rebound is an illusion? 15-minute RSI has dropped to 21.27!

$SOL /USDT - SHORT

Trade Plan:
Entry: 78.75 – 79.15
SL: 80.84
TP1: 77.54
TP2: 76.59
TP3: 75.18

Why focus on this structure?

- 4H level signal: SHORT, confidence 55.4%, 1D trend is a consolidation range.
- 15-minute RSI 21.27, extremely oversold, but the main direction remains bearish.
- Entry reference 78.95, now is the time for a rebound to this range.
- Why now? After an oversold rebound, bearish momentum may be stronger, TP1 at 77.54, TP2 at 76.59.

Discussion:
Will this move first hit TP2, or is it a bull trap?
SOL-3.85%
View Original
post-image
post-image
  • Reward
  • Comment
  • Repost
  • Share
It was still grinding a few days ago, but today it just gave the answer directly! 📢 $IDOL This round of short-position fulfillment—this isn’t guesswork; the chart itself exposed the weakness. 📉
While it was grinding at the top during the session, I kept watching it. Every push up fell just a little short—volume couldn’t keep up. The rebound looked exciting, but nobody was stepping in, so back then I signaled to go long, with the entry reference at 0.026428—don’t chase that kind of false heat. 👀
Once you understand, execute—don’t hesitate at the last step.
Now the current price is 0.014649,
IDOL-2.15%
BTC-1.34%
ETH-2.00%
View Original
post-image
  • Reward
  • Comment
  • Repost
  • Share
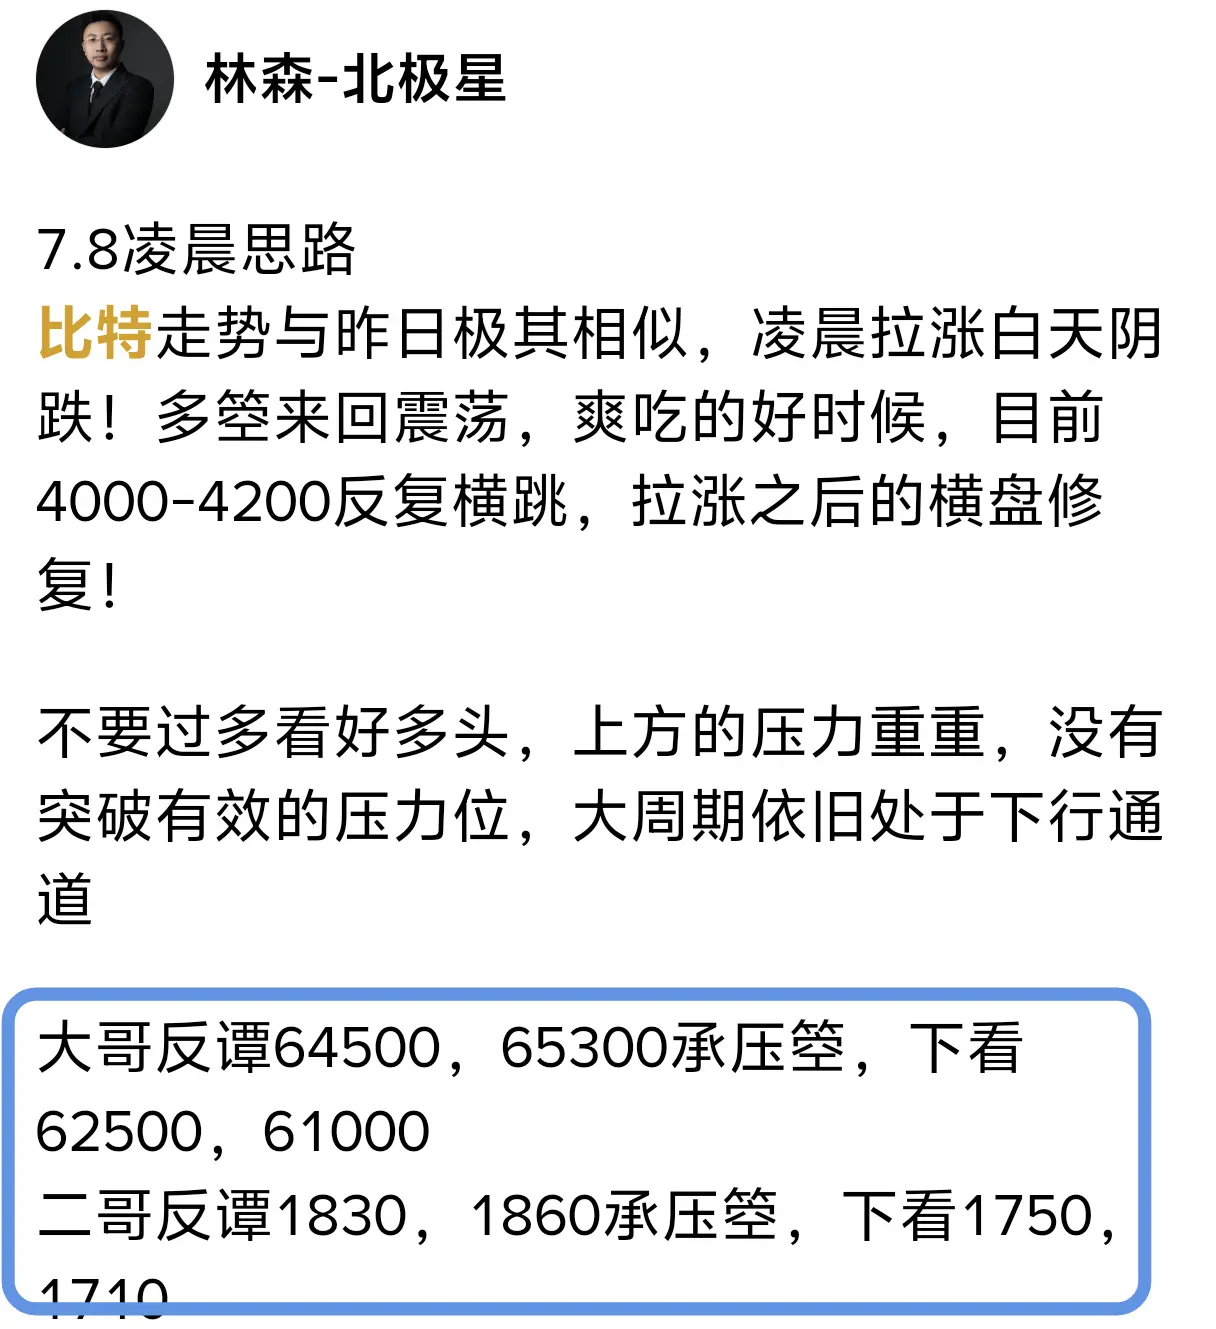
7.8 Morning “Big Bing” Analysis
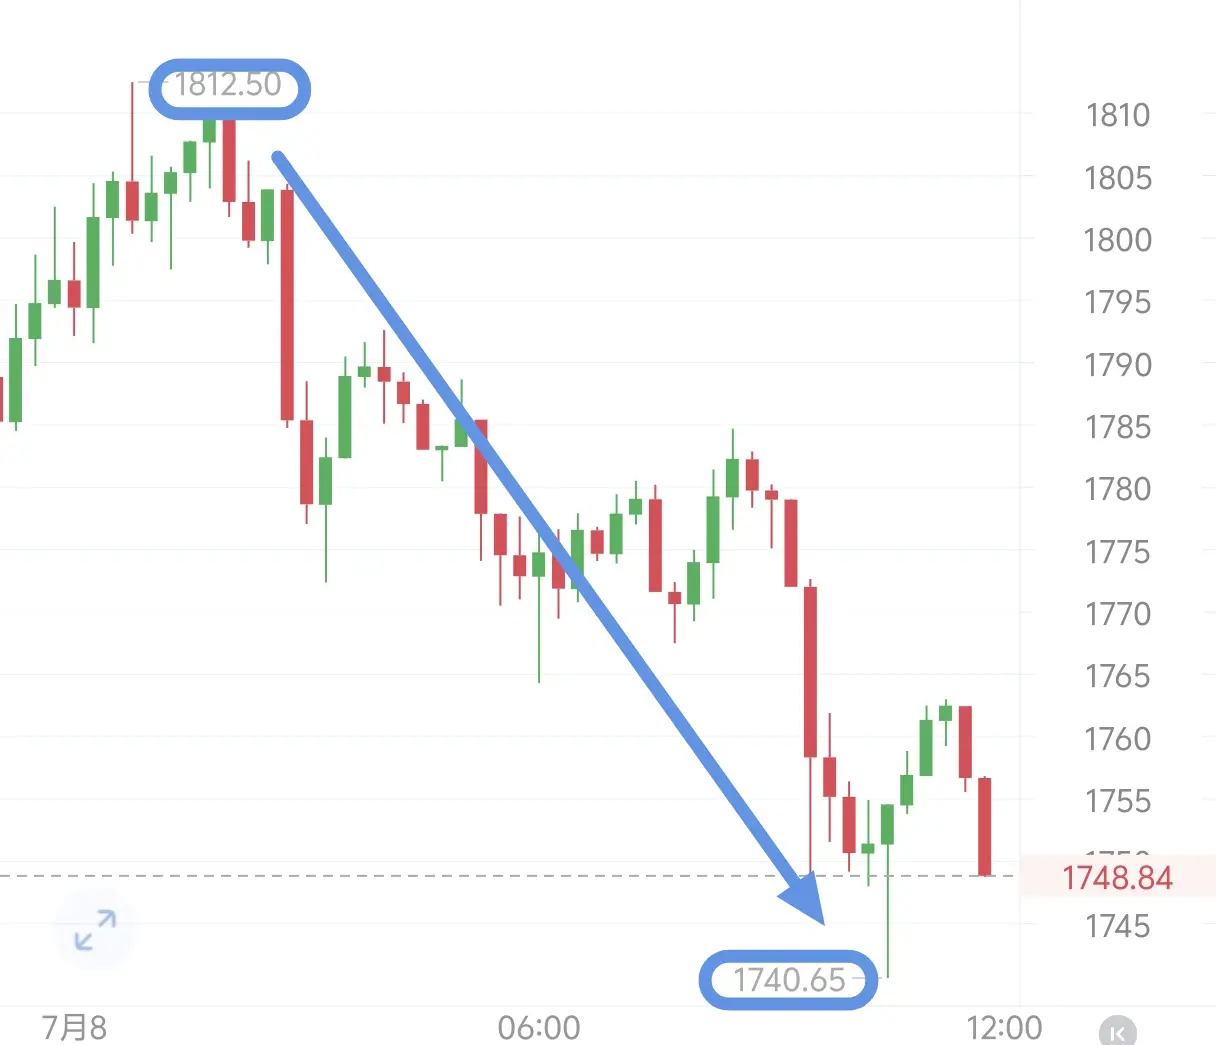
Analysis: Near 1730-1740, on the “Big Bing,” do a “duo,” with defense at 1710; target 1860-1820.
On the rebound near 1820-1810, on the “Big Bing,” do a “kong,” with defense at 1840; target 1750-1720.
Overall, the trading plan is based on a range-bound consolidation pattern with no clear one-way trend. Use the approach of “sell high and buy low.” When the rebound touches the upper moving-average resistance, go short; when the price retraces to the key support below, go long with strict stop-loss placement for the corresponding “zhi sun”; do not chase the one-wa
ETH-1.97%
View Original
post-image
  • Reward
  • Comment
  • Repost
  • Share
The profit speaks for itself; the last few days of waiting were worth it📉🔥 Before going to bed, I took one last look and saw $ETH bouncing back, starting to look weak, buyers not following, and the resistance level holding firm. I reminded myself not to be fooled by the surface rally; going long requires watching the upper pressure.
When the market hadn't fully started yet, around 1817.54 was my short entry rhythm. It didn't collapse all at once; it kept failing to break through, lacked support, and grew weaker over time. This kind of position tests you the most; rushing in will get you whip
ETH-2.00%
BTC-1.34%
SOL-3.85%
View Original
post-image
  • Reward
  • Comment
  • Repost
  • Share
Many were just waiting for $SUI to rebound, but the market gave a direct opposite answer.
What really caught my attention was that after consolidating at highs for so long, the price couldn't stabilize. On the surface, it seemed like grinding, but in reality, there was constant selling pressure from above. Around 1.0030, I didn't chase long positions. Instead, I watched for confirmation on shorts, because something was wrong here. The more hesitant the position, the easier it is for a sudden directional move.
Now it's down to 0.7225. This short position has an unrealized profit of +1346.79%. W
SUI-3.19%
BTC-1.34%
ETH-2.00%
View Original
post-image
  • Reward
  • Comment
  • Repost
  • Share
Positions are disclosed directly. This $FF short order was taken from 0.10466 and held until now—price has already reached 0.05982. Currently it’s up +2061.87%. This drop and the profit from it aren’t luck; it’s the follow-through after sustained pressure at a high level.
At the start, many people still felt it could keep pushing higher, but what I was watching was the pause after the spike and the strength of the pullback. What really made me pay attention is that every time the price pushed up, it failed to form a valid continuation; instead, key levels began to be pushed lower. This is alre
FF-2.65%
BTC-1.34%
ETH-2.00%
View Original
post-image
  • Reward
  • Comment
  • Repost
  • Share
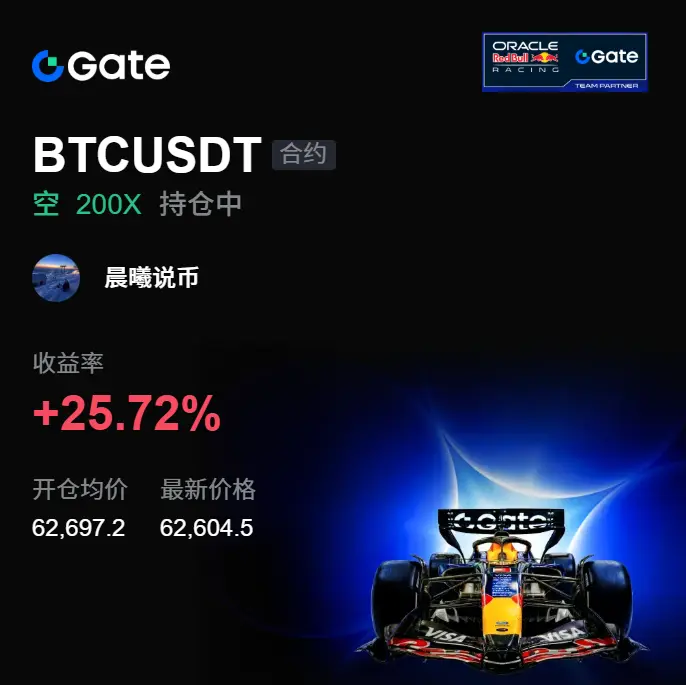
A couple of days ago, a comprehensive multi-dimensional analysis and summary: the upward breakout at 64500 actually reached a high of 64700. Currently, the long-short washout on the chart is only waiting for the CPI on the 14th and setting the stage for the Fed's interest rate decision at the end of the month.
You might as well check my posts from a few days ago, including the price ranges I mentioned in several live streams. They are basically consistent with the K-line chart you see now. Even so, it is only analysis, not prediction. The market price and K-chart of financial markets are just
BTC-1.34%
ETH-2.00%
View Original
post-image
post-image
比特币王多鱼
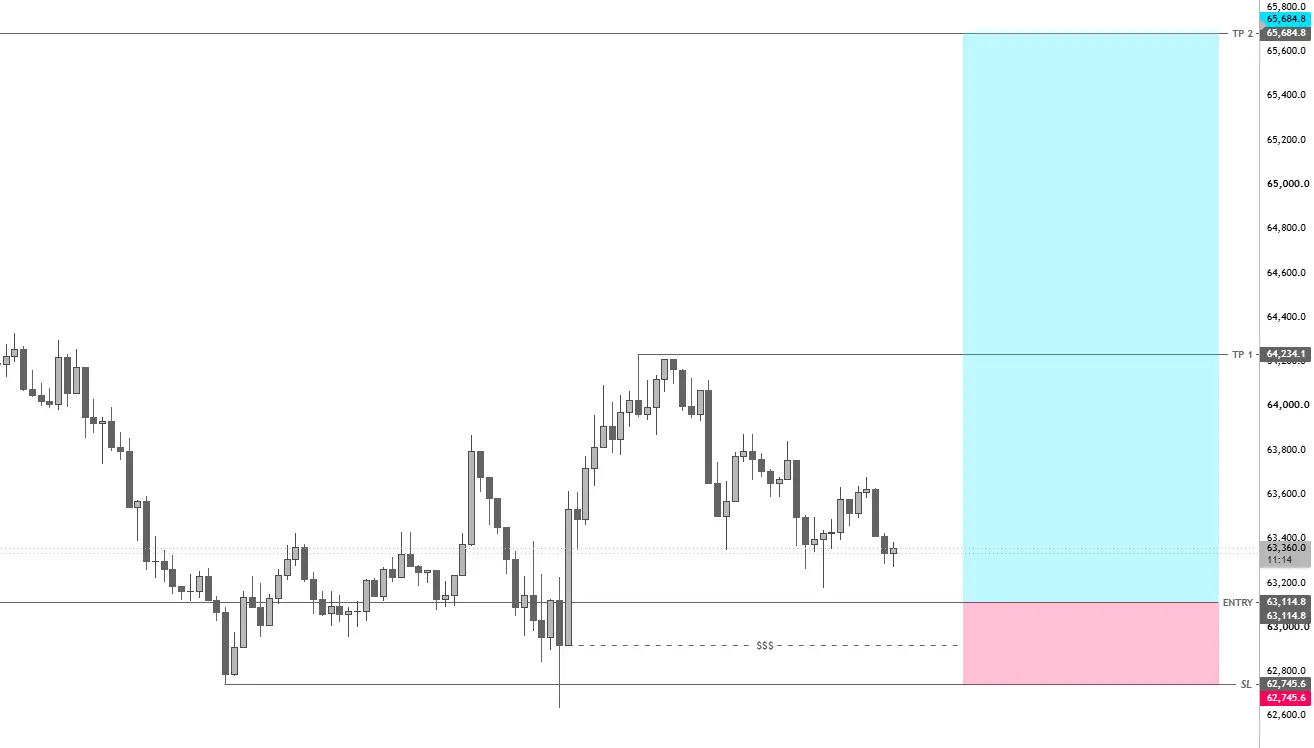
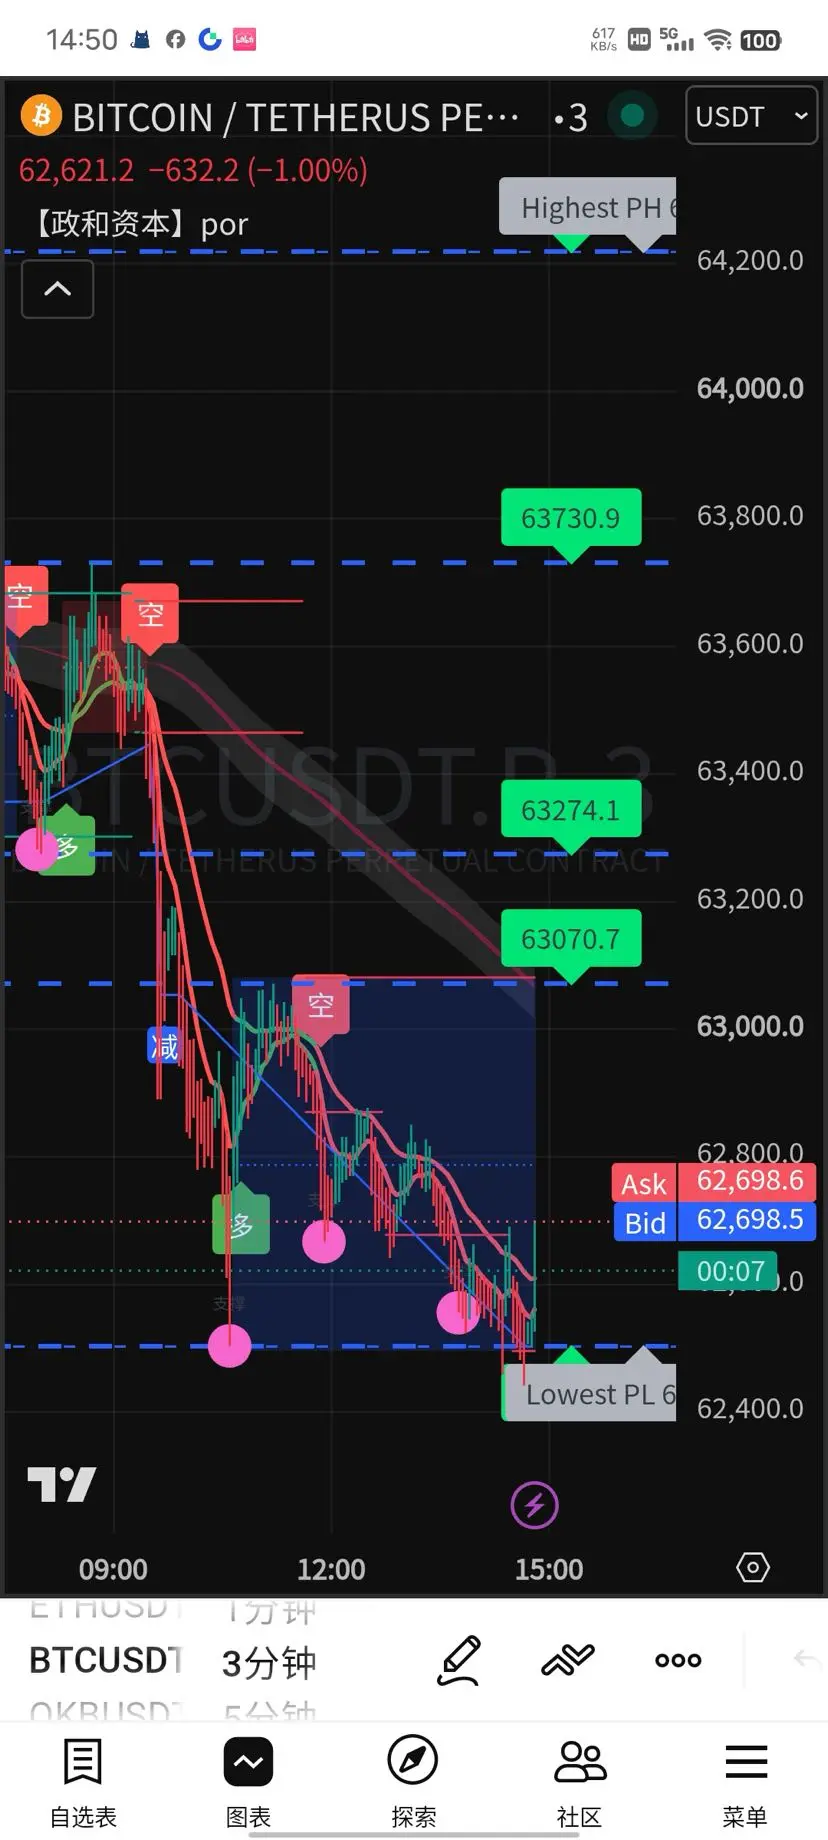
#Bitcoin 🙈 Don’t bet on one side: Before the CPI is released on the 14th, it is strictly forbidden to go heavy and bet on direction. The current volatility is enough to wipe out the stop-losses of all high-multiple leverage trades.
Watch for “wick” opportunities:
If the price sharply drops to 60,200 - 60,500 and quickly recovers, it’s a short-term long signal (betting on the rebound).
If the price quickly spikes to 63,500 - 63,800 but the volume is insufficient, it’s a short-term short signal (betting on a pullback).
Keep an eye on trading volume: The current down move is on shrinking volume, which indicates selling pressure is weakening. If the following rally can make up for the missing volume (the volume bars get higher), then the probability of breaking 64,000 will increase significantly.
At this level, patience matters more than gold. Let the bullets (CPI data) fly for a bit. What we need to do is not to predict the wind direction, but to hoist the sail when the wind comes. $ETH Remember: nobody can predict exact price levels and direction with total accuracy; all data is based on probabilities. By the way, when trading, remember to set a 2x position and set a stop loss. $BTC ‌ Spot also has opportunities to buy on dips—buying spot on dips is also a good choice ‌
repost-content-media
  • Reward
  • 1
  • Repost
  • Share
比特币王多鱼:
Double position, take profits.
This trend is really insane! A few nights ago, it was grinding so much that you wanted to close the chart, and in the morning you opened the chart and got a surprise🚀. This wave of $CBRS long positions was realized very cleanly. A few days ago in the afternoon, when everyone was still waiting and watching, I saw that the key level of CBRS wasn't broken, the price was repeatedly suppressed but couldn't be pushed down👀. This kind of grinding bottom without breaking the level, I then suggested watching for longs around 165.1. Now it has pushed from 165.1 to 178.7, with a yield of +161.12%📈🔥.
CBRS-6.52%
BTC-1.34%
ETH-2.00%
View Original
post-image
  • Reward
  • Comment
  • Repost
  • Share
$PI Either way, shorting is not as satisfying as going long, because shorting might suddenly bring in a big whale that devours all the chips without leaving a trace. Going long doesn't have this concern, and it might even lead to a short squeeze. Basically, all speculative assets will eventually experience a short squeeze, it's just a matter of at what price.
PI-7.40%
View Original
post-image
post-image
  • Reward
  • Comment
  • Repost
  • Share
【BTC (Big饼) - $63,518】
24h -0.63% small pullback, but +8.63% this week, momentum remains
24h range: $62,815 ~ $64,134
Market cap $1.27T, firmly the crypto king
【ETH (Ether) - $1,777.65】
24h -0.95% synchronized pullback, but +13.04% this week, stronger than Big饼
24h range: $1,759 ~ $1,808
Market cap $214.5 billion, solidly in second place
【Trading Suggestions】
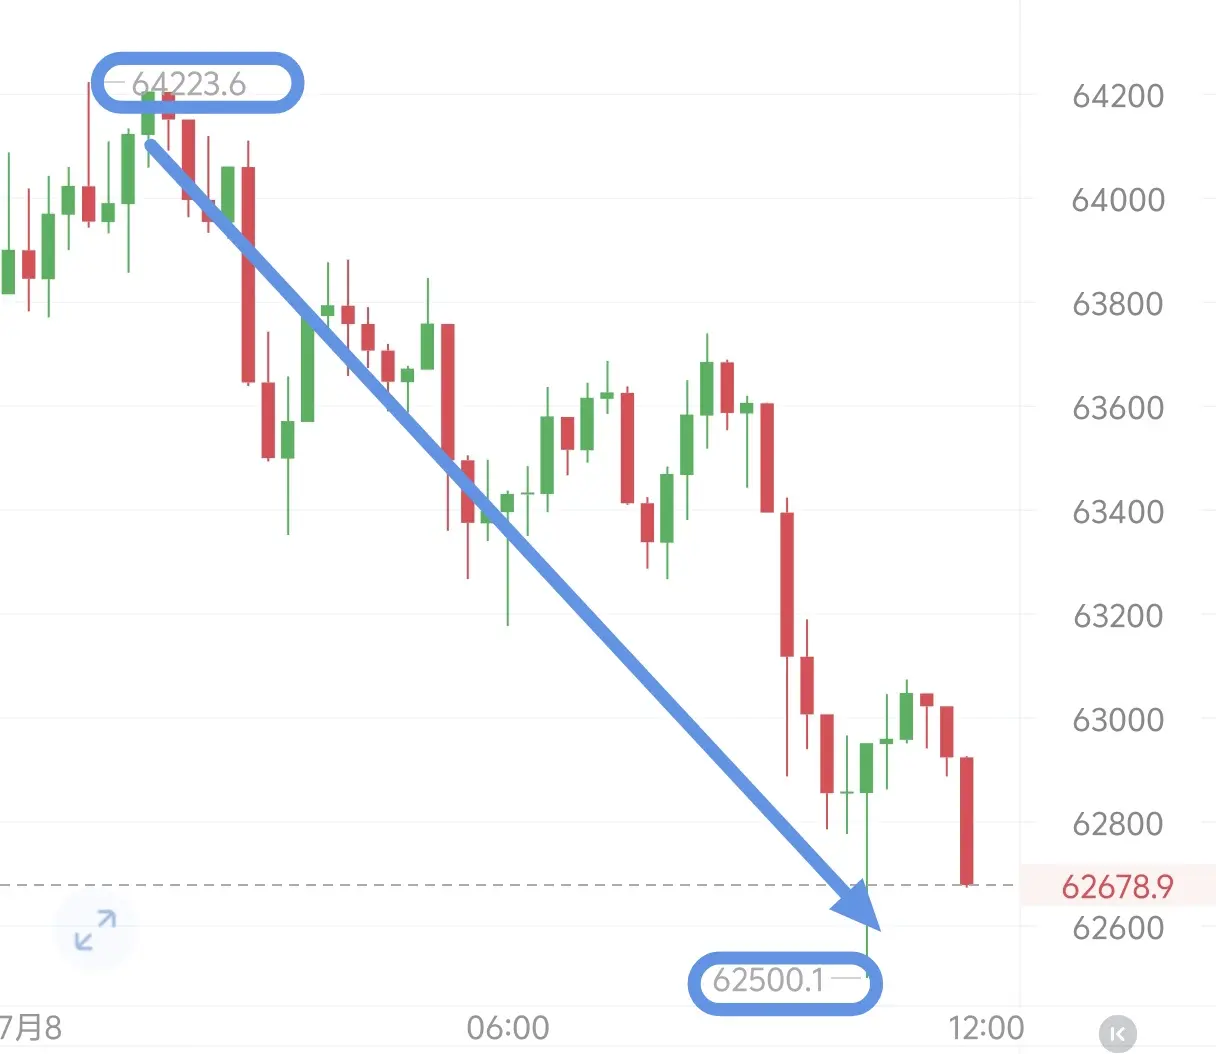
📌 BTC: Short-term view is range-bound between $62,600 ~ $64,100. If it can hold above $64,000, you can continue to hold or accumulate in batches. Support below is $62,500; if broken, take a wait-and-see approach in the short term. Medium
BTC-1.28%
ETH-1.97%
View Original
post-image
post-image
  • Reward
  • Comment
  • Repost
  • Share
Woke up and straightened up! A few days ago it was still grinding—this morning when I opened the chart, it delivered the result directly📉🚀
The last look before bed: $SPCX the rebound was still weak. When it went up, nobody stepped in—support was clearly not enough. I reminded myself then: don’t let a fake breakout drag you into the rhythm at this level; shorts have better cost-effectiveness👀🎯
Now looking back: from 198.08 down to 150.83, return +469.68%. It was truly “grinding” beforehand, and once it played out, it really felt good✅🔥💰
When it’s time to feast, don’t put on a calm
SPCX-4.42%
BTC-1.34%
ETH-2.00%
View Original
post-image
  • Reward
  • Comment
  • Repost
  • Share
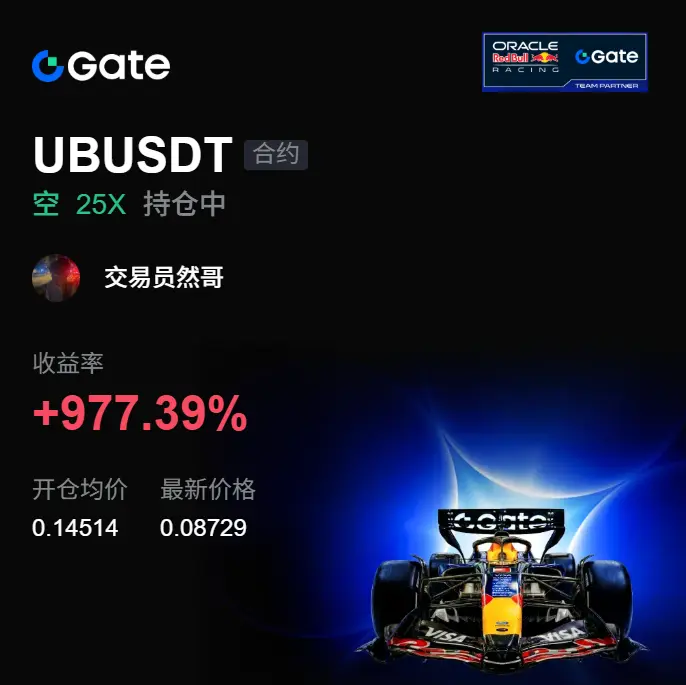
Who else gets it, fam! This one candle dumped, and the chart is no longer pretending📉🔥
A few days ago, before bed, it was still grinding, unable to break above the highs repeatedly. I was watching $UB—volume didn't follow, no one was buying the pushes, the fakeout smell was strong.

The strategy I gave back then was simple: don't chase hard when price is under resistance at the top; if the bounce is weak, look for shorts to cash out. After entering around 0.21138, I opened the chart this morning and the price had already hit 0.09372, a gain of +1364.02%. This was a tasty trade✅🎯💰

That's
UB-9.37%
BTC-1.34%
ETH-2.00%
View Original
post-image
  • Reward
  • Comment
  • Repost
  • Share
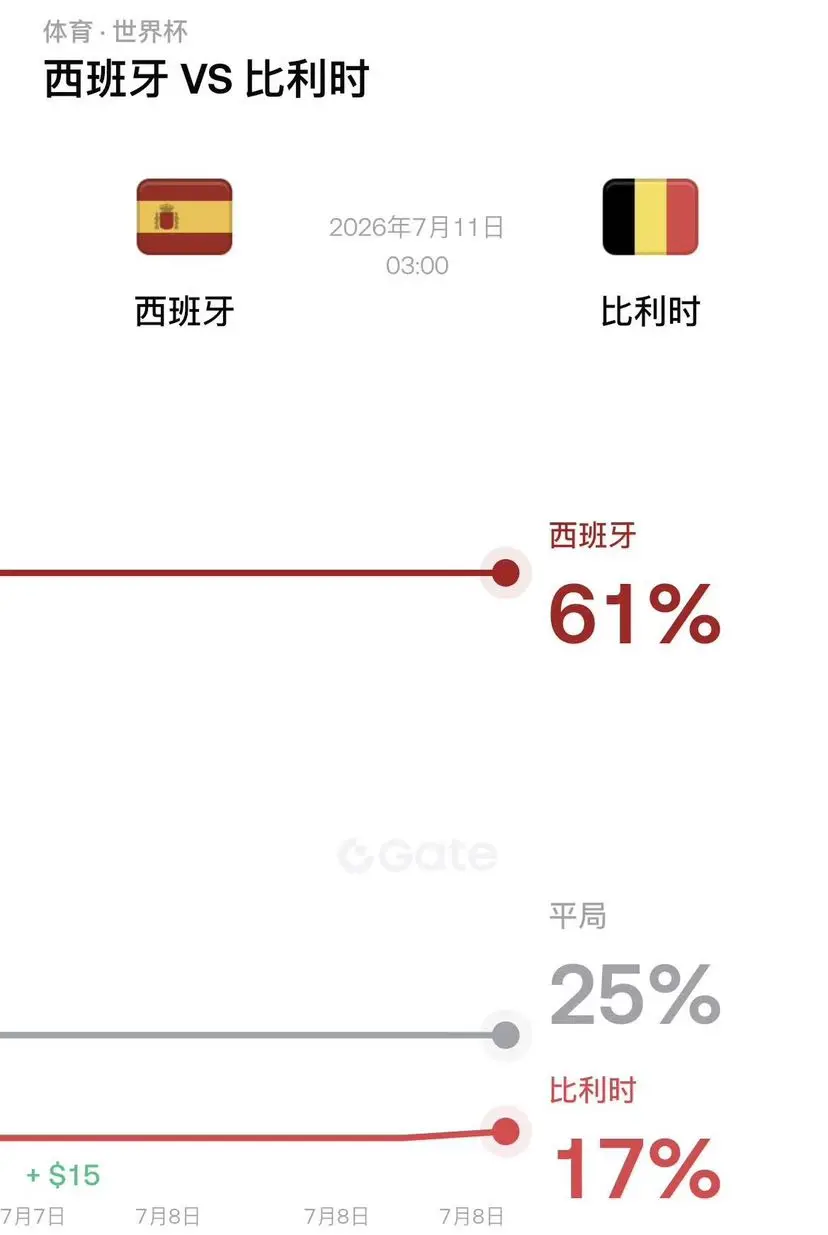
(New Streamer)World CUp Prediction
gate liveLIVE
1,396
live-coin
  • Reward
  • Comment
  • Repost
  • Share
This price movement is really insane! 🔥 The last look before bed showed it still grinding sideways, then the chart smashed down directly this morning. $GUA The feeling of a short order paying off — those who know, know. 😎
While everyone was still waiting on the sidelines, I saw it spike with no volume and weak support. The price folded the moment it hit resistance above — a heavy bull trap vibe. So I didn't hesitate and signaled to go long around 0.31860. 📌
When it's time to eat, don't pretend to be calm.
Now the price has come to 0.05653. From the entry of 0.31860, the profit shows +815.9
GUA-16.93%
BTC-1.34%
ETH-2.00%
View Original
post-image
  • Reward
  • Comment
  • Repost
  • Share
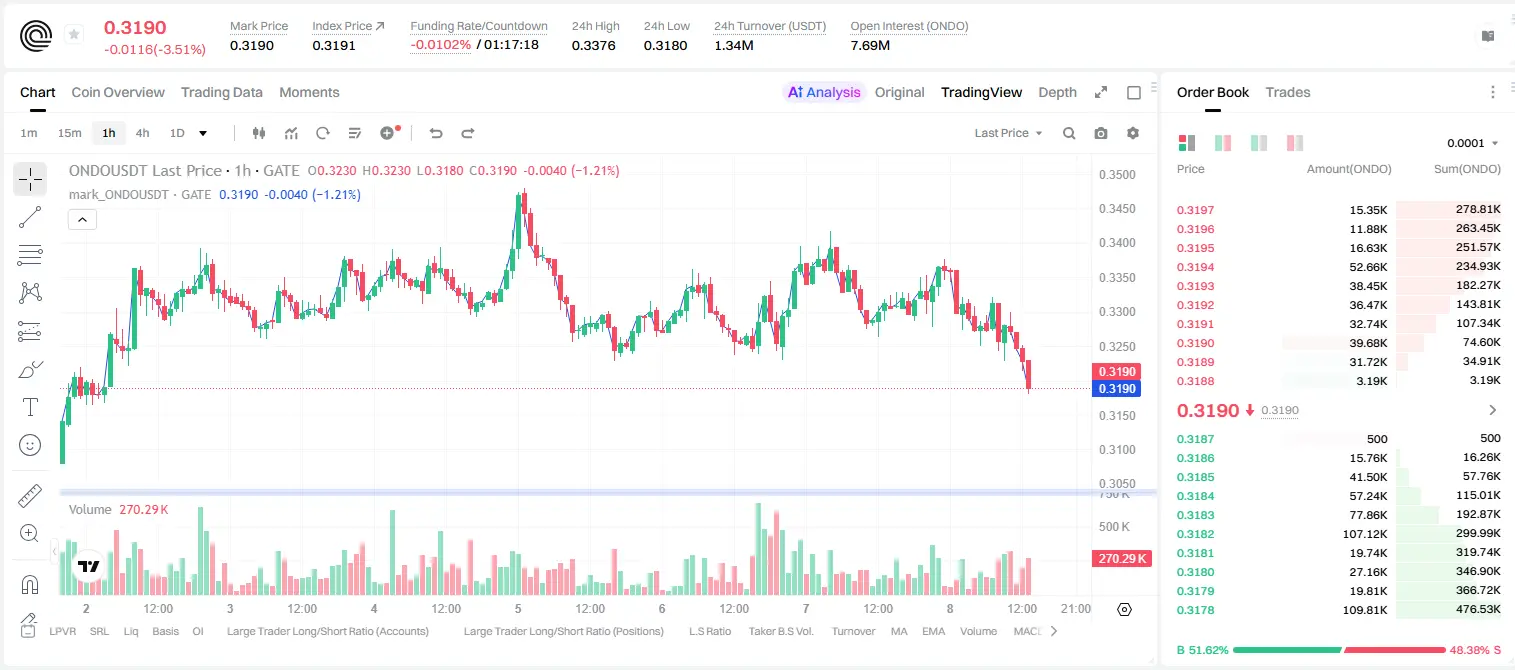
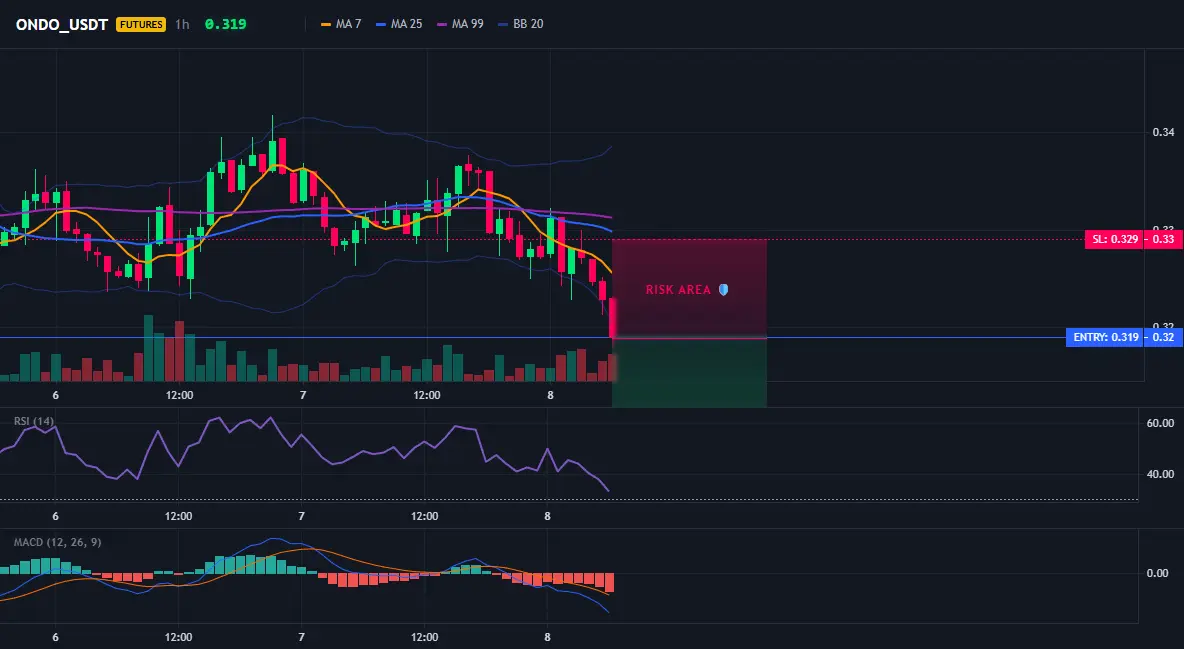
#EVAA $EVAA 15m another surge, current price $2.8765, 24h +176.64%.
The divergence in this token is now very obvious. This rally hasn’t been slow, and the capital hasn’t fully dispersed yet.
The only concern is that large positions are 55% long, with a bias toward long positions. The funding rate is at +0.051%, meaning longs are paying fees quite noticeably. For a pullback, it depends on whether there’s enough support below.
Both charts are placed below: the first shows the analysis levels, and the second shows the web-based K-line.
If it holds above $2.8046, there is still room for recovery.
EVAA141.60%
View Original
post-image
  • Reward
  • Comment
  • Repost
  • Share
#GTBurns2.57MInQ2
GT Burns 2.57 Million Tokens in Q2, Strengthening the Long Term Value of the GateToken Ecosystem
Introduction
The digital asset industry continues to evolve through innovation, ecosystem development, and responsible token management. One of the most important mechanisms supporting many blockchain ecosystems is token burning, a process that permanently removes tokens from circulation according to a project's established tokenomics. The recent announcement that 2.57 million GT were burned during the second quarter highlights Gate's continued commitment to maintaining a sustain
GT0.59%
post-image
post-image
  • Reward
  • 4
  • Repost
  • Share
ShainingMoon:
LFG 🔥
View More
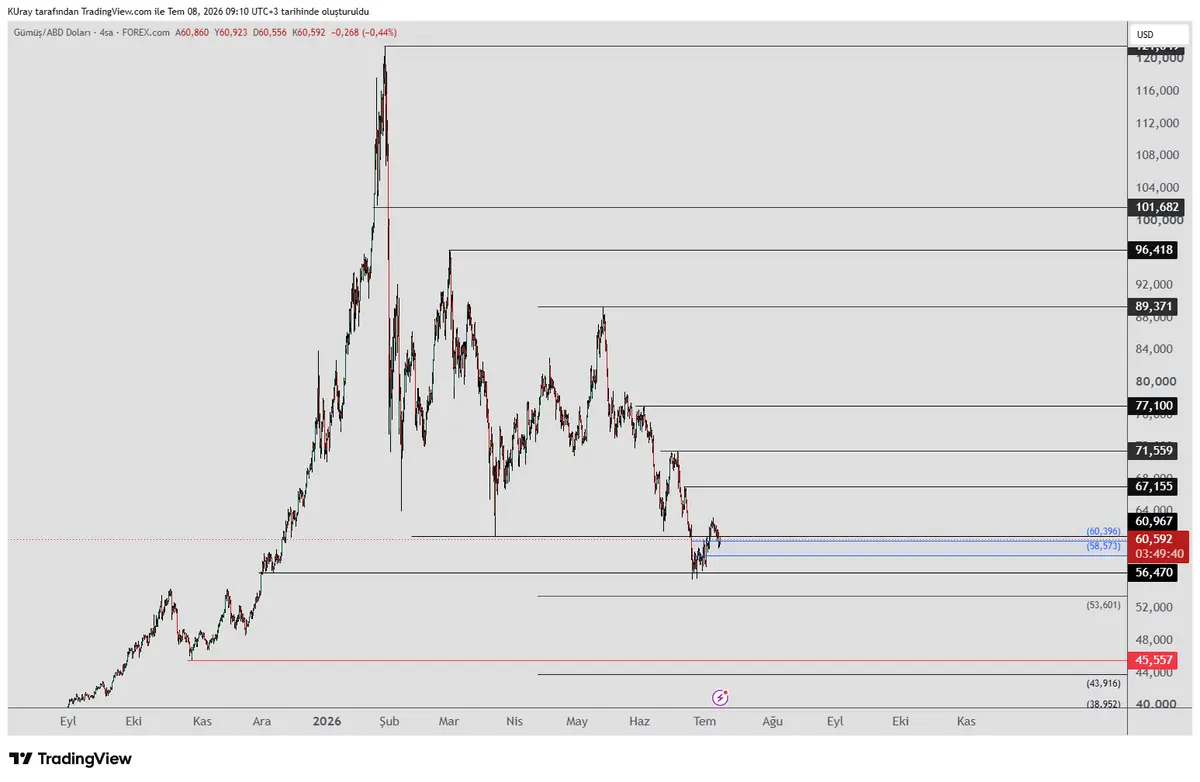
Near 59.8 silver, the main force is waiting for who to make the first move?

$XAG /USDT - LONG

Trading Plan:
Entry: 59.7 – 59.9
SL: 58.3
TP1: 60.9
TP2: 61.7
TP3: 62.8

Why pay attention to this structure?
• 4-hour bullish signal 77%, daily consolidation but not broken
• 1-hour RSI 40.94 near oversold, 15-minute showing signs of rebound
• Entry 59.8±0.1, TP1=60.9, TP2=61.7, SL=58.3
• ATR 0.476, volatility controllable, current entry has reasonable risk-reward ratio

Discussion:
Will this wave hit TP2 first and then pull back, or directly lure bulls and dump to 58.3?
XAG-2.49%
View Original
post-image
post-image
  • Reward
  • Comment
  • Repost
  • Share
Load More

Join 40 M users in our growing community

⚡️ Join 40 M users in the crypto craze discussion
💬 Engage with your favorite top creators
👍 See what interests you
  • Pinned