2025 EL Price Prediction: Expert Analysis and Market Forecast for the Upcoming Year

Introduction: EL's Market Position and Investment Value
ELYSIA (EL) is an RWA tokenization protocol that enables the trading of real-world assets around the world on blockchain. Since its launch in 2020, ELYSIA has established itself as an innovative solution in the digital asset ecosystem. As of December 2025, ELYSIA's market cap has reached approximately $13.76 million, with a circulating supply of approximately 6.80 billion EL tokens, trading at around $0.002022. This protocol, recognized for its pioneering approach to real-world asset tokenization on blockchain, is playing an increasingly important role in bridging traditional finance and decentralized markets.
This article will provide a comprehensive analysis of ELYSIA's price trends from 2025 through 2030, combining historical patterns, market supply and demand dynamics, ecosystem developments, and macroeconomic factors to deliver professional price forecasts and practical investment strategies for investors seeking exposure to the RWA tokenization sector.
ELYSIA (EL) Market Analysis Report
I. EL Price History Review and Current Market Status
EL Historical Price Movement Trajectory
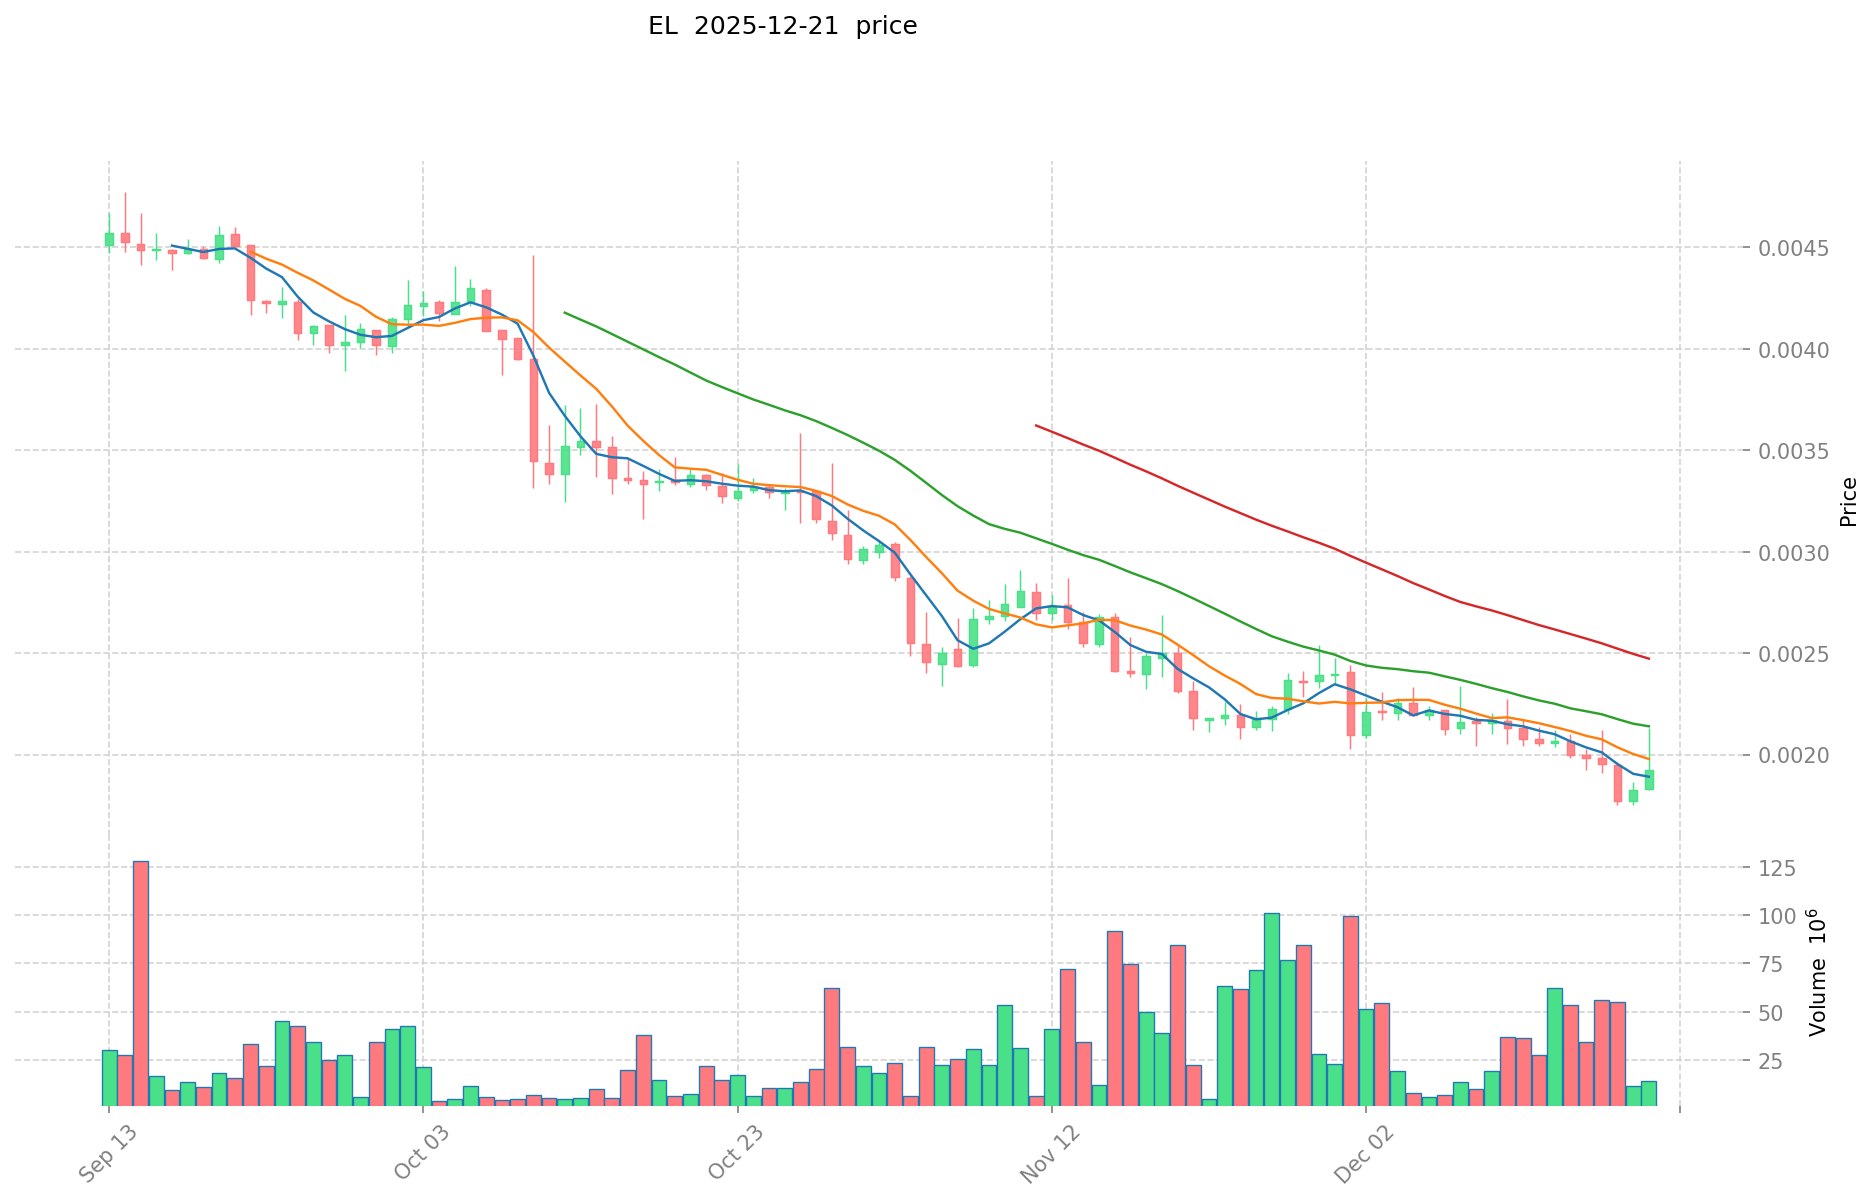
Based on available data, ELYSIA has experienced significant volatility since its market inception:
- July 25, 2024: All-time low of $0.000122 was recorded, marking the lowest point in the token's trading history.
- December 14, 2024: All-time high of $0.0197 was reached, representing a peak valuation period for the asset.
- 2025 Year-to-Date Performance: The token has declined approximately 77.05% over the past year, reflecting sustained downward pressure on valuations.
EL Current Market Status
As of December 21, 2025, ELYSIA is trading at $0.002022, with a 24-hour trading volume of $28,310.10. The token demonstrates the following key metrics:
Price Performance:
- 1-hour change: +0.65%
- 24-hour change: +10.22%
- 7-day change: -2.18%
- 30-day change: -10.37%
- Year-to-date change: -77.05%
Market Capitalization:
- Current market cap: $13,756,274.02
- Fully diluted valuation (FDV): $13,756,274.02
- Market cap to FDV ratio: 97.19%, indicating high circulating supply penetration
Supply Metrics:
- Circulating supply: 6,803,300,704.688 EL (97.19% of total supply)
- Total supply: 6,803,300,704 EL
- Maximum supply: 7,000,000,000 EL
- Current holders: 2,690
Market Positioning:
- Market rank: #1,025
- Market dominance: 0.00042%
- Number of trading venues: 3
- Trading availability: Available on Gate.com
ELYSIA operates as an ERC-20 token on the Ethereum blockchain. The token's recent 24-hour rally of 10.22% contrasts with its longer-term bearish trend, reflecting ongoing volatility in the RWA tokenization sector.
Visit EL Market Price on Gate.com for real-time data
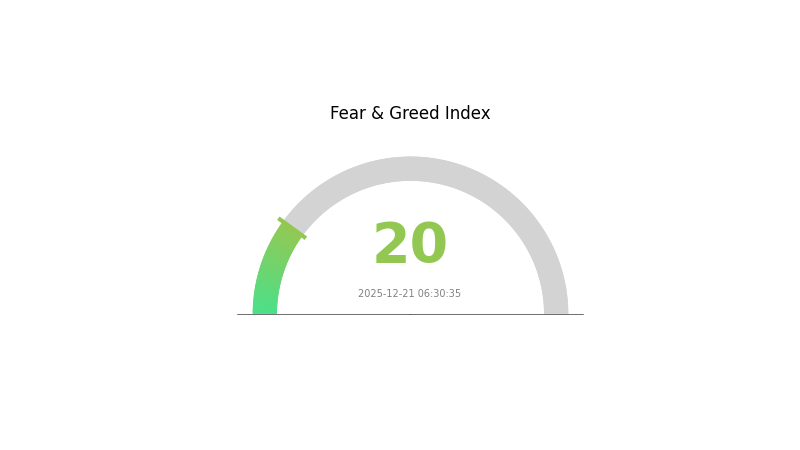
EL Market Sentiment Index
2025-12-21 Fear and Greed Index: 20 (Extreme Fear)
Click to view the current Fear & Greed Index
The cryptocurrency market is currently experiencing extreme fear, with the Fear and Greed Index at 20. This indicates significant market pessimism and widespread investor concern. During such periods, market volatility typically increases, and asset prices may face downward pressure. However, extreme fear often creates contrarian opportunities for long-term investors. Historically, markets tend to recover from such sentiment extremes. Monitor key support levels closely and consider your risk tolerance before making trading decisions on Gate.com.
EL Holdings Distribution
The address holdings distribution represents the concentration of token ownership across the blockchain network, providing critical insights into the decentralization level and potential market control dynamics. By analyzing the top addresses and their respective holdings percentages, we can assess the vulnerability to coordinated actions and the overall health of the token's economic structure.
The current EL token distribution exhibits significant concentration risk, with the top address commanding 63.55% of total holdings—a level that substantially exceeds healthy decentralization thresholds. The cumulative holdings of the top five addresses account for 92.82% of all tokens in circulation, indicating an extremely polarized ownership structure. This concentration is further compounded by the top two addresses alone controlling 76.13% of the supply, leaving only 23.87% distributed among remaining addresses and smaller holders. Such extreme consolidation raises material concerns regarding governance capture and the potential for coordinated market manipulation.
The current address distribution structure presents elevated systemic risks to market stability and price discovery mechanisms. With nearly two-thirds of the token supply concentrated in a single address, there exists pronounced vulnerability to sudden liquidations, rapid price movements triggered by large transfers, or unilateral governance decisions that could adversely affect the broader token ecosystem. The distribution pattern suggests a market structure dominated by early holders or institutional allocations, which constrains organic participation from retail investors and limits the token's ability to achieve genuine decentralization. This concentration profile necessitates careful monitoring of whale address movements and trading patterns, as their actions possess outsized influence on market dynamics and price volatility.
Click to view current EL Holdings Distribution
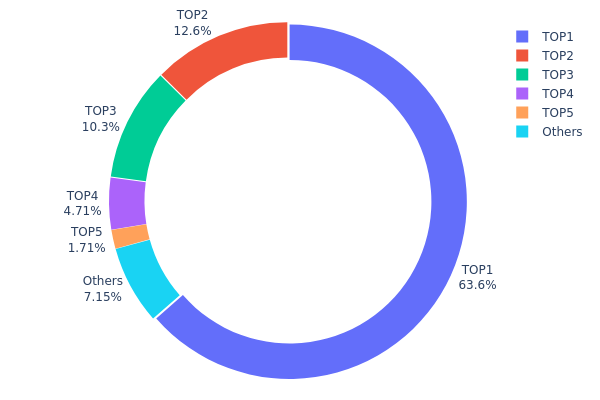
| Top | Address | Holding Qty | Holding (%) |
|---|---|---|---|
| 1 | 0x1b13...a1e452 | 4324058.48K | 63.55% |
| 2 | 0x796b...662674 | 856182.03K | 12.58% |
| 3 | 0xed5d...525b4f | 700000.00K | 10.28% |
| 4 | 0x1be9...778757 | 320571.31K | 4.71% |
| 5 | 0x3f0c...8b2c9d | 116328.09K | 1.70% |
| - | Others | 486160.80K | 7.18% |
Analysis of Core Factors Influencing EL's Future Price
II. Core Factors Affecting EL's Future Price
Macroeconomic Environment
-
Monetary Policy Impact: Central bank purchasing activity serves as a significant driver of asset prices. Strong central bank demand can provide substantial support to market valuations and price trajectories.
-
Inflation Hedge Properties: Asset prices are not solely determined by traditional present value of future earnings formulas, but are also influenced by expectations, credit constraints, and policy environments. In inflationary contexts, assets that serve as alternative value stores may benefit from increased demand.
-
Geopolitical Factors: Global economic uncertainty stemming from geopolitical events continues to impact market sentiment and asset valuations. Investor sentiment and geopolitical developments further influence price movements across asset classes.
Market Sentiment and Demand Dynamics
- USD Strength and Global Economic Conditions: EL's price trajectory is significantly influenced by US dollar strength, global inflation rates, and overall economic conditions. Market demand and investor sentiment play crucial roles in determining price direction.
Three、2025-2030 EL Price Forecast
2025 Outlook
- Conservative Forecast: $0.00177 - $0.00203
- Neutral Forecast: $0.00203
- Optimistic Forecast: $0.00299 (requiring sustained market demand and positive sentiment)
2026-2028 Mid-term Outlook
- Market Phase Expectation: The token is anticipated to enter a consolidation and gradual appreciation phase, with increasing adoption and market maturation driving price discovery mechanisms.
- Price Range Forecast:
- 2026: $0.00158 - $0.00271
- 2027: $0.00225 - $0.00337
- 2028: $0.00215 - $0.00308
- Key Catalysts: Enhanced ecosystem development, increased institutional adoption through platforms like Gate.com, growing user base expansion, and improved market liquidity conditions.
2029-2030 Long-term Outlook
- Base Case Scenario: $0.00191 - $0.00340 (assuming steady ecosystem growth and moderate market expansion)
- Optimistic Scenario: $0.00293 - $0.00425 (contingent on successful protocol upgrades and significant mainstream adoption)
- Transformational Scenario: $0.00425+ (under conditions of breakthrough technological innovations, mass adoption acceleration, and favorable macroeconomic environment)
- 2030-12-31: EL expected to stabilize in the $0.00293 - $0.00425 range (reflecting cumulative long-term growth trajectory)
| 年份 | 预测最高价 | 预测平均价格 | 预测最低价 | 涨跌幅 |
|---|---|---|---|---|
| 2025 | 0.00299 | 0.00203 | 0.00177 | 0 |
| 2026 | 0.00271 | 0.00251 | 0.00158 | 24 |
| 2027 | 0.00337 | 0.00261 | 0.00225 | 29 |
| 2028 | 0.00308 | 0.00299 | 0.00215 | 47 |
| 2029 | 0.0034 | 0.00303 | 0.00191 | 50 |
| 2030 | 0.00425 | 0.00322 | 0.00293 | 59 |
ELYSIA (EL) Professional Investment Strategy and Risk Management Report
IV. EL Professional Investment Strategy and Risk Management
EL Investment Methodology
(1) Long-term Holding Strategy
- Target Investors: RWA tokenization believers and institutional investors seeking exposure to real-world asset blockchain integration
- Operation Recommendations:
- Accumulate during market downturns when EL trades below historical support levels, given its -77.05% one-year performance represents potential value accumulation phases
- Dollar-cost averaging (DCA) approach to mitigate volatility exposure, with monthly purchases reducing timing risk
- Maintain minimum 12-24 month holding period to allow RWA protocol development and market adoption to materialize
(2) Active Trading Strategy
- Price Action Indicators:
- 24-hour volatility measurement: Monitor the 10.22% daily gain against 28,310.10 BTC trading volume to identify breakout opportunities
- Weekly trend analysis: Track the -2.18% seven-day movement against the historical high of $0.0197 to identify oversold conditions
- Wave Trading Key Points:
- Entry signals: Purchase when price approaches the 24-hour low of $0.001829, with stop-loss at previous support levels
- Exit strategy: Take profits at resistance levels near the 24-hour high of $0.002133 or when weekly momentum indicators turn negative
EL Risk Management Framework
(1) Asset Allocation Principles
- Conservative Investors: 1-2% of portfolio allocation
- Active Investors: 3-5% of portfolio allocation
- Professional Investors: 5-10% of portfolio allocation (with hedging strategies)
(2) Risk Hedging Solutions
- Portfolio diversification: Balance EL holdings with stablecoins and established cryptocurrency positions to reduce concentration risk
- Volatility hedging: Implement trailing stop-loss orders at 15-20% below entry price to protect against sudden downside movements
(3) Secure Storage Solutions
- Exchange custody: Store actively traded EL on Gate.com for immediate liquidity and trading flexibility with institutional-grade security infrastructure
- Security considerations: Enable two-factor authentication (2FA) and IP whitelisting for all accounts; maintain private keys securely offline for long-term holdings; regularly audit wallet balances and transaction history
V. EL Potential Risks and Challenges
EL Market Risk
- Liquidity concentration risk: With only 3 trading venues and relatively modest 24-hour volume of $28,310.10, EL faces potential slippage during large transactions and limited exit opportunities during market stress
- Market capitalization volatility: The $13.76 million market cap exposes EL to significant price swings from relatively small capital movements
- Historical drawdown exposure: The -77.05% one-year decline demonstrates severe downside vulnerability and limited recovery momentum
EL Regulatory Risk
- RWA regulatory uncertainty: Real-world asset tokenization remains in early regulatory framework development across most jurisdictions, creating potential compliance challenges
- Securities classification risk: Depending on regulatory interpretation, EL tokens could face reclassification as securities, triggering exchange delisting or trading restrictions
- Cross-border compliance: As ELYSIA operates globally, varying regulatory requirements across different countries create operational and legal uncertainties
EL Technology Risk
- Protocol execution risk: The RWA tokenization mechanism requires flawless smart contract implementation; vulnerabilities could result in asset loss or protocol failure
- Smart contract audit dependencies: Security relies on continuous auditing and community governance effectiveness
- Blockchain integration risk: Ethereum network congestion or upgrade changes could impact EL transaction efficiency and cost-effectiveness
VI. Conclusion and Action Recommendations
EL Investment Value Assessment
ELYSIA presents a high-risk, high-potential-reward profile as an early-stage RWA tokenization protocol. The token's 77% decline over one year reflects the speculative nature of emerging Web3 infrastructure. Success depends entirely on protocol adoption, regulatory clarity, and institutional interest in real-world asset tokenization. The limited trading liquidity and modest market capitalization indicate this remains a venture-stage investment suitable only for risk-tolerant portfolios.
EL Investment Recommendations
✅ Beginners: Allocate 0.5-1% of portfolio as educational exposure; use Gate.com's trading platform to understand RWA mechanics before committing capital ✅ Experienced Investors: Deploy 2-5% allocation with disciplined DCA strategy; implement strict stop-loss orders at 20% below purchase price ✅ Institutional Investors: Conduct thorough due diligence on ELYSIA protocol fundamentals; structure positions with hedging strategies and reserve capital for market opportunities
EL Trading Participation Methods
- Spot trading on Gate.com: Direct purchase and sale of EL tokens for immediate settlement
- Grid trading automation: Configure automated buy-low/sell-high orders on Gate.com to optimize trading efficiency
- Wallet holdings: Transfer EL to self-custody wallets for long-term strategic positioning while maintaining on-exchange liquidity for tactical adjustments
Cryptocurrency investments carry extreme risk. This report does not constitute investment advice. Investors must make decisions based on personal risk tolerance and should consult professional financial advisors. Never invest capital you cannot afford to lose completely.
FAQ
Is EL a strong buy?
Yes, EL is recommended as a strong buy. 40% of analysts rate it as strong buy with positive consensus. Current market sentiment supports accumulation at current levels for long-term growth potential.
Is EL a good stock to buy now?
EL is recommended by 40% of analysts as a Strong Buy, suggesting positive market sentiment. Current consensus indicates it could be a good buying opportunity based on analyst ratings and positive outlook.
Should I sell my EL stock?
Analysts recommend holding EL stock. Current market consensus is positive with strong fundamentals. Consider your personal investment goals and risk tolerance before making decisions.
What is the price of Estee Lauder stock in 2030?
Estee Lauder stock is expected to average $108.45 in 2030, with forecasts ranging from $66.96 to $149.93 based on current market analysis.
Share
Content
Introduction: EL's Market Position and Investment Value
I. EL Price History Review and Current Market Status
II. Core Factors Affecting EL's Future Price
Three、2025-2030 EL Price Forecast
IV. EL Professional Investment Strategy and Risk Management
V. EL Potential Risks and Challenges
VI. Conclusion and Action Recommendations
FAQ
How to Buy Cryptocurrency


Trending Cryptocurrencies


2025 WHITEPrice Prediction: Analysis of Market Trends and Future Value Potential

SIX vs QNT: Analyzing Performance Metrics of Two Leading Blockchain Technology Platforms

What Will ONDO Price Be in 2025? Analyzing Historical Trends and Market Predictions
EL vs HBAR: Comparing the Performance and Applications of Different Quantum Computing Architectures

2025 PLUME Price Prediction: Analyzing Market Trends and Potential Growth Factors for the Emerging Cryptocurrency
2025 BST Price Prediction: Analyzing Market Trends and Potential Growth Factors

Exploring the Future Prospects and Revival Potential of XRP

How do crypto derivatives market signals predict price movements: analyzing futures open interest, funding rates, and liquidation data?

Understanding Stablecoin Varieties: A Comparison Guide for Choosing Wisely

What is Monad (MON) fundamentals analysis: whitepaper logic, use cases, and team background explained?

Jupiter Crypto Value Projection: Can JUP Surpass $2 by 2030?