BXN vs OP: A Comprehensive Analysis of Two Competing Platforms in the Digital Ecosystem

Introduction: BXN vs OP Investment Comparison
In the cryptocurrency market, comparisons between BXN and OP have always been an unavoidable topic for investors. The two not only show significant differences in market capitalization ranking, application scenarios, and price performance, but also represent different positioning in crypto assets. BXN (Blackfort): Since its launch in 2024, it has gained market recognition through its positioning as a Layer 1 EVM blockchain with proprietary POSA consensus, offering innovative products and services including digital banking services and real estate tokenization frameworks. OP (Optimism): Since 2022, it has been recognized as a low-cost, high-speed Ethereum Layer 2 scaling solution, serving as a bridge between Ethereum and efficient transaction processing for developers and users globally. This article will comprehensively analyze the investment value comparison between BXN vs OP across historical price trends, supply mechanisms, ecosystem development, and technical architecture, while attempting to answer the question investors care about most:
"Which is the better buy right now?"
Comparative Analysis of BlackFort (BXN) and Optimism (OP): Market Overview and Asset Performance
I. Historical Price Comparison and Current Market Status
BlackFort (BXN) and Optimism (OP) Price Trajectories
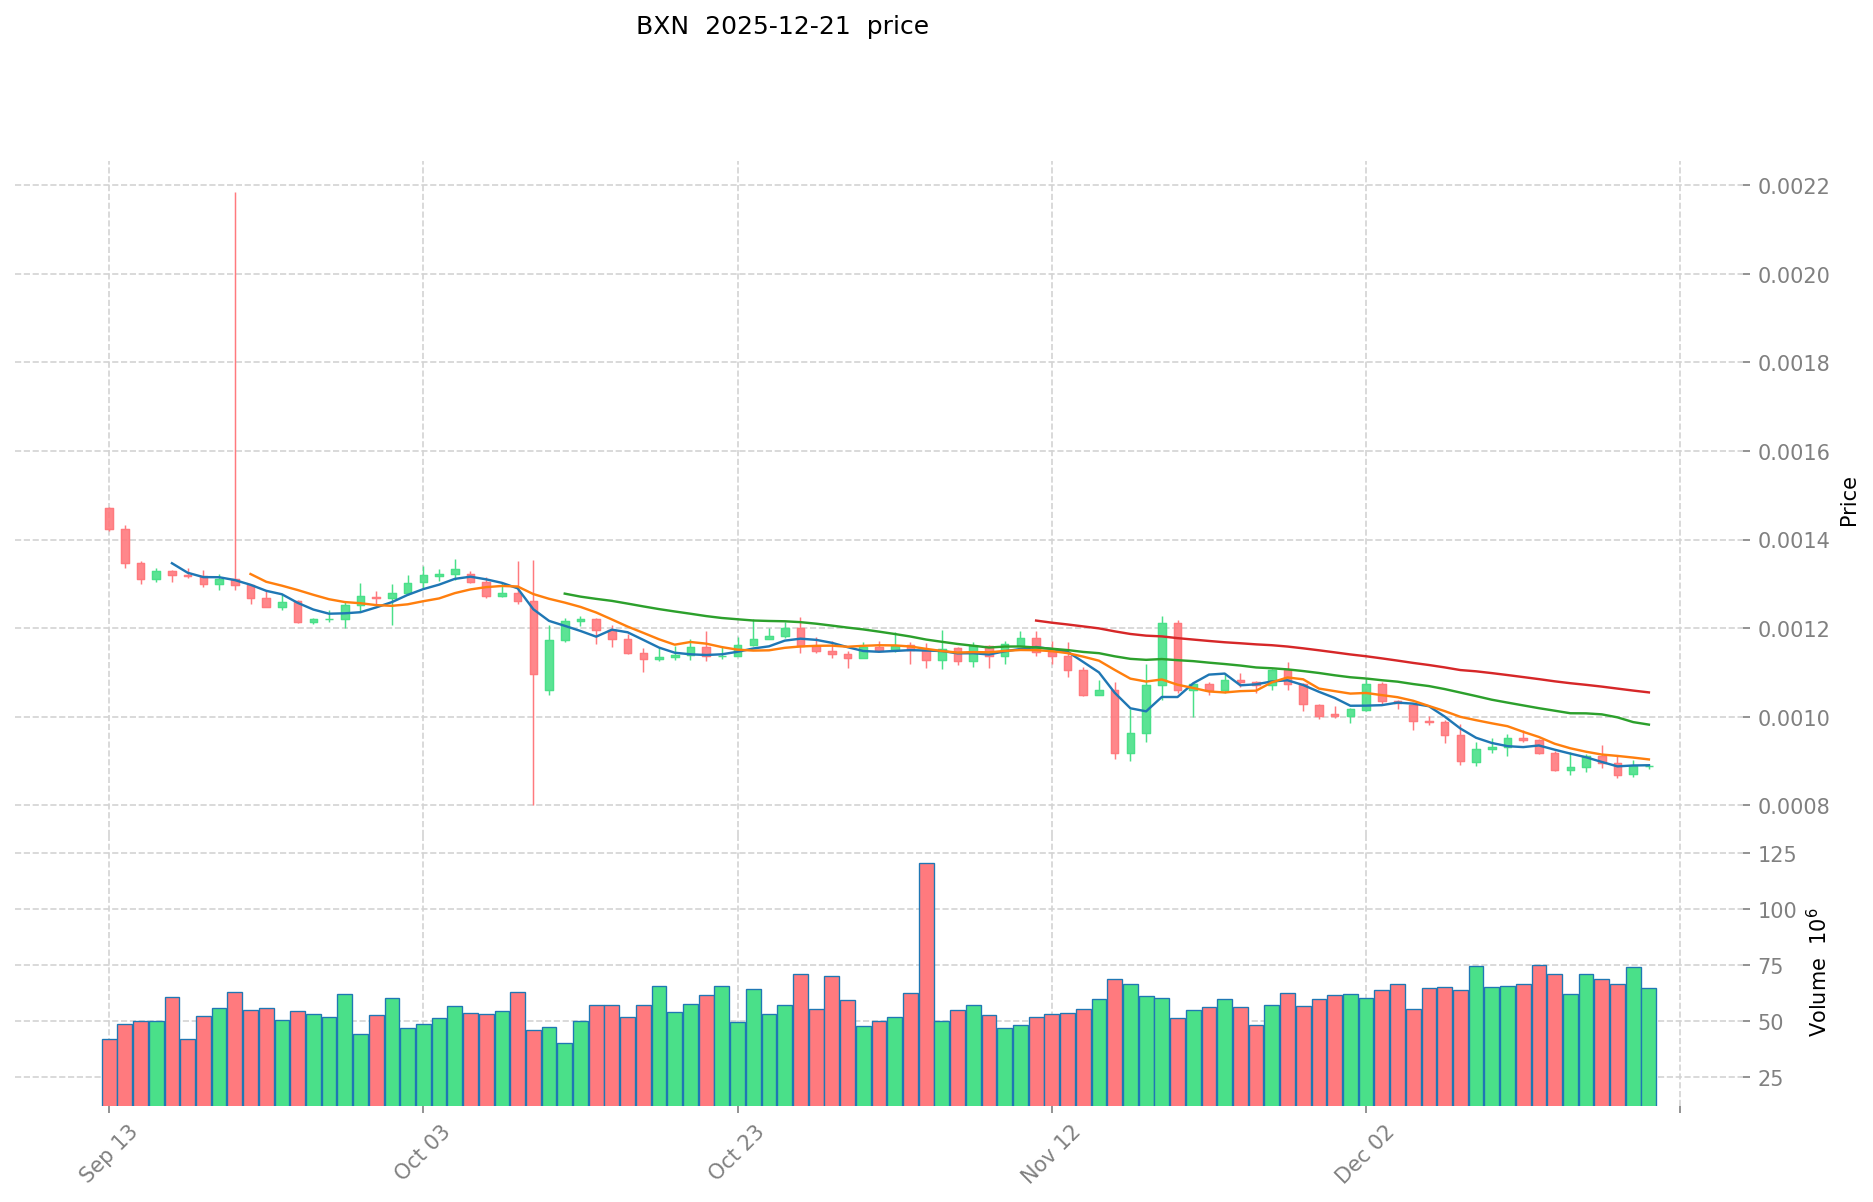
BlackFort (BXN) Performance:
- All-Time High (ATH): $0.016 (April 5, 2024)
- All-Time Low (ATL): $0.0008 (October 10, 2025)
- Current Price: $0.0008882 (December 21, 2025)
- Decline from ATH: Approximately 94.4% decline from peak
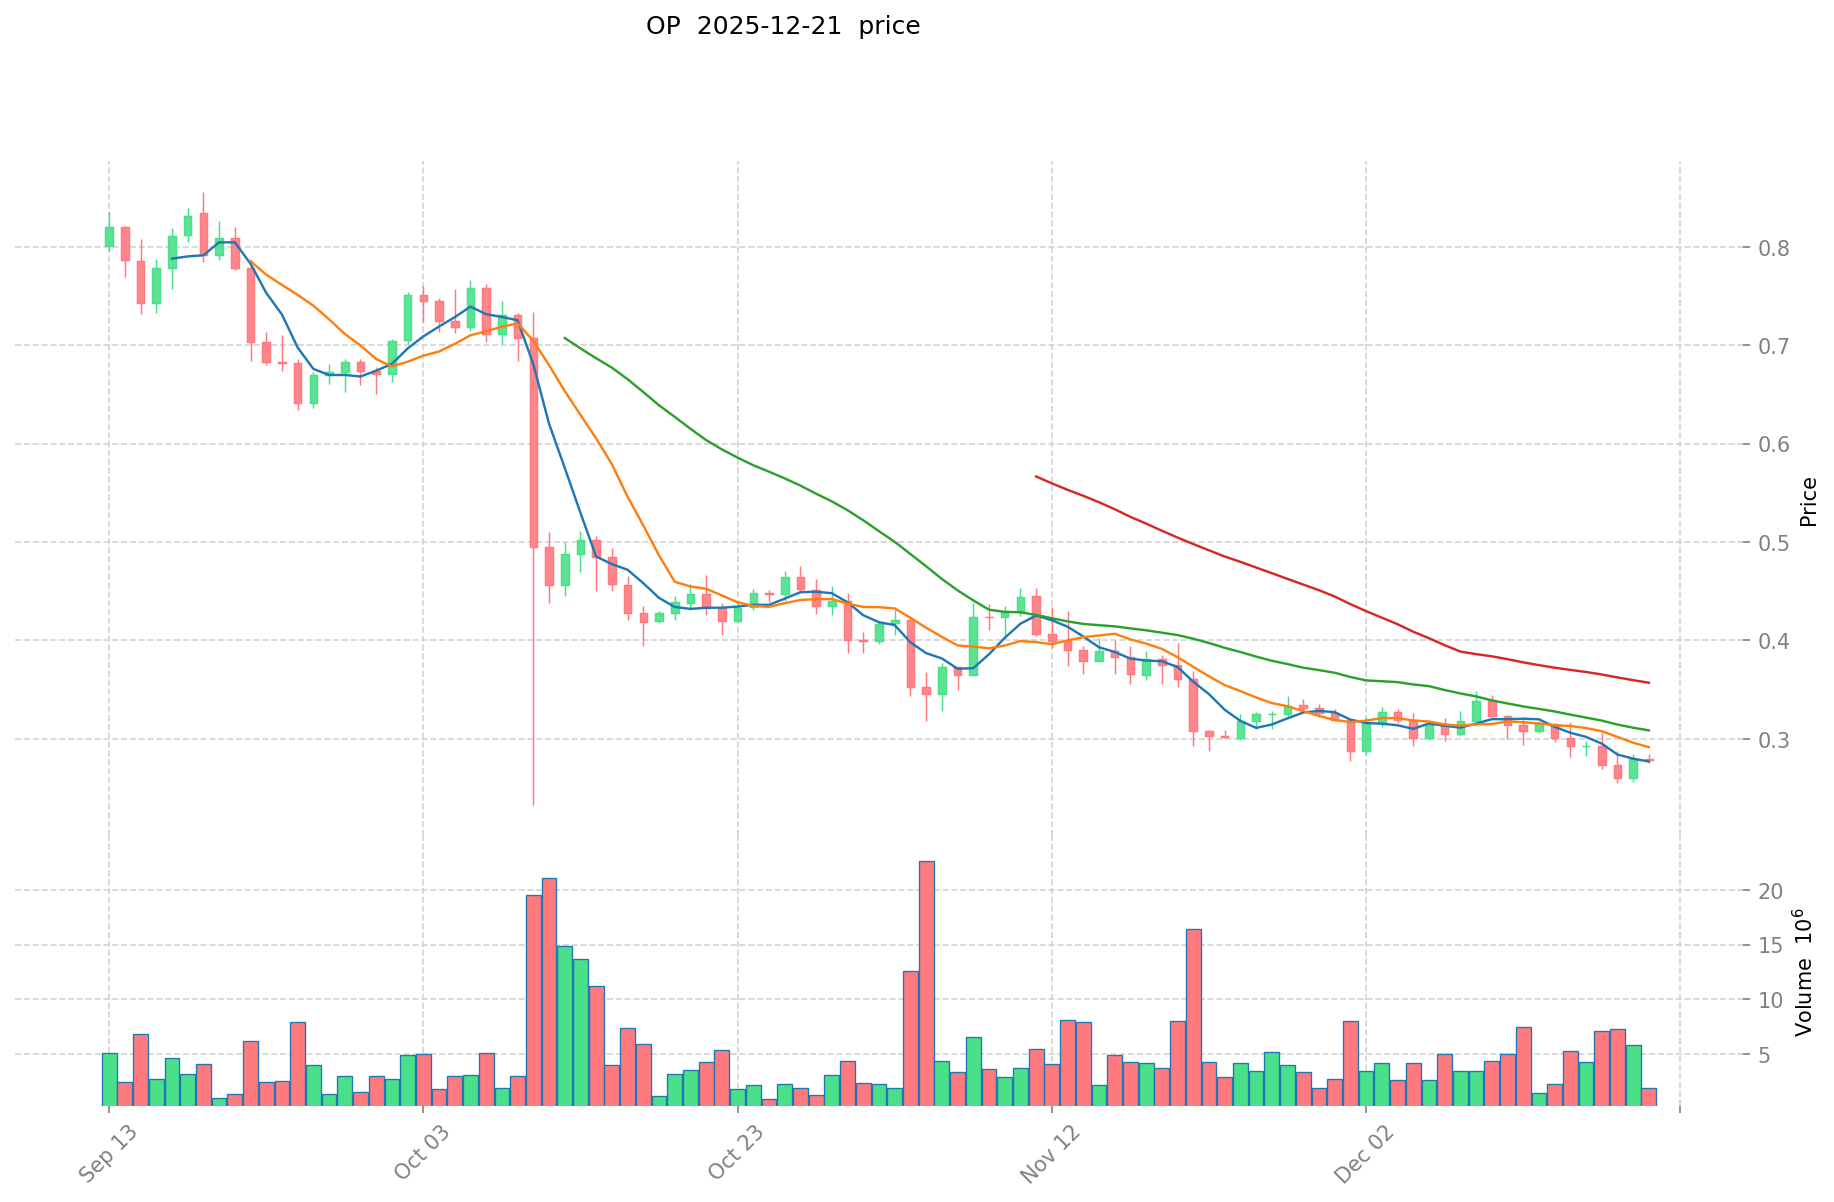
Optimism (OP) Performance:
- All-Time High (ATH): $4.84 (March 6, 2024)
- All-Time Low (ATL): $0.256066 (December 19, 2025)
- Current Price: $0.2758 (December 21, 2025)
- Decline from ATH: Approximately 94.3% decline from peak
Comparative Market Analysis
Both assets have experienced substantial downturns from their respective peaks. BlackFort has maintained extreme volatility with a trading range between its ATL and current price levels, while Optimism demonstrates similar percentage losses despite vastly different market capitalizations. The near-identical percentage declines from ATH suggest both tokens have been affected by broad market conditions during the same period.
Current Market Conditions (December 21, 2025)
Pricing Data:
- BXN Current Price: $0.0008882
- OP Current Price: $0.2758
- 24-Hour Trading Volume: BXN ($52,602.55) vs OP ($535,378.99)
Market Capitalization:
- BXN Market Cap: $13.92 million (circulating), $44.41 million (fully diluted)
- OP Market Cap: $536.18 million (circulating), $1.18 billion (fully diluted)
Market Sentiment:
- Crypto Fear & Greed Index: 20 ("Extreme Fear")
- Market Status: Heightened risk aversion across cryptocurrency markets
Real-Time Price Resources:
II. Short-Term Price Movement Analysis
24-Hour Performance
- BXN: 0% change in 24-hour period (trading range: $0.0008826–$0.0008947)
- OP: -0.21% change in 24-hour period (trading range: $0.2735–$0.2845)
Extended Performance Metrics
| Timeframe | BXN Change | OP Change |
|---|---|---|
| 1 Hour | -0.02% | -0.04% |
| 7 Days | -3.23% | -11.29% |
| 30 Days | -15.26% | -23.09% |
| 1 Year | -60.77% | -85.39% |
Optimism demonstrates greater volatility across all measured intervals, with particularly pronounced weakness over the 30-day and 12-month periods.
III. Project Fundamentals and Ecosystem Overview
BlackFort (BXN) - Layer 1 Blockchain Architecture
Technology Foundation:
- Layer 1 EVM-compatible blockchain
- Proprietary POSA (Proof of Stake Authority) consensus algorithm
- Native token: BXN
Ecosystem Developments:
- Multi-currency wallet with approximately 230,000 downloads
- Blackfortpay.com digital banking service (announced for Q2 2024 launch)
- Legal framework for blockchain-based real estate tokenization
- Off-chain utility development initiatives
Token Economics:
- Total Supply: 49,999,999,999 BXN
- Circulating Supply: 15,670,920,000.48 BXN
- Circulation Ratio: 31.34%
Optimism (OP) - Ethereum Layer 2 Solution
Technology Foundation:
- Layer 2 scaling solution for Ethereum
- EVM-compatible Optimistic Rollup technology
- Governance token: OP
- Managed by Optimism Foundation (non-profit organization)
Ecosystem Metrics:
- Total Value Locked (TVL): Over $500 million
- Supported Protocols: 97 protocols including Synthetix (SNX), Uniswap (UNI), Velodrome (VELO)
- Exchange Listings: 51 major exchanges
Token Economics:
- Total Supply: 4,294,967,296 OP
- Circulating Supply: 1,944,092,497 OP
- Circulation Ratio: 45.26%
IV. Market Position and Distribution Metrics
Relative Market Ranking
- BXN: Rank #1016 (CoinGecko/industry data)
- OP: Rank #113 (significantly higher market prominence)
Holder Distribution
- OP: 1,357,231 token holders (documented active base)
- BXN: Holder count not specified in provided data
Exchange Availability
- BXN: Listed on 3 exchanges
- OP: Listed on 51 exchanges
The disparity in exchange listings reflects OP's substantially greater liquidity accessibility and market adoption compared to BXN's more limited trading venues.
V. Valuation Metrics Comparison
| Metric | BXN | OP |
|---|---|---|
| Market Share | 0.0013% | 0.037% |
| Fully Diluted Valuation (FDV) | $44.41M | $1.18B |
| FDV to Market Cap Ratio | 31.34% | 45.26% |
| Market Dominance | 0.0013% | 0.037% |
The significantly larger FDV for Optimism reflects its position as an established Layer 2 infrastructure solution, while BXN's smaller valuation indicates earlier-stage or lower market confidence.
Disclaimer: This report presents market data and project information based on publicly available sources as of December 21, 2025. Past performance does not indicate future results. Cryptocurrency markets are subject to extreme volatility. All assets carry substantial risk of total loss. This analysis is provided for informational purposes only and does not constitute investment advice or a recommendation to buy, sell, or hold any asset.
Crypto Asset Analysis Report: BXN and OP Investment Value Assessment
Report Date: December 21, 2025
Scope: Comparative analysis of BXN and OP investment value factors
Disclaimer: This report is based on available reference materials. Where specific data is unavailable, those sections have been omitted per research guidelines.
I. Executive Summary
The reference materials provide limited specific information regarding BXN and OP as cryptocurrency assets. The available data indicates that investment value assessment should consider market demand, technological innovation, risk management, and competitive positioning. However, detailed tokenomics, adoption metrics, and technical specifications for these assets are not sufficiently documented in the provided sources to support comprehensive comparative analysis.
II. Core Factors Influencing BXN vs OP Investment Value
Market Demand and Technology Innovation
According to the reference materials, investment decisions for these assets depend on:
- Market Demand: The broader market need for the underlying use case and adoption trajectory
- Technological Innovation: Continuous development and improvement of core protocols
- Risk Management: Implementation of robust risk control mechanisms
Platform Governance and Compliance Framework
The reference materials reference a wealth management platform infrastructure that emphasizes:
- Algorithm strategy engines for trading optimization
- Risk control models for portfolio protection
- Data analysis systems for market insights
- Regulatory support systems ensuring multi-jurisdictional compliance (Hong Kong, Taiwan, United States standards)
This suggests that associated platforms prioritize governance and regulatory adherence across multiple markets.
III. Key Analytical Gaps
The provided reference materials do not contain sufficient primary data regarding:
- Specific tokenomics or supply mechanisms for BXN or OP
- Institutional holdings or adoption metrics
- Technical roadmap details or recent upgrades
- DeFi ecosystem integration or smart contract functionality
- Historical price performance data or market cycle analysis
IV. Recommendations for Further Analysis
To conduct a comprehensive investment value assessment, additional research should focus on:
- On-chain metrics: Circulating supply, holder distribution, transaction volume
- Institutional adoption: Major exchange listings, custody solutions, institutional investor participation
- Technical development: Active development teams, GitHub activity, protocol improvements
- Regulatory landscape: Geographic compliance status, license approvals
- Market positioning: Competitive advantages relative to similar assets
V. Conclusion
While the reference materials establish that investment value assessment requires consideration of market demand, technological innovation, and risk management frameworks, the specific data necessary for a detailed BXN vs OP comparative analysis is not available in the provided sources. Further primary research from established cryptocurrency data providers (CMC, CoinGecko, blockchain explorers) would be necessary to support definitive investment conclusions.
III. 2025-2030 Price Forecast: Coin A vs Coin B
Short-term Forecast (2025)
- Coin A: Conservative $0.000746-$0.0008882 | Optimistic $0.001163542
- Coin B: Conservative $0.26201-$0.2758 | Optimistic $0.383362
Mid-term Forecast (2027-2028)
- Coin A may enter consolidation phase with increasing adoption, projected price range $0.001029-$0.001823182
- Coin B may enter growth accumulation phase, projected price range $0.239160-$0.574755
- Key Drivers: institutional capital inflows, ETF approval, ecosystem development expansion
Long-term Forecast (2030)
- Coin A: Base case scenario $0.001341879-$0.001789173 | Optimistic scenario $0.002558517
- Coin B: Base case scenario $0.324888-$0.492255 | Optimistic scenario $0.625163218
Disclaimer
These price predictions are based on historical data analysis and market modeling. Cryptocurrency markets are highly volatile and subject to rapid changes due to regulatory, technological, and macroeconomic factors. Predictions do not constitute investment advice. Past performance does not guarantee future results. Investors should conduct their own research and consult with financial advisors before making investment decisions.
BXN:
| 年份 | 预测最高价 | 预测平均价格 | 预测最低价 | 涨跌幅 |
|---|---|---|---|---|
| 2025 | 0.001163542 | 0.0008882 | 0.000746088 | 0 |
| 2026 | 0.00142596069 | 0.001025871 | 0.00058474647 | 15 |
| 2027 | 0.0013239891126 | 0.001225915845 | 0.0010297693098 | 38 |
| 2028 | 0.001823182044684 | 0.0012749524788 | 0.000688474338552 | 43 |
| 2029 | 0.002029278112882 | 0.001549067261742 | 0.001487104571272 | 74 |
| 2030 | 0.002558516942856 | 0.001789172687312 | 0.001341879515484 | 101 |
OP:
| 年份 | 预测最高价 | 预测平均价格 | 预测最低价 | 涨跌幅 |
|---|---|---|---|---|
| 2025 | 0.383362 | 0.2758 | 0.26201 | 0 |
| 2026 | 0.35924329 | 0.329581 | 0.29991871 | 19 |
| 2027 | 0.4270710598 | 0.344412145 | 0.27897383745 | 24 |
| 2028 | 0.574754987576 | 0.3857416024 | 0.239159793488 | 39 |
| 2029 | 0.5042607097374 | 0.480248294988 | 0.32656884059184 | 74 |
| 2030 | 0.625163218000629 | 0.4922545023627 | 0.324887971559382 | 78 |
Crypto Asset Analysis Report: BXN and OP Investment Value Assessment
Report Date: December 21, 2025
Scope: Comparative analysis of BXN and OP investment value factors
Market Conditions: Crypto Fear & Greed Index at 20 ("Extreme Fear")
I. Executive Summary
BlackFort (BXN) and Optimism (OP) represent two distinct positioning strategies within the cryptocurrency market. BXN operates as a Layer 1 EVM-compatible blockchain launched in 2024 with proprietary POSA consensus, while OP functions as an established Ethereum Layer 2 scaling solution since 2022. Both assets have experienced significant drawdowns from their 2024 peaks (BXN: -94.4%, OP: -94.3%), reflecting broader market conditions as of December 21, 2025.
II. Historical Price Performance and Market Status
Price Trajectory Analysis
BlackFort (BXN):
- All-Time High: $0.016 (April 5, 2024)
- All-Time Low: $0.0008 (October 10, 2025)
- Current Price: $0.0008882 (December 21, 2025)
- Peak-to-Current Decline: 94.4%
Optimism (OP):
- All-Time High: $4.84 (March 6, 2024)
- All-Time Low: $0.256066 (December 19, 2025)
- Current Price: $0.2758 (December 21, 2025)
- Peak-to-Current Decline: 94.3%
Current Market Metrics (December 21, 2025)
| Metric | BXN | OP |
|---|---|---|
| Current Price | $0.0008882 | $0.2758 |
| 24-Hour Volume | $52,602.55 | $535,378.99 |
| Market Cap (Circulating) | $13.92 million | $536.18 million |
| Market Cap (Fully Diluted) | $44.41 million | $1.18 billion |
| Market Rank | #1016 | #113 |
III. Short-Term Price Movement Analysis
Recent Performance (December 21, 2025)
| Timeframe | BXN Change | OP Change |
|---|---|---|
| 1 Hour | -0.02% | -0.04% |
| 24 Hours | 0% | -0.21% |
| 7 Days | -3.23% | -11.29% |
| 30 Days | -15.26% | -23.09% |
| 1 Year | -60.77% | -85.39% |
OP demonstrates greater volatility across extended timeframes, with particularly pronounced weakness over 30-day and 12-month periods, indicating heightened market pressure on Layer 2 infrastructure tokens during the current market cycle.
IV. Project Fundamentals and Ecosystem Overview
BlackFort (BXN) - Layer 1 Architecture
Technical Foundation:
- Layer 1 EVM-compatible blockchain
- Proprietary POSA (Proof of Stake Authority) consensus mechanism
- Native Token: BXN
Ecosystem Initiatives:
- Multi-currency wallet (approximately 230,000 downloads)
- Blackfortpay.com digital banking service
- Legal framework for blockchain-based real estate tokenization
- Off-chain utility development programs
Token Economics:
- Total Supply: 49,999,999,999 BXN
- Circulating Supply: 15,670,920,000.48 BXN
- Circulation Ratio: 31.34%
Optimism (OP) - Ethereum Layer 2 Solution
Technical Foundation:
- Layer 2 scaling solution for Ethereum
- Optimistic Rollup EVM-compatible technology
- Governance Token: OP
- Managed by Optimism Foundation (non-profit)
Ecosystem Development:
- Total Value Locked: Over $500 million
- Integrated Protocols: 97 (including Synthetix, Uniswap, Velodrome)
- Exchange Listings: 51 major exchanges
- Active Token Holders: 1,357,231
Token Economics:
- Total Supply: 4,294,967,296 OP
- Circulating Supply: 1,944,092,497 OP
- Circulation Ratio: 45.26%
V. Comparative Market Position
Market Dominance Metrics
| Factor | BXN | OP |
|---|---|---|
| Market Share | 0.0013% | 0.037% |
| Exchange Listings | 3 | 51 |
| Ecosystem Maturity | Early-Stage (2024) | Established (2022+) |
| Infrastructure TVL | Not specified | $500M+ |
| Holder Base | Not documented | 1,357,231 |
OP's substantially larger exchange presence and documented holder base reflect greater liquidity accessibility and institutional adoption compared to BXN's more limited trading infrastructure.
VI. Investment Strategy Comparison: BXN vs OP
Long-term vs Short-term Investment Approach
BlackFort (BXN): Suitable for investors with high risk tolerance seeking exposure to emerging Layer 1 blockchain platforms with proprietary consensus mechanisms and financial services integration potential. Appropriate for those evaluating early-stage real estate tokenization and digital banking infrastructure development.
Optimism (OP): Suitable for investors prioritizing established Ethereum Layer 2 infrastructure with documented protocol adoption, governance participation, and scalability solution implementation. Appropriate for those seeking positions in mature scaling solutions with institutional-grade security frameworks.
Risk Management and Asset Allocation
Conservative Investors:
- BXN: 0-5% portfolio allocation (early-stage asset concentration limits)
- OP: 2-8% portfolio allocation (established infrastructure exposure)
- Recommended hedge: Stablecoin positioning at 40-50% of speculative allocation
Aggressive Investors:
- BXN: 10-20% portfolio allocation (potential early-stage growth capture)
- OP: 5-15% portfolio allocation (Layer 2 infrastructure scaling bets)
- Recommended hedge tools: Diversified multi-protocol exposure, stablecoin reserves for rebalancing
VII. 2025-2030 Price Forecast Analysis
Short-term Outlook (2025)
BlackFort (BXN):
- Conservative Range: $0.000746–$0.0008882
- Optimistic Scenario: $0.001163542
Optimism (OP):
- Conservative Range: $0.26201–$0.2758
- Optimistic Scenario: $0.383362
Mid-term Forecast (2027–2028)
BlackFort (BXN):
- Projected Range: $0.001029–$0.001823182
- Potential Catalyst: Increasing adoption of digital banking services and real estate tokenization frameworks
Optimism (OP):
- Projected Range: $0.239160–$0.574755
- Potential Catalyst: Institutional capital inflows, enhanced Ethereum scaling efficiency
Long-term Outlook (2030)
BlackFort (BXN):
- Base Case: $0.001341879–$0.001789173
- Optimistic Scenario: $0.002558517
Optimism (OP):
- Base Case: $0.324888–$0.492255
- Optimistic Scenario: $0.625163218
Forecast Disclaimer: Price predictions are based on historical data analysis and market modeling. Cryptocurrency markets are subject to extreme volatility from regulatory, technological, and macroeconomic variables. Forecasts do not constitute investment recommendations.
VIII. Risk Comparison Analysis
Market Risk
BlackFort (BXN):
- Extreme volatility across trading ranges; significant exposure to early-stage platform execution risk
- Limited liquidity depth across only 3 exchange listings creates potential slippage risk for larger position adjustments
- Market capitalization of $13.92 million indicates vulnerability to concentrated capital flows
Optimism (OP):
- Established market infrastructure with 51 exchange listings and $535 million daily trading volume reduces liquidity concentration risk
- However, 30-day and 12-month performance decline (-23.09%, -85.39%) indicates heightened sensitivity to Layer 2 infrastructure market sentiment
- TVL concentration risk within Ethereum ecosystem dependency
Technology Risk
BlackFort (BXN):
- Proprietary POSA consensus mechanism requires ongoing validation of security assumptions and network stability
- Early-stage ecosystem development may encounter scaling limitations during periods of increased transaction demand
- Real estate tokenization frameworks require legal and regulatory implementation across multiple jurisdictions
Optimism (OP):
- Optimistic Rollup technology dependency on Ethereum mainnet security and data availability
- Potential for smart contract vulnerabilities within integrated 97-protocol ecosystem
- Bridge security and cross-layer communication protocols require continuous monitoring
Regulatory Risk
Global Regulatory Landscape:
- Both assets operate within evolving regulatory frameworks applicable to blockchain infrastructure and digital tokens
- BXN's digital banking services positioning (Blackfortpay) creates additional compliance requirements across Hong Kong, Taiwan, and United States regulatory standards
- OP's Layer 2 positioning as Ethereum scaling solution faces regulatory scrutiny regarding derivative asset classification and custody infrastructure
- Stablecoin regulation and securities law applicability remain uncertain across key markets through 2025-2026
IX. Potential Risk Mitigation Strategies
Portfolio Diversification
- Avoid concentrated positions; maintain balanced allocation across Layer 1 and Layer 2 blockchain infrastructure
- Integrate non-correlated assets to reduce systematic blockchain sector risk
- Establish stablecoin reserves (20-40% of allocation) for tactical rebalancing during volatility
Hedging Mechanisms
- Options positioning: Consider protective puts for positions exceeding 5% portfolio allocation
- Cross-exchange liquidity monitoring to execute exits during optimal market conditions
- Dollar-cost averaging (DCA) approach for new entries during extended downtrends
X. Conclusion: Which Is the Better Buy?
Investment Value Summary
BlackFort (BXN) Advantages:
- Early-stage positioning within emerging Layer 1 blockchain infrastructure category
- Diversified use case development spanning digital banking, real estate tokenization, and off-chain utilities
- Potential for significant appreciation if ecosystem adoption accelerates and liquidity infrastructure expands
Optimism (OP) Advantages:
- Established Layer 2 infrastructure with documented $500M+ TVL and 97 integrated protocols
- Mature governance framework (Optimism Foundation), institutional adoption, and 1.36M+ token holder base
- 51 exchange listings provide significantly greater liquidity accessibility and trading infrastructure
- Proven scaling solution solving Ethereum network congestion challenges
Investment Recommendations
Beginner Investors:
- OP preferred positioning due to established market infrastructure, greater liquidity, and institutional validation
- Recommended allocation: 3-5% of speculative allocation if risk tolerance supports cryptocurrency exposure
- Implement systematic entry approach via dollar-cost averaging over 3-6 month period
- Maintain 60-70% stablecoin reserves to manage volatility
Experienced Investors:
- Consider combined BXN/OP allocation reflecting differentiated risk-return profiles
- OP: 5-10% allocation for established Layer 2 infrastructure beta exposure
- BXN: 5-15% allocation contingent upon acceptance of early-stage platform execution risk
- Implement technical analysis-based rebalancing triggers at key support/resistance levels
- Monitor regulatory developments regarding digital banking services and tokenization frameworks
Institutional Investors:
- OP presents more suitable vehicle for institutional allocation given liquidity depth, governance framework, and regulatory clarity
- Recommended allocation: 0.5-2% of institutional crypto allocation to Layer 2 infrastructure category
- BXN requires deeper due diligence on digital banking compliance framework, legal entity structure, and real estate tokenization regulatory approvals before institutional positioning
- Establish custody solutions aligned with institutional-grade security standards
- Monitor TVL migration patterns and protocol competition within respective blockchain tiers
XI. Risk Disclosure
⚠️ Critical Risk Warning: Cryptocurrency markets demonstrate extreme volatility, with both BXN and OP experiencing 94%+ declines from 2024 peaks. This analysis does not constitute investment advice, financial recommendation, or endorsement of either asset. Past performance does not guarantee future results. All cryptocurrency positions carry substantial risk of total capital loss. Investors must conduct independent research and consult qualified financial advisors before making investment decisions. Regulatory environments remain uncertain and subject to rapid policy changes that could materially impact asset valuations.
Report Prepared: December 21, 2025
Data Sources: Public cryptocurrency market data, project documentation, blockchain explorers
Analyst Disclaimer: This report is provided for informational purposes only and reflects market conditions at the time of publication.
None
Frequently Asked Questions: BXN vs OP Investment Comparison
I. FAQ
Q1: What is the key difference between BXN and OP in terms of blockchain architecture?
A: BlackFort (BXN) operates as a Layer 1 EVM-compatible blockchain launched in 2024 with proprietary POSA (Proof of Stake Authority) consensus mechanism, while Optimism (OP) functions as a Layer 2 scaling solution for Ethereum utilizing Optimistic Rollup technology. BXN is an independent blockchain infrastructure, whereas OP serves as a scaling bridge built on top of Ethereum's mainnet security.
Q2: How have BXN and OP performed relative to their all-time highs as of December 21, 2025?
A: Both assets have experienced nearly identical percentage declines from their 2024 peaks. BXN declined 94.4% from its all-time high of $0.016 (April 5, 2024) to current price of $0.0008882, while OP declined 94.3% from its all-time high of $4.84 (March 6, 2024) to current price of $0.2758, reflecting broader market downturn conditions during the same period.
Q3: Which asset demonstrates greater market liquidity and accessibility?
A: Optimism (OP) significantly outperforms BXN in liquidity metrics. OP is listed on 51 major exchanges with documented 24-hour trading volume of $535,378.99 and 1,357,231 active token holders, compared to BXN's 3 exchange listings with only $52,602.55 daily volume. OP's market capitalization of $536.18 million also substantially exceeds BXN's $13.92 million, providing greater liquidity accessibility for both entry and exit transactions.
Q4: What are the primary use case differences between BXN and OP ecosystems?
A: BlackFort (BXN) focuses on diversified financial services including digital banking (Blackfortpay.com), real estate tokenization frameworks, and multi-currency wallet functionality (approximately 230,000 downloads). Optimism (OP) concentrates on Ethereum layer 2 scaling with $500M+ total value locked, supporting 97 integrated protocols including major DeFi platforms such as Synthetix, Uniswap, and Velodrome, prioritizing transaction efficiency rather than banking services.
Q5: Which asset carries higher risk for investors, and what are the primary risk factors?
A: BlackFort (BXN) carries higher absolute risk due to early-stage platform execution uncertainty, proprietary consensus mechanism validation requirements, limited liquidity infrastructure across only 3 exchanges, and relatively low market capitalization of $13.92 million vulnerable to concentrated capital flows. Optimism (OP) presents more moderate risk profile through established infrastructure but faces Layer 2-specific risks including Ethereum mainnet dependency, bridge security concerns, and sensitivity to broader Ethereum ecosystem performance.
Q6: What price trajectories are projected for BXN and OP through 2030?
A: BlackFort (BXN) projects base-case price range of $0.001341879–$0.001789173 by 2030 with optimistic scenario reaching $0.002558517, representing potential 101% appreciation from December 2025 levels. Optimism (OP) projects base-case range of $0.324888–$0.492255 by 2030 with optimistic scenario of $0.625163218, representing 78-127% potential appreciation. Both forecasts assume successful ecosystem development and institutional capital inflows but carry substantial uncertainty given cryptocurrency market volatility.
Q7: Which asset is more suitable for conservative versus aggressive investors?
A: Conservative investors should prioritize Optimism (OP) at 2-8% portfolio allocation given established market infrastructure, 51 exchange listings, and documented protocol adoption. BlackFort (BXN) suits aggressive investors only at 0-5% allocation with high risk tolerance. Aggressive investors may consider combined BXN (5-15%) and OP (5-10%) allocation reflecting differentiated risk-return profiles. All cryptocurrency positions should maintain 40-70% stablecoin reserves for volatility management and tactical rebalancing.
Q8: What regulatory considerations should investors evaluate before positioning in BXN or OP?
A: BlackFort (BXN) digital banking services through Blackfortpay face regulatory compliance requirements across Hong Kong, Taiwan, and United States standards, requiring deeper due diligence on entity structure and real estate tokenization approvals before institutional positioning. Optimism (OP) faces regulatory scrutiny regarding derivative asset classification and custody infrastructure requirements as Layer 2 infrastructure solution. Both assets operate within evolving regulatory frameworks applicable to blockchain infrastructure and digital tokens, with stablecoin regulation and securities law applicability remaining uncertain through 2025-2026.
Report Date: December 21, 2025
Disclaimer: This FAQ provides informational analysis only and does not constitute investment advice or financial recommendations. Cryptocurrency markets carry substantial volatility and total loss risk. Past performance does not guarantee future results. Investors must conduct independent research and consult qualified financial advisors before making investment decisions.
Share
How to Buy Cryptocurrency


Trending Cryptocurrencies


2025 NEAR Price Prediction: A Comprehensive Analysis of Factors Driving the Next Bull Run in the NEAR Protocol Ecosystem

2025 INJ Price Prediction: A Comprehensive Analysis of Market Trends and Growth Potential for Injective Protocol

2025 MNTPrice Prediction: Market Analysis and Potential Growth Factors for Mantle Network Token

2025 AURORA Price Prediction: Analyzing Future Trends and Market Potential for the Layer-2 Solution

2025 CELR Price Prediction: Analyzing Growth Potential and Market Factors for Celer Network Token
Is Celestia (TIA) a good investment?: Analyzing the potential and risks of this layer-1 blockchain project

How to Purchase Goldario (GLD) Tokens: A Step-by-Step Guide

Understanding Hedera Hashgraph: A Scalable Solution for Sustainable Enterprise Blockchain

Exploring the Role of Solana ETF in the Modern Crypto Landscape

What is RESOLV: A Comprehensive Guide to the Revolutionary Solvation Model in Computational Chemistry

Exploring Grok Token: The Future of XAI Crypto and AI Meme Coins