Share crypto content and earn up to 60% commissions through content mining.
placeholder
gatefun
BTC/ETH Forecast vs Gold and Silver, with Live Immediate Trading
A live trading stream continuously from 15:30 to 23:30, for 8 hours.
BTC0.55%
ETH2.46%
View Original
post-image
post-image
  • Reward
  • Comment
  • Repost
  • Share
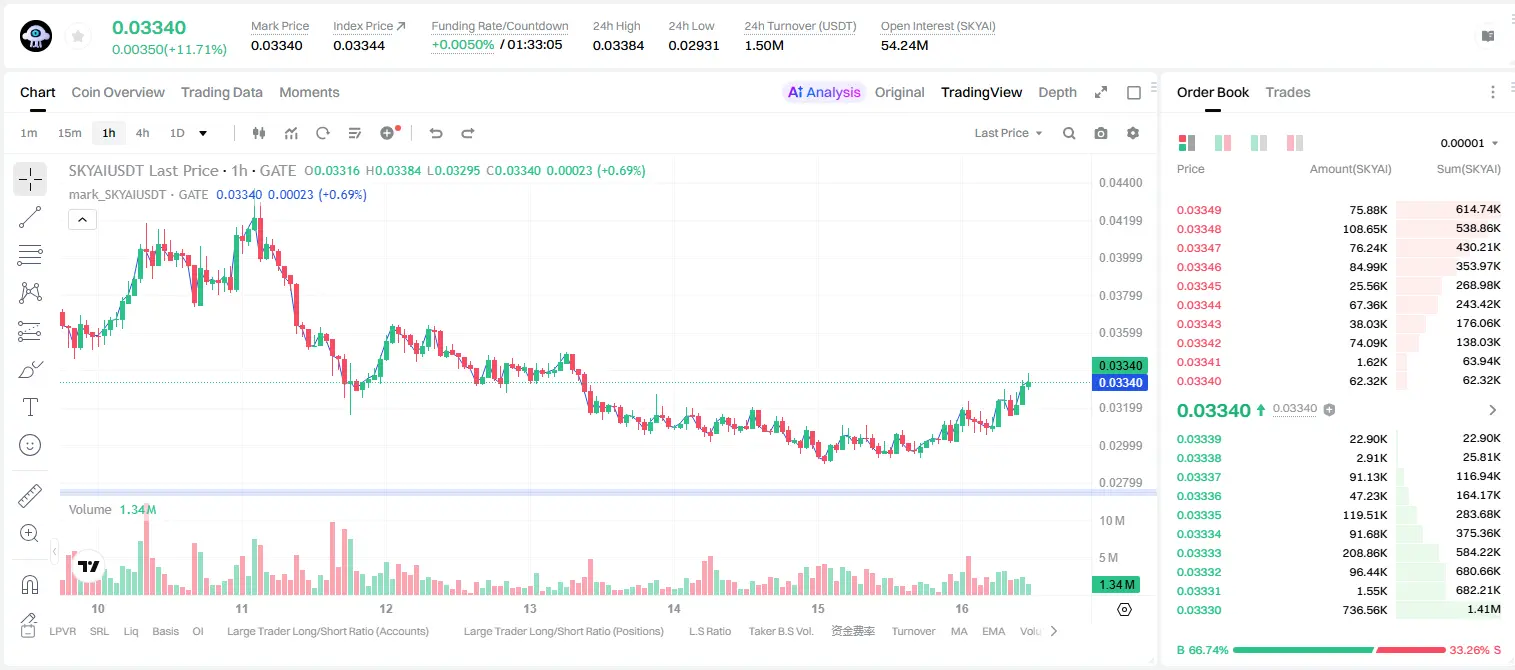
Guys, who gets it! When this one gets smashed down, the short positions directly start running on mental strength 📉🔥 A few days ago, the chart was still grinding above before bed. A lot of people thought it could still pump up. What I saw at the time was that the resistance above was extremely obvious—when it was pulled up, nobody was there to catch it. The long-fake/inducement vibe was already very heavy 👀
$CHZ From around 0.03576, I gave a short idea. During the day, the rebounds came a few times, but they never quite made it—also volume didn’t keep up. I told everyone not to get led by
CHZ-0.70%
BTC0.53%
ETH2.47%
View Original
post-image
  • Reward
  • Comment
  • Repost
  • Share
Most traders spend years searching for the "perfect indicator."
The truth?
Profitable trading rarely comes from a single indicator.
It comes from combining trend, momentum, volume, and risk management into one repeatable system.
This is the exact framework many professional traders use when analyzing $BTC and other crypto markets.
🔹️ Step 1: Trend Identification
Before entering any trade, determine the market direction.
I use:
▫️ MA7 = Short-term momentum
▫️ MA25 = Active trend
▫️ MA99 = Mid-term structure
▫️ MA200 = Macro direction
For a bullish market, I want to see:
🟢 MA7 above MA25
🟢 M
post-image
CryptoSat
One of the biggest mistakes traders make is chasing green candles.
By the time they enter, the move is already extended.
Professional traders often do the opposite.
They wait for the pullback.
And one of the simplest ways to identify pullbacks is by using Moving Averages.
🔹️ What Is an MA Pullback Entry?
An MA pullback entry occurs when price retraces back into a key Moving Average during an existing trend.
Instead of buying the breakout, traders wait for price to return to areas such as:
▫️ MA7 during strong momentum
▫️ MA25 during healthy trends
▫️ MA99 during deeper corrections
The goal is simple:
Join the trend at a better price.
📊 Trend Continuation First
MA pullbacks work best when the trend is already established.
For example:
If $BTC is making:
▪️ Higher highs
▪️ Higher lows
▪️ Trading above MA25 and MA99
Then a pullback into MA25 is often a sign of trend continuation rather than weakness.
The market is simply taking a pause before the next move.
⚠️ Don't Buy the Touch
A common beginner mistake is entering the moment price touches an MA.
Professional traders wait for confirmation.
Look for:
▫️ Bullish engulfing candles
▫️ Strong rejection wicks
▫️ Higher low formations
▫️ Increased buying volume
The Moving Average identifies the zone.
The candle confirms the entry.
🎯 Practical BTC Example
Imagine #BTC rallies from 100K to 105K.
Instead of chasing the breakout, you wait.
Price pulls back into MA25.
A bullish candle forms and buyers defend the level.
That confirmation provides a much cleaner entry than buying the top of the move.
🛡️ Risk Management Matters
Every setup can fail.
That's why experienced traders always define risk.
▪️ Place stop-loss below the invalidation level
▪️ Avoid oversized positions
▪️ Never assume support will hold
A good entry means nothing without proper risk management.
📌 The best traders don't chase momentum.
They wait for the market to come back to them.
That's the power of MA pullback entries.
repost-content-media
  • Reward
  • Comment
  • Repost
  • Share
#Show my portfolio profit
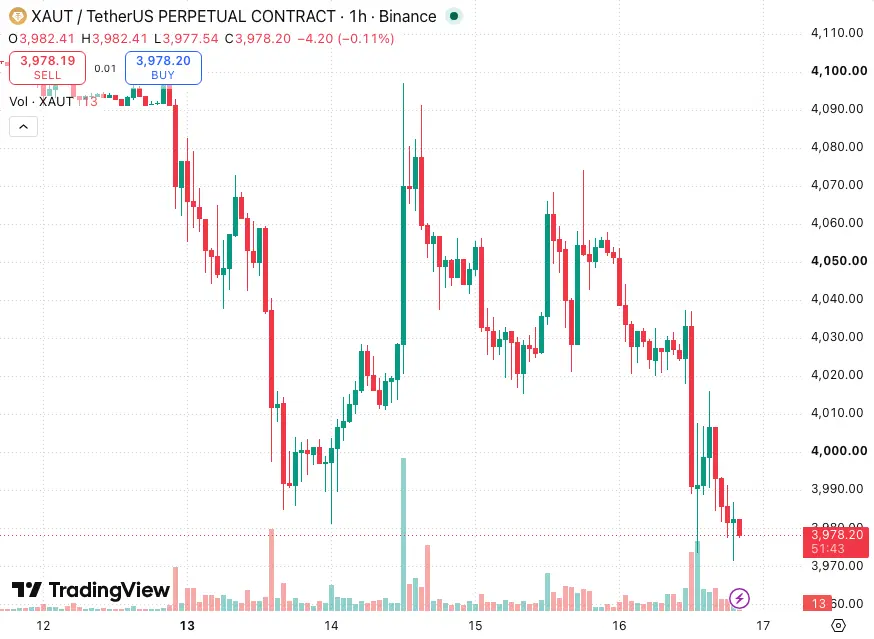
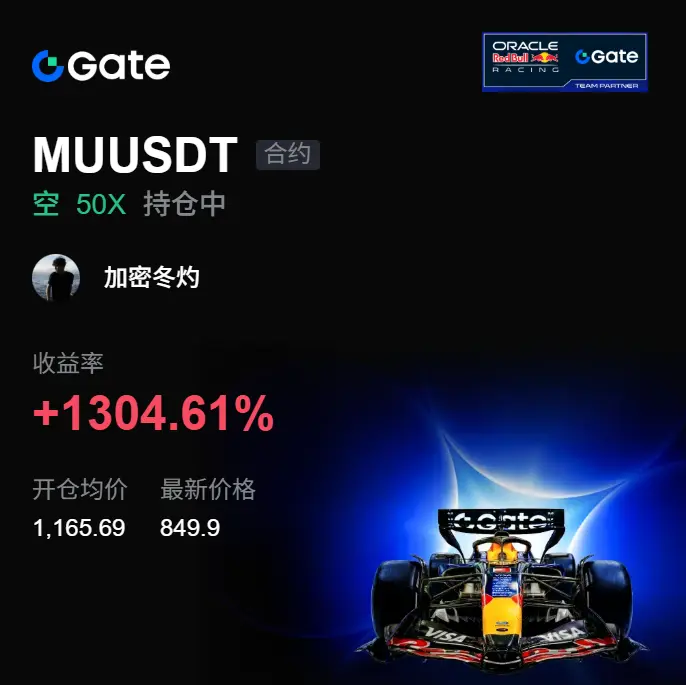
The first trade with the order number: it was already taken profit. Let me talk about my thinking. I said this last Friday as well—gold was relatively weak. In the end, it only did a surprise move. If I hadn’t failed to get up this morning at 6 a.m., this short position would have been opened at the top. Unfortunately, when I woke up, it had already dropped. I entered above 80, set a stop loss at 3 percentage points, and then took profit immediately.
XAU-0.73%
View Original
post-image
  • Reward
  • Comment
  • Repost
  • Share
$WLD Worldcoin is bearish. The moment it hits the top, it gets dumped; the higher-level trend is still downward, so it’s more straightforward to stay bearish at this level. First look at 0.35 below—whether it can hold is the key. A bounce into the resistance zone is a chance for the bears, but don’t chase or go all-in. Even if you’re right on direction, keep your stop-loss in place, because the market could turn and repeat at any time. Bears, assemble—focus on controlling risk.
WLD6.15%
View Original
post-image
  • Reward
  • Comment
  • Repost
  • Share
closed $btc long
BTC0.53%
post-image
  • Reward
  • Comment
  • Repost
  • Share
Morning Crypto Market Update
gate liveLIVE
358
live-coin
  • Reward
  • Comment
  • Repost
  • Share
#Show Off My Portfolio Profit
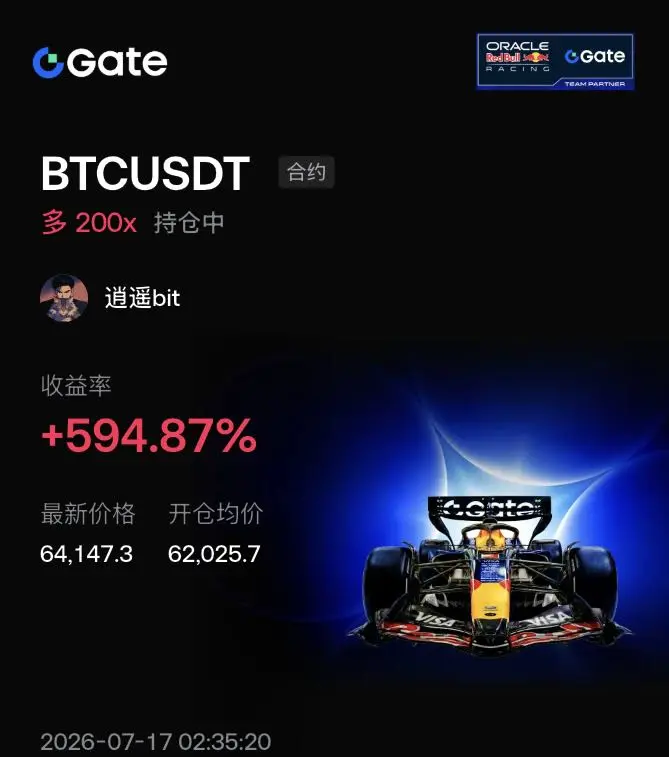
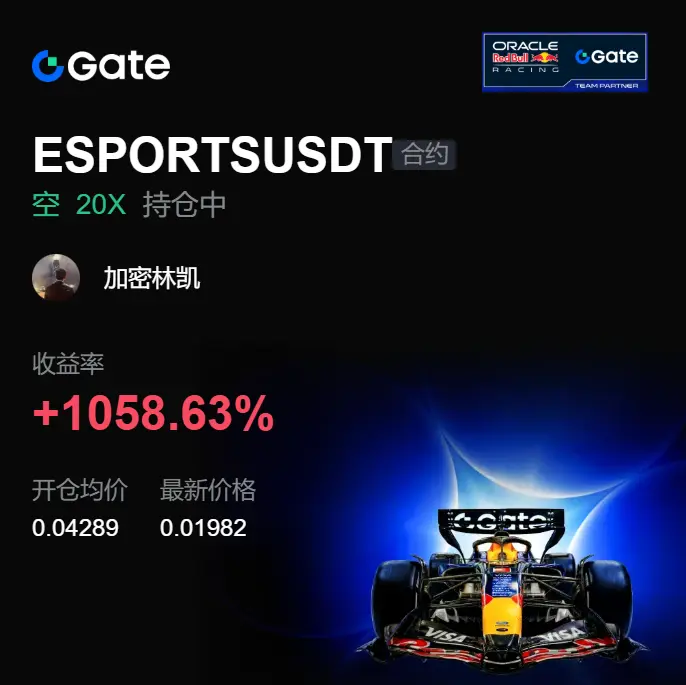
Second trade—already took profit. I wanted to eat a big one, but the take-profit was originally set at 71, and I was unlucky. When I opened, I didn’t go straight down, so I made a little and ran. For the third trade, I’m considering looking for a good opportunity,
View Original
post-image
  • Reward
  • Comment
  • Repost
  • Share
A technical rebound in the short-term market, possibly driven by news and events #LAB两日腰斩53%
LAB-25.58%
View Original
post-image
  • Reward
  • 2
  • Repost
  • Share
IAmYourUncle.:
Empty it out?
View More
GM $DOGE family ☕️☀️🏞
Good morning, CX 📈🤝
Wishing my dear friends a happy Monday!!! 🤍🧘🏼‍♂️🙌
Dogecoin to the moon! 🐶🚀
DOGE0.97%
View Original
post-image
  • Reward
  • Comment
  • Repost
  • Share
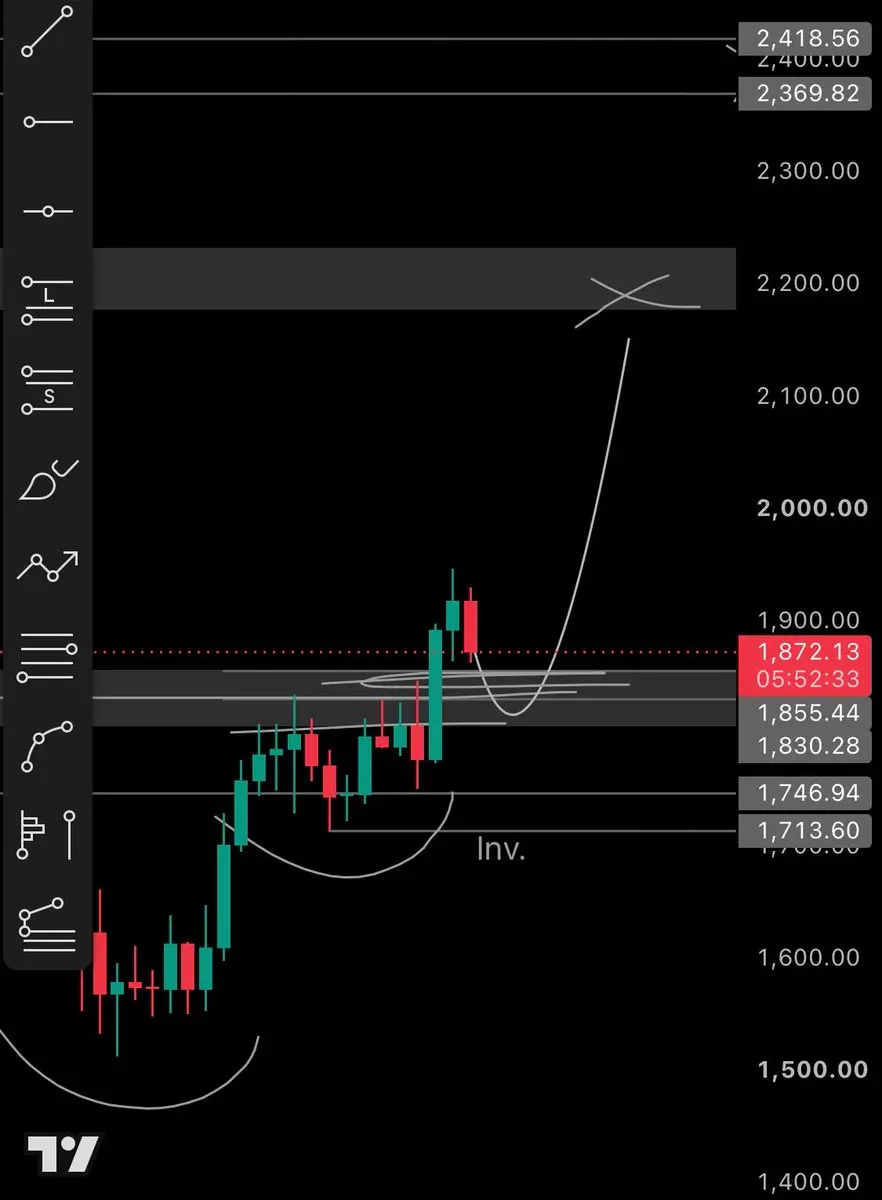
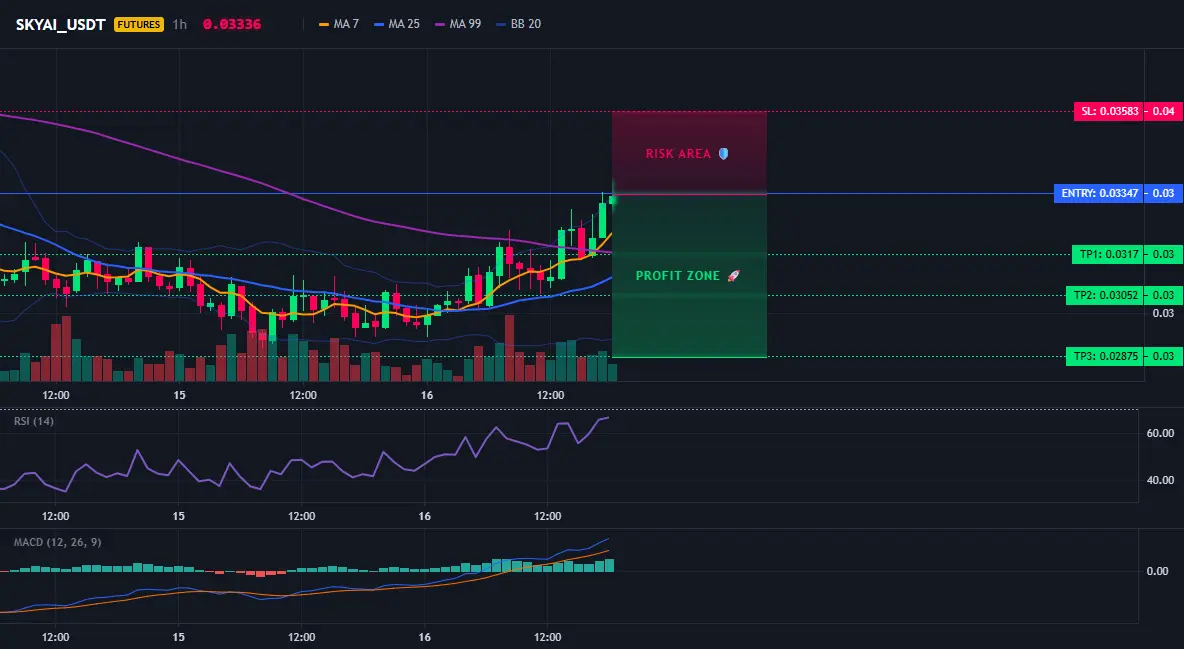
$ETH | 1h | Breakout Continuation
Bias: Long
Entry Zone: 1,828 to 1,836
Stop Loss: 1,798
Targets:
TP1: 1,855
TP2: 1,880
TP3: 1,900
Invalidation:
Close below 1,798
Why This Setup:
I’m looking for continuation after a strong reclaim and breakout above the 1,820 to 1,830 resistance area. Price structure is making higher highs and higher lows, and I want a clean hold above the breakout zone for the next leg higher.
ETH2.47%
post-image
  • Reward
  • Comment
  • Repost
  • Share
【$T Signal】Go long + negative funding rate squeezes shorts
$T 1H MACD bearish histogram expands, but the 4H Bollinger middle band support at 0.0042 remains effective. The funding rate is -0.199%, setting an extreme low, yet shorts piling up still can’t drive the price down. Buy-side depth at 1.09 shows dense order intake below. Around 0.00531, the placed order thickness is 4.26%, with clear signs of funding support.
🎯 Direction: long
⚡ Entry / limit orders: 0.00529606 - 0.00531200
🛑 Stop loss: 0.00504640
🚀 Target 1: 0.00571040
🚀 Target 2: 0.00590960
🛡️ Trade management:
- Execution strat
LAB-25.58%
BTC0.55%
ETH2.46%
SOL1.65%
View Original
post-image
  • Reward
  • Comment
  • Repost
  • Share
In the end, this position still gave the answer. When the $RESOLV segment before it ran horizontally, the community had plenty of bearish and bullish voices. Instead of picking a side, I just wanted to see whether anyone would pick up around 0.01885.
Once RESOLV stopped continuing to dump downward, I gradually picked up the long positions. After that, it moved from 0.01885 all the way to 0.02004. This rally made the “take profits” feeling stronger—about 80%—but the process was far from easy, and it got washed several times in the middle.
This time, I didn’t go all in at once. I still handled i
RESOLV4.98%
BTC0.53%
ETH2.47%
View Original
post-image
  • Reward
  • Comment
  • Repost
  • Share
$BTC | 1h | Pullback Rejection Short
Bias: Short
Entry Zone: 63820 to 64020
Stop Loss: 64520
Targets:
TP1: 63280
TP2: 62920
TP3: 62480
Invalidation:
Close above 64150
Why This Setup:
I’m shorting the rejection after BTC failed to hold above the 64k area and is rolling back into intraday support. The recent structure is still heavy, and if sellers keep control below 64.1k, I expect a continuation move toward the prior lows.
BTC0.53%
post-image
  • Reward
  • Comment
  • Repost
  • Share
2026.07.13 ETH/USDT complete intraday trading buy/sell nodes
⚠️Important risk warning: The following is only a technical range projection and does not constitute any investment advice; $ETH Contract high leverage causes extremely large price fluctuations and makes it very easy to suffer substantial losses. Do not participate with a heavy position.
Current price: 1792 USDT. The overall intraday trend is weak with a high-range choppy consolidation; the upside momentum is insufficient, and throughout the day it follows BTC to fluctuate in sync.
I. Shorting nodes (intraday priority; short on rebo
ETH2.47%
View Original
post-image
[The user has shared his/her trading data. Go to the App to view more.]
  • Reward
  • Comment
  • Repost
  • Share
$BNB $BNBUSDT | 1H | Short Setup
Bias: Short
Entry Zone: 573.40 to 574.20
Stop Loss: 579.80
Targets:
TP1: 569.50
TP2: 566.60
TP3: 562.20
Invalidation:
Close above 579.80
Why This Setup:
I see price rejecting after a sharp impulse into the 581-584 area, with sellers stepping back in on the lower highs. I want to fade the bounce while structure stays below the recent resistance and look for a move back into the 570 and 566 liquidity zones.
BNB1.09%
post-image
  • Reward
  • Comment
  • Repost
  • Share
bro "almost done thinking" 😭
post-image
  • Reward
  • Comment
  • Repost
  • Share
It looks like a routine pullback, but it actually breaks the kind of strong support that XLM saw earlier. Once the price loses a key level, the move tends to become straightforward.
My observation is that in the previous few bounces, no effective recovery formed; instead, the key level above became even clearer. The entry price was 0.20037, and the current price has since come to 0.1863, with downside room gradually opening up.
In this position, the +498.25% feedback is still in line with expectations. The more profit appears, the more you need to protect it—so emotion doesn’t throw off your r
XLM1.77%
BTC0.53%
ETH2.47%
View Original
post-image
  • Reward
  • Comment
  • Repost
  • Share
A few days ago, while watching the charts, I already noticed some changes. $WLD was capping off above and wouldn’t move up, and in the comments many people were still calling for everyone to keep “boarding.” I’ve been burned by this kind of situation before, so this time I didn’t join in the excitement and rush in.
What I cared more about was that WLD’s rebounds happened a few times but never showed real strength—like someone was deliberately hanging sentiment there. Later, when it neared 0.4331, I opened a long position, but I wasn’t much more confident either, because shorts are most afraid
WLD6.15%
BTC0.53%
ETH2.47%
View Original
post-image
  • Reward
  • Comment
  • Repost
  • Share
Load More

Join 40 M users in our growing community

⚡️ Join 40 M users in the crypto craze discussion
💬 Engage with your favorite top creators
👍 See what interests you
  • Pinned