Calculated from an asset's average price over a chosen number of chart periods, the SMA indicator gives equal weight to every price included in the calculation. Swing traders commonly use longer-period SMAs to identify the prevailing trend, filter short-term volatility, and evaluate whether a pullback remains consistent with the broader market structure.
TL;DR
-
The SMA indicator smooths price data by calculating a simple average over a fixed number of periods.
-
Swing traders often use the 50-period and 200-period SMA to assess medium-term and long-term trends.
-
Price above a rising SMA generally supports a bullish bias, while price below a falling SMA supports a bearish bias.
-
SMA crossovers can indicate changing trend conditions, but they often appear after the price move has started.
-
The SMA works best as a trend filter rather than a standalone entry or exit signal.
What Is the SMA Indicator?
The SMA indicator, or Simple Moving Average, is a trend-following indicator that plots the arithmetic average of an asset’s price over a selected number of periods. A 50-day SMA, for example, uses the closing prices from the latest 50 daily candles.
Each closing price receives equal weight. When a new candle closes, the newest price enters the calculation and the oldest price drops out. The resulting line moves across the chart and makes the broader direction easier to see.
The SMA is a lagging indicator because it reflects completed price data. It does not forecast where the market will move next. Instead, it organizes existing price action so traders can distinguish a sustained trend from temporary volatility. This reflects the broader role of trading indicators as tools for interpreting price and market conditions, rather than substitutes for a complete trading process.
How Is the SMA Indicator Calculated?
The SMA indicator is calculated by adding the selected closing prices and dividing the total by the number of periods:
SMA = Sum of closing prices ÷ Number of periods
Suppose an asset records five daily closing prices of $96, $100, $102, $104, and $108:
Five-day SMA = ($96 + $100 + $102 + $104 + $108) ÷ 5 = $102
If the next closing price is $110, the calculation removes $96 and adds $110. The five-day SMA then becomes $104.80.
This rolling calculation smooths short-term fluctuations. Longer SMA periods produce smoother lines but react more slowly when the trend changes.
Which SMA Periods Do Swing Traders Use?
Swing traders commonly use the 50-period and 200-period SMA to evaluate medium-term and long-term direction. The meaning of each setting depends on the chart timeframe.
A 50-day SMA represents the average closing price across approximately 50 daily sessions. It responds faster than a 200-day SMA and may identify intermediate trend changes earlier. The 200-day SMA provides a slower view of the broader market regime and filters more short-term noise.
| SMA period |
Typical swing-trading use |
Main limitation |
| 20-period SMA |
Tracks shorter swing direction |
More sensitive to market noise |
| 50-period SMA |
Assesses intermediate trends |
Can lag fast reversals |
| 100-period SMA |
Balances responsiveness and smoothing |
May duplicate nearby averages |
| 200-period SMA |
Filters long-term trend direction |
Reacts slowly to new conditions |
No SMA period is automatically best. A setting should match the trader’s timeframe, expected holding period, and the volatility of the asset.
How Do Swing Traders Interpret the SMA?
Swing traders interpret the SMA through three factors: price position, line direction, and market structure.
Price trading above a rising SMA suggests that buyers have maintained control over the selected period. Price below a falling SMA suggests persistent selling pressure. A flat SMA usually indicates that price lacks a clear directional trend.
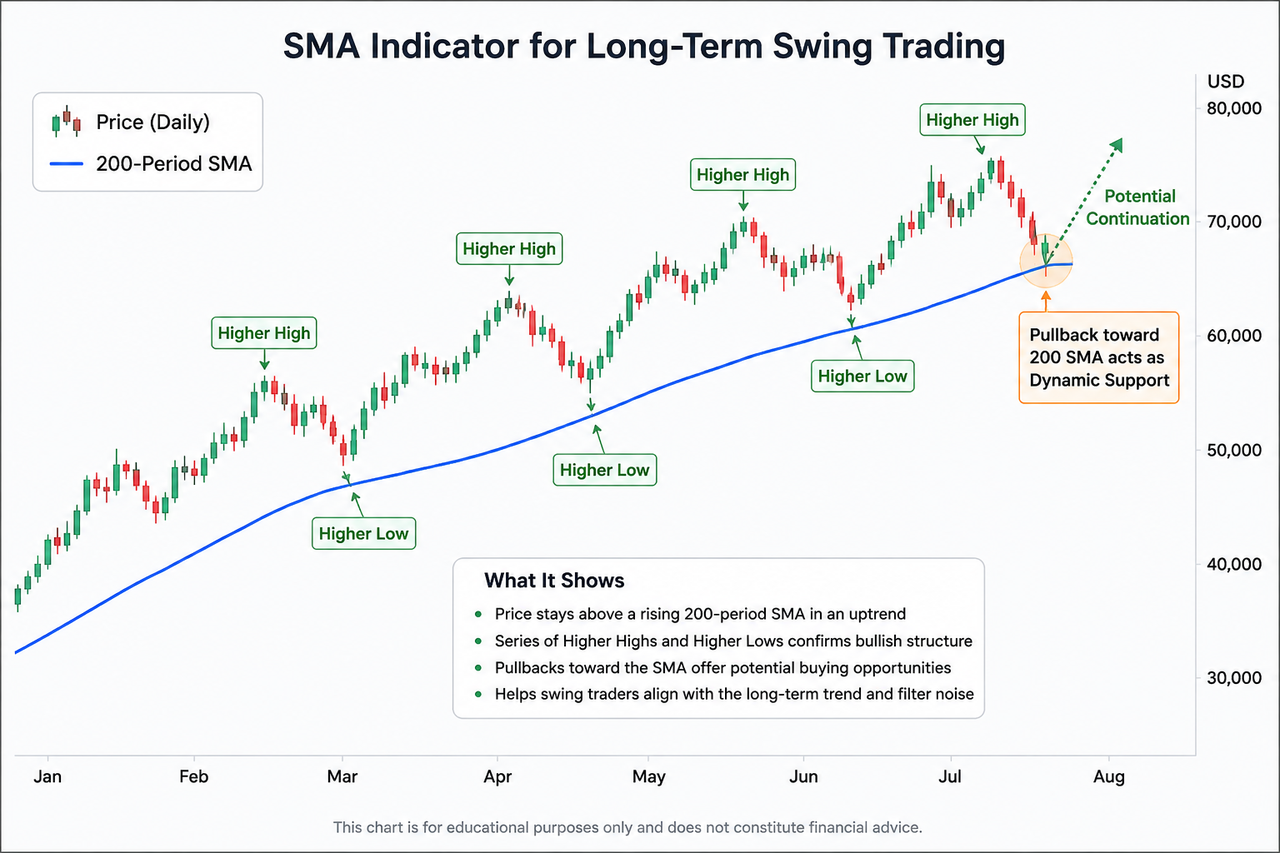
The signal becomes stronger when the SMA agrees with chart structure. For example, price above a rising 200-day SMA carries more meaning when the chart is also forming higher highs and higher lows. A brief move above a falling SMA does not confirm an uptrend by itself.
Moving averages can also act as areas of interest during pullbacks. In an established uptrend, price may return toward a rising SMA before continuing higher. The line should not be treated as an exact support level because market orders do not automatically cluster at one precise moving-average value.
What Do SMA Crossovers Mean?
An SMA crossover shows that the average price over one period has moved above or below the average from another period.
A bullish crossover occurs when a shorter SMA moves above a longer SMA. A bearish crossover occurs when the shorter SMA moves below the longer one. The 50-day SMA crossing above the 200-day SMA is commonly called a golden cross, while the opposite formation is known as a death cross.
Crossovers can confirm that trend conditions have changed, but they are delayed by design. In sideways markets, the averages may cross repeatedly and create conflicting signals. Moving averages are therefore most useful when combined with trend strength, price structure, and confirmation tools. A Supertrend indicator, for example, can provide another view of trend direction, although combining indicators does not eliminate false signals.
SMA vs EMA: What Is the Difference?
The SMA gives equal weight to every price, while the EMA places greater weight on recent prices.
| Feature |
SMA |
EMA |
| Weighting |
Equal across the period |
Greater weight on recent prices |
| Responsiveness |
Slower |
Faster |
| Main use |
Stable trend filtering |
Faster momentum tracking |
| Common weakness |
Delayed signals |
Greater sensitivity to noise |
The SMA may suit swing traders focused on broad, long-term structure. The EMA may be more useful when recent price changes need greater influence. Traders looking for an average designed to reduce lag further may also encounter the Hull Moving Average, which uses a different calculation to combine smoothing with faster responses.
Limitations of the SMA Indicator
The SMA indicator cannot predict whether a trend will continue, reverse, or accelerate. It only summarizes historical prices.
Its main weaknesses include delayed signals, repeated false crossovers during sideways conditions, and limited usefulness during sudden volatility. Crypto markets can move sharply before a long-term SMA changes direction.
A more structured interpretation checks whether:
-
The SMA has a clear upward or downward slope.
-
Price structure agrees with the SMA direction.
-
A crossover receives follow-through rather than reversing immediately.
-
The planned trade has a defined invalidation level.
-
Potential loss and reward remain acceptable.
The last point matters because a technically valid trend does not guarantee a favorable trade. A predetermined risk-reward ratio can help separate signal interpretation from position-risk decisions.
Conclusion
The SMA indicator smooths historical prices to reveal the broader market direction. Longer settings such as the 50-period and 200-period SMA can help swing traders filter short-term noise, assess pullbacks, and maintain a consistent long-term trend bias.
Its value comes from context rather than prediction. The SMA becomes more informative when its slope, price position, and the surrounding market structure point in the same direction. Because it reacts slowly and can generate false signals in sideways markets, it should support a structured analysis process rather than replace one.
This content is provided for educational purposes only and does not constitute financial or investment advice. Digital asset markets are volatile, and no technical indicator can guarantee future results.
FAQ
What does SMA mean in trading?
SMA means Simple Moving Average. It represents the arithmetic average of an asset’s price over a selected number of chart periods.
Is the SMA indicator useful for swing trading?
Yes, the SMA indicator can help swing traders identify the broader trend and filter short-term volatility. It is more reliable when used with price structure, confirmation signals, and risk controls.
Which SMA is best for long-term trends?
The 200-period SMA is commonly used for long-term trend analysis, while the 50-period SMA provides a more responsive view of intermediate conditions. The appropriate setting depends on the chart timeframe and trading horizon.
Is the SMA a leading or lagging indicator?
The SMA is a lagging indicator because it is calculated from historical prices. Its signals normally appear after a price movement has already begun.
Can the SMA identify support and resistance?
The SMA can highlight a dynamic area where price may react, but it does not create guaranteed support or resistance. Traders should confirm the area using price structure and other market evidence.
Can traders use the SMA indicator alone?
The SMA indicator should not be used alone. It does not measure every factor affecting price and can produce unreliable signals during sideways or highly volatile markets.







