Casawi
Trade
Trading Type
Spot
Trade crypto freely
Pre-Market
Trade new tokens before they are officially listed
Margin
Magnify your profit with leverage
Convert & Block Trading
0 Fees
Trade any size with no fees and no slippage
Alpha
Points
Get promising tokens in streamlined on-chain trading
Leveraged Tokens
Get exposure to leveraged positions simply
Futures
Futures
Hundreds of contracts settled in USDT or BTC
Options
HOT
Trade European-style vanilla options
Unified Account
Maximize your capital efficiency
Demo Trading
Futures Kickoff
Get prepared for your futures trading
Futures Events
Participate in events to win generous rewards
Demo Trading
Use virtual funds to experience risk-free trading
Earn
Launch
CandyDrop
Collect candies to earn airdrops
Launchpool
Quick staking, earn potential new tokens
HODLer Airdrop
Hold GT and get massive airdrops for free
Launchpad
Be early to the next big token project
Alpha Points
NEW
Trade on-chain assets and enjoy airdrop rewards!
Futures Points
NEW
Earn futures points and claim airdrop rewards
Investment
Simple Earn
Earn interests with idle tokens
Auto-Invest
Auto-invest on a regular basis
Dual Investment
Buy low and sell high to take profits from price fluctuations
Soft Staking
Earn rewards with flexible staking
Crypto Loan
0 Fees
Pledge one crypto to borrow another
Lending Center
One-stop lending hub
VIP Wealth Hub
Customized wealth management empowers your assets growth
Private Wealth Management
Customized asset management to grow your digital assets
Quant Fund
Top asset management team helps you profit without hassle
Staking
Stake cryptos to earn in PoS products
BTC Staking
HOT
Stake BTC and earn 10% APR
GUSD Minting
Use USDT/USDC to mint GUSD for treasury-level yields
More
Promotions
Activity Center
Join activities and win big cash prizes and exclusive merch
Referral
20 USDT
Earn 40% commission or up to 500 USDT rewards
Announcements
Announcements of new listings, activities, upgrades, etc
Gate Blog
Crypto industry articles
VIP Services
Huge fee discounts
Proof of Reserves
Gate promises 100% proof of reserves
Casawi
No content yet
- Reward
- like
- Comment
- Repost
- Share

#CAKE5S ✅✅✅
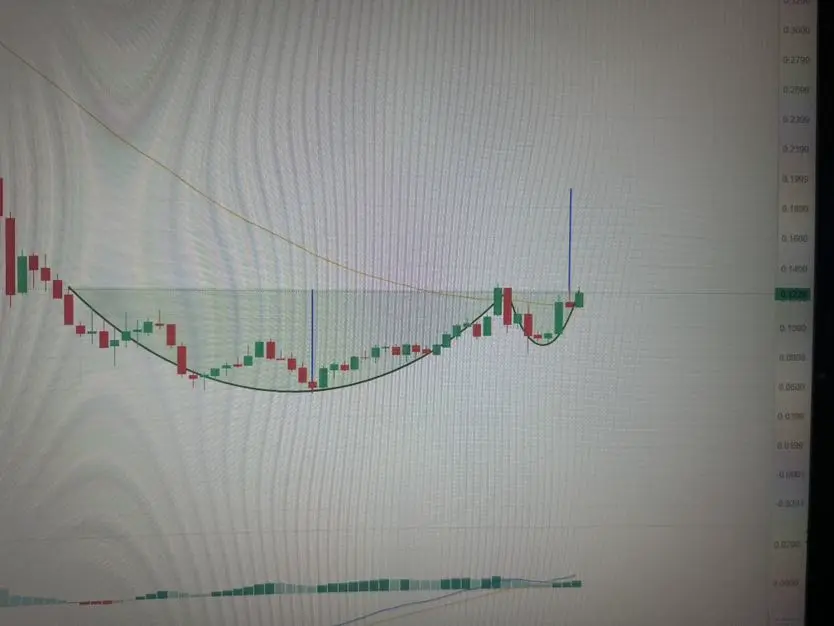
The chart shows a cup and handle formation. After a long downtrend, the price has formed a rounded bottom (the cup) followed by a short pullback (the handle). Currently, the price is trading near the neckline area (around 0.13).
In classical technical analysis, this pattern suggests that:
👉 If the neckline is broken to the upside, the probability of a continued upward move increases.
👉 The target is usually measured by the depth of the cup (indicated by the blue line).
Summary:
• Pattern type: Cup and Handle (bullish pattern)
• Key resistance: Around 0.13
• Potential target: A
CAKE5S6,25%
- Reward
- 4
- 4
- Repost
- Share
GateUser-b2754dc6 :
:
What does this 0.0 something mean after a 1d drop?View More

#PI #BTC #ETH
The scenario we’ve been waiting for on Pi Coin is finally playing out! The setup was spot on, direction is clear. Long positions we entered this morning are deep in the green, resistances are breaking one by one. After the accumulation phase, we can say the upward move has officially started. We’re hitting our targets one by one — next stop, higher levels. Patience is paying off, the Pi story is just getting started!
The scenario we’ve been waiting for on Pi Coin is finally playing out! The setup was spot on, direction is clear. Long positions we entered this morning are deep in the green, resistances are breaking one by one. After the accumulation phase, we can say the upward move has officially started. We’re hitting our targets one by one — next stop, higher levels. Patience is paying off, the Pi story is just getting started!
- Reward
- 7
- 3
- Repost
- Share
GateUser-567ec45e:
Steadfast HODL💎View More
#CAPS #BTC #Pi #ETH
🚨✨🚨✨🚨✨
With our CAPS Coin purchase, we’ve officially ignited the start of the bull run! Backed by Bitcoin’s strong support and positive market momentum, the long-awaited altcoin rally has finally begun. We are executing our strategy with discipline and carefully selecting projects for our portfolio. Opportunities are abundant in the markets, but risk management is more important than ever. Wishing everyone a highly profitable season ahead!
✨🚨✨🚨✨🚨✨🚨✨🚨

- Reward
- 3
- Comment
- Repost
- Share
#ENA3L #ENA #ETH #BTC #Pi
Our ENA3L analysis played out successfully, with the buying zone holding strong and the expected upward move beginning! As support levels remained intact, momentum picked up, and a significant part of our projected 3x - 4x move has already materialized.
However, the price is still in a favorable buying zone, presenting a valuable opportunity before a major breakout. Entering at these levels could offer substantial short-term gains as momentum accelerates. Effective risk management and strategic entry and exit points are crucial to maximizing this opportunity. We

- Reward
- 5
- Comment
- Repost
- Share
#ENA #ENA3L #BTC #ETH #Pi
ENA3L is presenting a scalp trade opportunity! The price has reached the buying zone, and a potential 3x - 4x move could be on the table. For short-term trades, risk management is key. Once momentum kicks in, having a quick exit strategy will be crucial. If the support level holds, we could see a strong rebound!
ENA3L is presenting a scalp trade opportunity! The price has reached the buying zone, and a potential 3x - 4x move could be on the table. For short-term trades, risk management is key. Once momentum kicks in, having a quick exit strategy will be crucial. If the support level holds, we could see a strong rebound!

- Reward
- 2
- 2
- Repost
- Share
Solo888:
🤣🤣🤣🤣🤣🤣🍄🍄🍄🍄🍄🍄🍄🍄🍄🍄🍄🍄🍄View More
#PI #Caps #Bad
After taking our profits from CAPS and PI, next up is BAD! We’re seeing a strong accumulation phase at the bottom. Increasing volume and technical indicators suggest potential momentum ahead.
The strategy is clear: Buy the dip, be patient, set your targets. Avoid panic selling, manage the process wisely, and seize the opportunity!

- Reward
- 4
- 1
- Repost
- Share
GateUser-61c00236:
I wait to see bad pull the feats of shibs in 2021#CAPS #Pi
The market is showing remarkable volatility! We believe the next strong breakout will be in $CAPS. Based on technical analysis and market data, we will leverage our bot trading strategy to identify optimal entry points. With increasing volume and momentum indicators aligning, we are moving towards our targets with confidence. We are closely monitoring the process within the framework of risk management. Once the anticipated move begins, a strong rally could be inevitable!
The market is showing remarkable volatility! We believe the next strong breakout will be in $CAPS. Based on technical analysis and market data, we will leverage our bot trading strategy to identify optimal entry points. With increasing volume and momentum indicators aligning, we are moving towards our targets with confidence. We are closely monitoring the process within the framework of risk management. Once the anticipated move begins, a strong rally could be inevitable!

- Reward
- 3
- Comment
- Repost
- Share
#PI #MEDUSA
#PI #MEDUSA
Pi Network Preparing for an Uptrend, Medusa at the Bottom!
One of the most notable projects in the crypto market, Pi Network, has started to show signs of the long-anticipated uptrend. With the full transition to mainnet and potential exchange listings, the current low-volume movements are expected to be replaced by a strong upward trend. Technical indicators and market dynamics suggest that Pi is currently in an accumulation phase.
On the other hand, Medusa is currently trading at its bottom levels. Price movements indicate that these levels are acting as a long-te
PI-0,43%
- Reward
- 12
- 4
- Repost
- Share
GateUser-b9bf5629:
Hold On for Dear Life💎View More
#PI
If there’s one thing that stands tall in the market, it’s Pi Network Coin!
In the crypto world, trust, stability, and community support are the most valuable assets. Pi Network embodies these values with its user-centric approach and continuously evolving ecosystem. With a strong community and innovative technology, Pi remains resilient against market fluctuations.
Discover Pi Network and secure your place in the future of the digital economy!

- Reward
- 5
- Comment
- Repost
- Share
#AIX9 #aiswap #deepseek
Our next goal is once again focused on AI-powered solutions. As you know, many trading platforms now use AI-based bots for buying and selling transactions. These bots have significantly increased profitability, making bot usage a logical strategy. In this regard, we believe that Aix9, Aiswap, and Deepseek could be among the leading coins of the future. Don’t forget to check out bot trades, especially for these coins!
Our next goal is once again focused on AI-powered solutions. As you know, many trading platforms now use AI-based bots for buying and selling transactions. These bots have significantly increased profitability, making bot usage a logical strategy. In this regard, we believe that Aix9, Aiswap, and Deepseek could be among the leading coins of the future. Don’t forget to check out bot trades, especially for these coins!

- Reward
- 3
- Comment
- Repost
- Share
#DEEPSEEK #BAD
Automated Profit Opportunity: Turn the Market to Your Advantage with Bot Trading!
You don’t need to stay in front of the screen all the time to make a profit in the crypto market! Powered by Ultra AI, this powerful trading bot has achieved an impressive +743.85 USDT return and has been copied by 11 investors!
✅ Smart algorithms instantly capture market opportunities.
✅ Low-risk, optimized strategy for consistent profits.
✅ Earn alongside successful investors like Casawi!
Don’t miss out—join now and start growing your investments!
Click the button below to start using the bot!
- Reward
- 3
- Comment
- Repost
- Share


#DEEPSEEK
DeepSeek Coin stands out as a cryptocurrency with a promising future. With its innovative technology and robust infrastructure, it has the potential to become a long-term value-preserving investment tool. Its limited supply is a notable factor supporting the coin's value. Blockchain-based solutions help it gain user trust. DeepSeek Coin has the potential to become a significant asset for both individual and institutional investors in the future. With these features, it is poised to be a standout project in the crypto world.
DeepSeek Coin stands out as a cryptocurrency with a promising future. With its innovative technology and robust infrastructure, it has the potential to become a long-term value-preserving investment tool. Its limited supply is a notable factor supporting the coin's value. Blockchain-based solutions help it gain user trust. DeepSeek Coin has the potential to become a significant asset for both individual and institutional investors in the future. With these features, it is poised to be a standout project in the crypto world.

- Reward
- like
- 2
- Repost
- Share
Mark999:
Just push it through 💪View More