Abstract
-
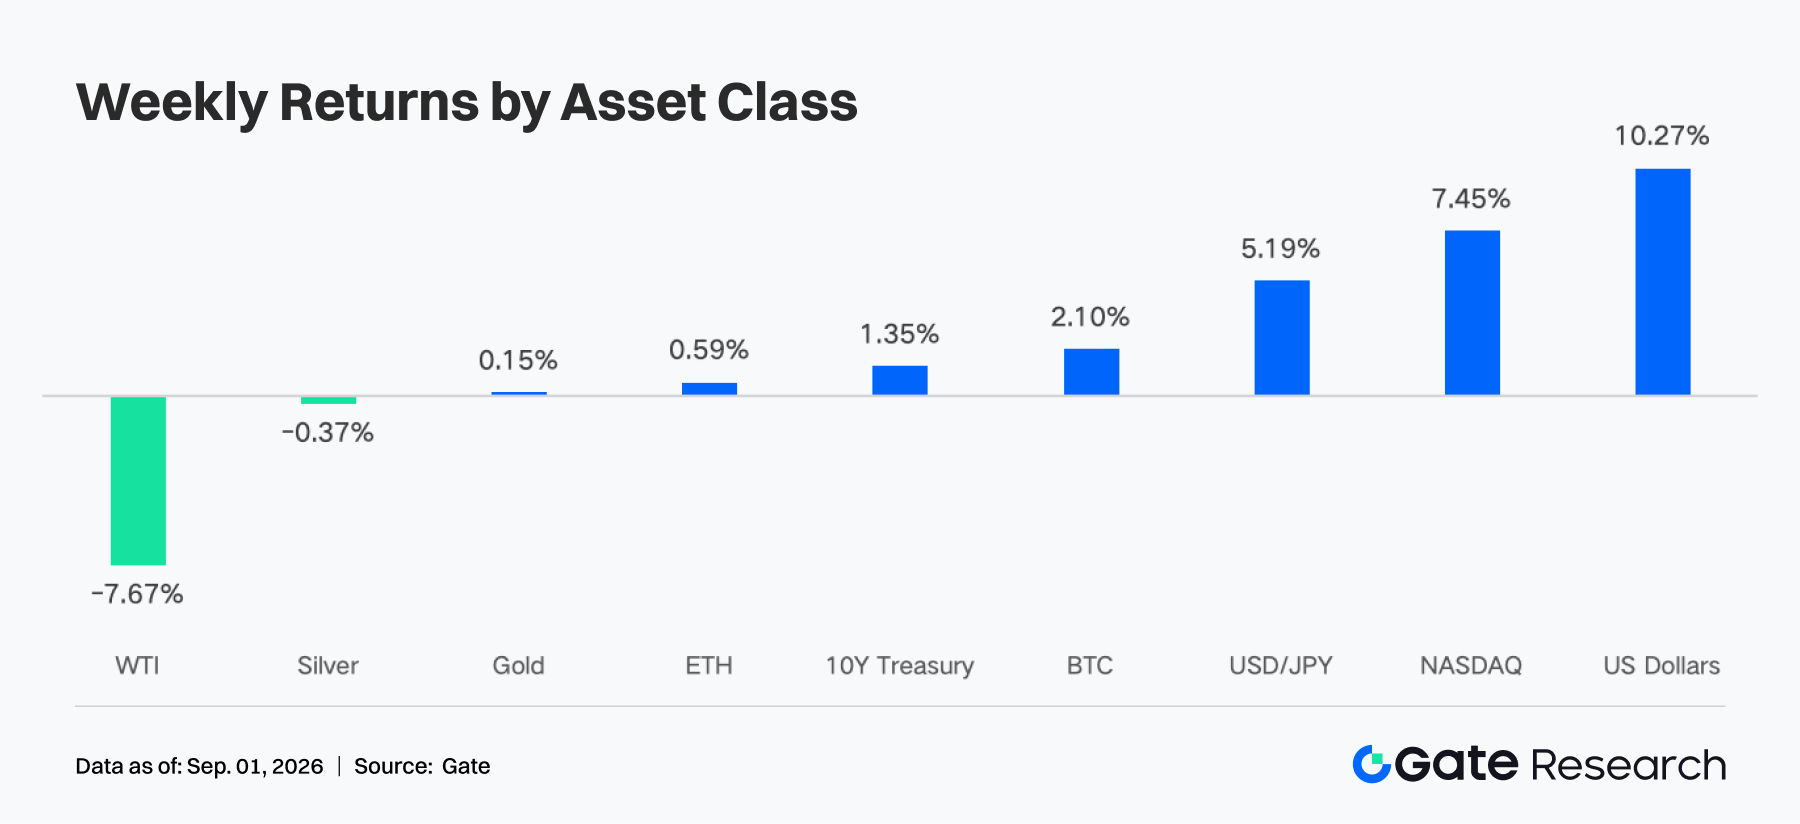
Hawkish expectations are set to regain dominance in macro pricing, with PCE inflation remaining elevated. Warsh's hawkish remarks have lifted expectations for a September rate hike, pushing short-end U.S. Treasury yields and the U.S. dollar higher. The crypto market has entered a phase of structural rotation at elevated levels, with BTC briefly breaking above 81,000 USDT; BTC and ETH posted weekly gains of 2.10% and 0.59% respectively.
-
ETF capital has shifted from chasing rallies to selective allocation. The weekly net inflow of BTC ETFs fell to around $925 million, down 51.79% from the previous week, while the net inflow of ETH ETFs rose to about $816 million, indicating that institutional enthusiasm for chasing BTC rallies has cooled, and institutional demand for ETH has strengthene
-
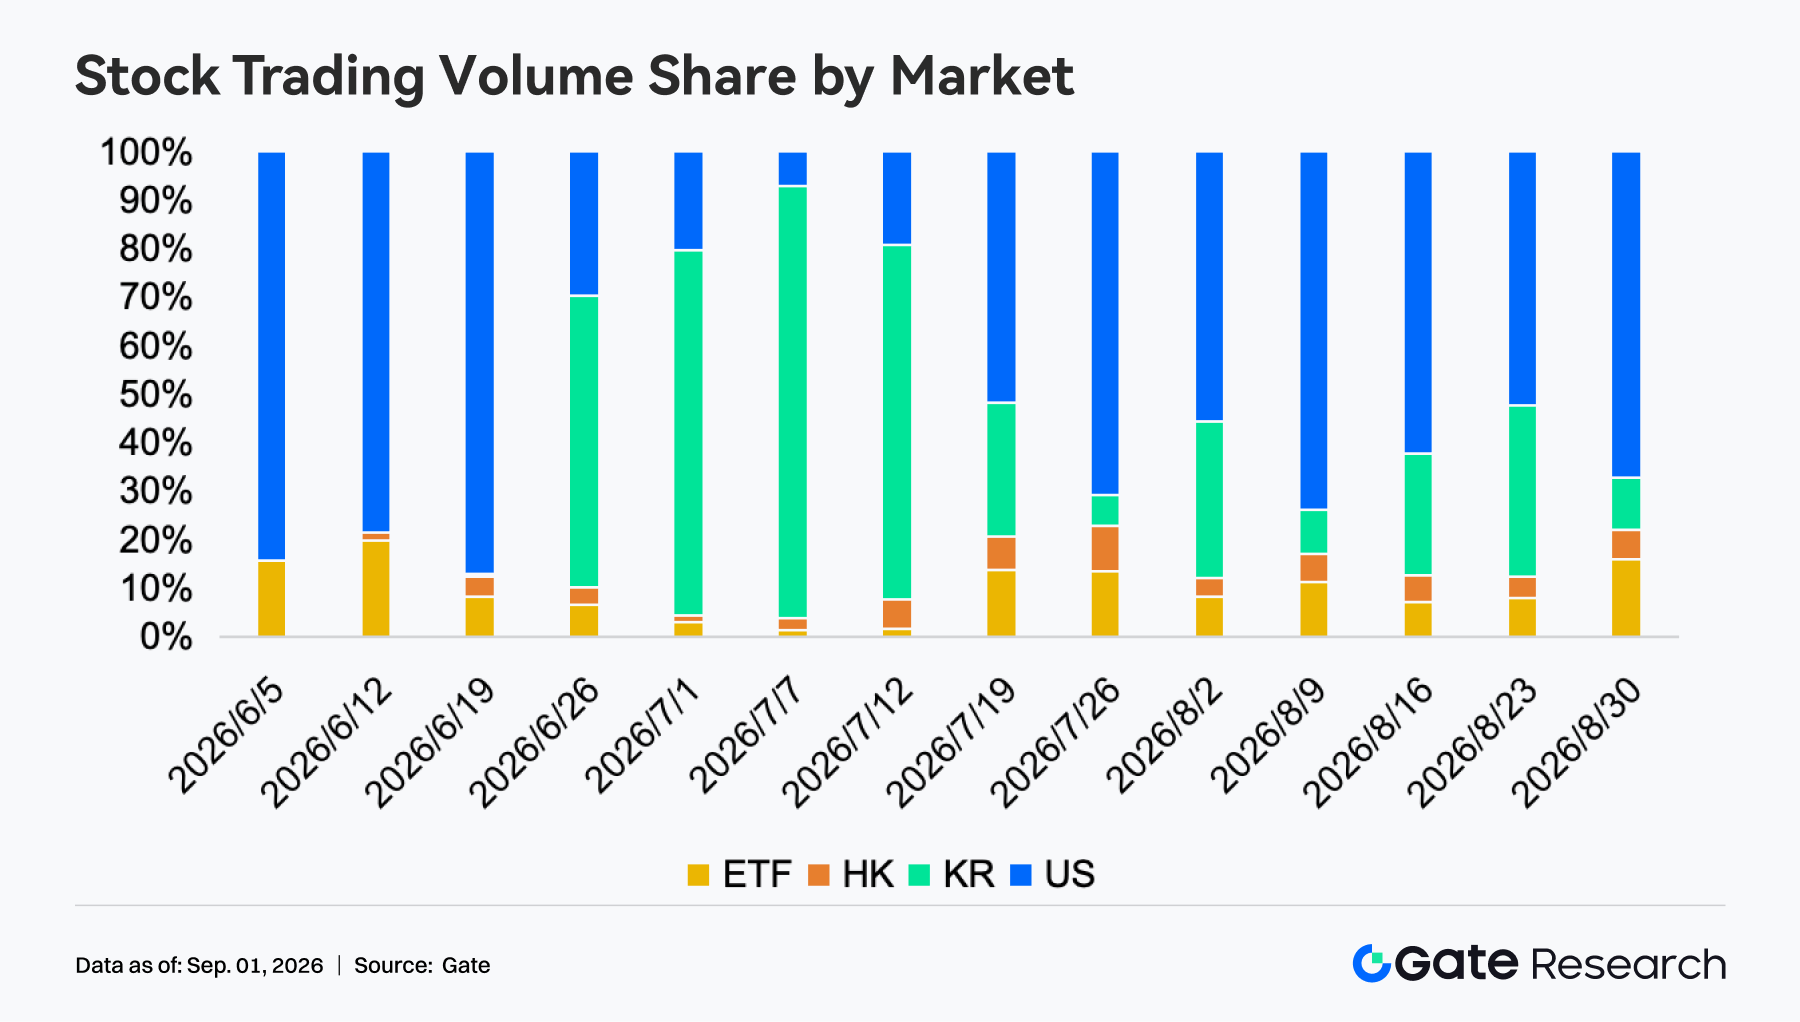
TradFi activity has rebounded and shifted back toward US stocks, with Gate TradFi's weekly trading volume rising to around $123 billion, an increase of approximately 17%. Both CFD and Perp trading expanded in tandem. The share of US stocks in equity trading rebounded to about 67%, ETFs rose to 16%, while Korean stocks fell from 36% to roughly 11%.
-
On-chain transactions shifted toward meme and high-frequency retail scenarios. The large-value transaction pulses on Uniswap subsided, while the number of trades continued to grow. Activity on PumpSwap, Pump.fun and meme frontends increased, with Pump's revenue rising to approximately $16.28 million, making retail trading the main revenue driver this week.
-
Capital is more inclined to stable yield and SOL staking assets. The supply of stablecoins increased by about 1.7 billion USD, with the increment spreading to institutional settlement and yield-generating assets such as RLUSD, USD1, and BUIDL. SOL staking assets significantly outperformed ETH, and ETF inflows, staking yields, and expectations of supply contraction collectively strengthened demand.
-
The leveraged bullish chasing for BTC has cooled down noticeably. BTC open interest dropped from around $13.4 billion in the middle of the week to approximately $12.4 billion, while funding rates remain moderately positive, indicating that the bullish structure has not yet reversed, but the momentum of new leveraged long positions has weakened.
-
Short-term protection has increased, but volatility risk premium has decreased. Long-term positions in options are still bullish, but short-term put transactions have increased significantly; 25D Skew has recovered to about -3%, and DVOL has dropped from around 43 to about 37, indicating that while the market is increasing short-term protection, the overall pricing of violent fluctuations is actually stabilizing.
1. Market Focus Analysis
Last week (August 24 to August 30,2026), the market repriced around US inflation, the Jackson Hole meeting, and the situation in the Middle East. US July PCE rose 3.7% year-on-year, and core PCE rose 3.3% year-on-year, both unchanged from the previous readings;With inflation consistently running above the 2% target, Federal Reserve Chair Kevin Warsh stated on August 28 that policymakers still had "work to do" if core inflation did not fall back at a sufficient pace. Market expectations for a September interest rate hike rose noticeably, pushing the 2-year U.S. Treasury yield to around 4.36% that day, strengthening the U.S. dollar and putting downward pressure on gold prices.Despite a pullback on Friday, NVIDIA's earnings results provided support to the AI industry chain, leading to a moderate weekly gain for U.S. stocks: the S&P 500, Dow Jones Industrial Average, and Nasdaq rose by 0.5%, 0.5%, and 0.8% respectively, while the Russell 2000 fell 1.5%, reflecting continued investor preference for large-cap tech stocks. In the commodities market, Iran and Oman sent easing signals regarding traffic arrangements in the Strait of Hormuz, with Brent crude falling roughly 5% over the week to close at around $89.7 on Friday, temporarily alleviating imported inflationary pressures.The crypto market continued to see improved liquidity and short covering in the first half of the week, with BTC briefly breaking above 81,000 USDT;The latter half of the week was weighed down by hawkish interest rate expectations and profit-taking, yet BTC and ETH still posted weekly gains of 2.10% and 0.59% respectively.
1. Liquidity Analysis
2.1 Institutions' attitude toward BTC has shifted from aggressive allocation to selective positioning
Last week, US spot Bitcoin ETFs recorded a total net inflow of approximately $925 million, down 51.79% from the previous week's $1.918 billion. While capital remained in net inflow, the momentum of chasing the rally has significantly weakened. IBIT led the pack with a net inflow of around $938 million, accounting for nearly all of the incremental flows; ARKB saw a net outflow of about $85 million, making it the weakest-performing product. On Friday, the entire market swung to a single-day net outflow of roughly $202 million, indicating that after prices consolidated around the $77,000 level, some institutional investors began taking profits.Based on the AUM benchmark disclosed on August 21, combined with changes in coin prices and net subscription estimates, the BTC ETF AUM rose from approximately $96.070 billion to around $96.940 billion, representing a week-over-week increase of about 0.91%.
The total net inflow of ETH spot ETFs reached approximately 816 million USD, representing a 17.77% increase from the previous week's 693 million USD. ETHA recorded a net inflow of around 567 million USD, continuing to dominate the market; none of the products saw weekly net outflows, QETH had no capital flow changes, and EZET only had an inflow of about 1 million USD, the smallest among all products with non-zero flows.Despite a 1.88% weekly decline in ETH's price, continuous subscription inflows pushed the estimated AUM up from approximately $14.30 billion to around $14.85 billion, representing a week-on-week increase of roughly 3.83%. Overall, institutional sentiment toward BTC has shifted from aggressive accumulation to selective positioning, while institutional demand for ETH has strengthened notably. Market sentiment remains generally positive, yet Friday's outflows from BTC and the weakening of ETH prices indicate that risk appetite has shifted from indiscriminate chasing to concentrated product allocation and buying on dips.
2.2 TradFi Liquidity
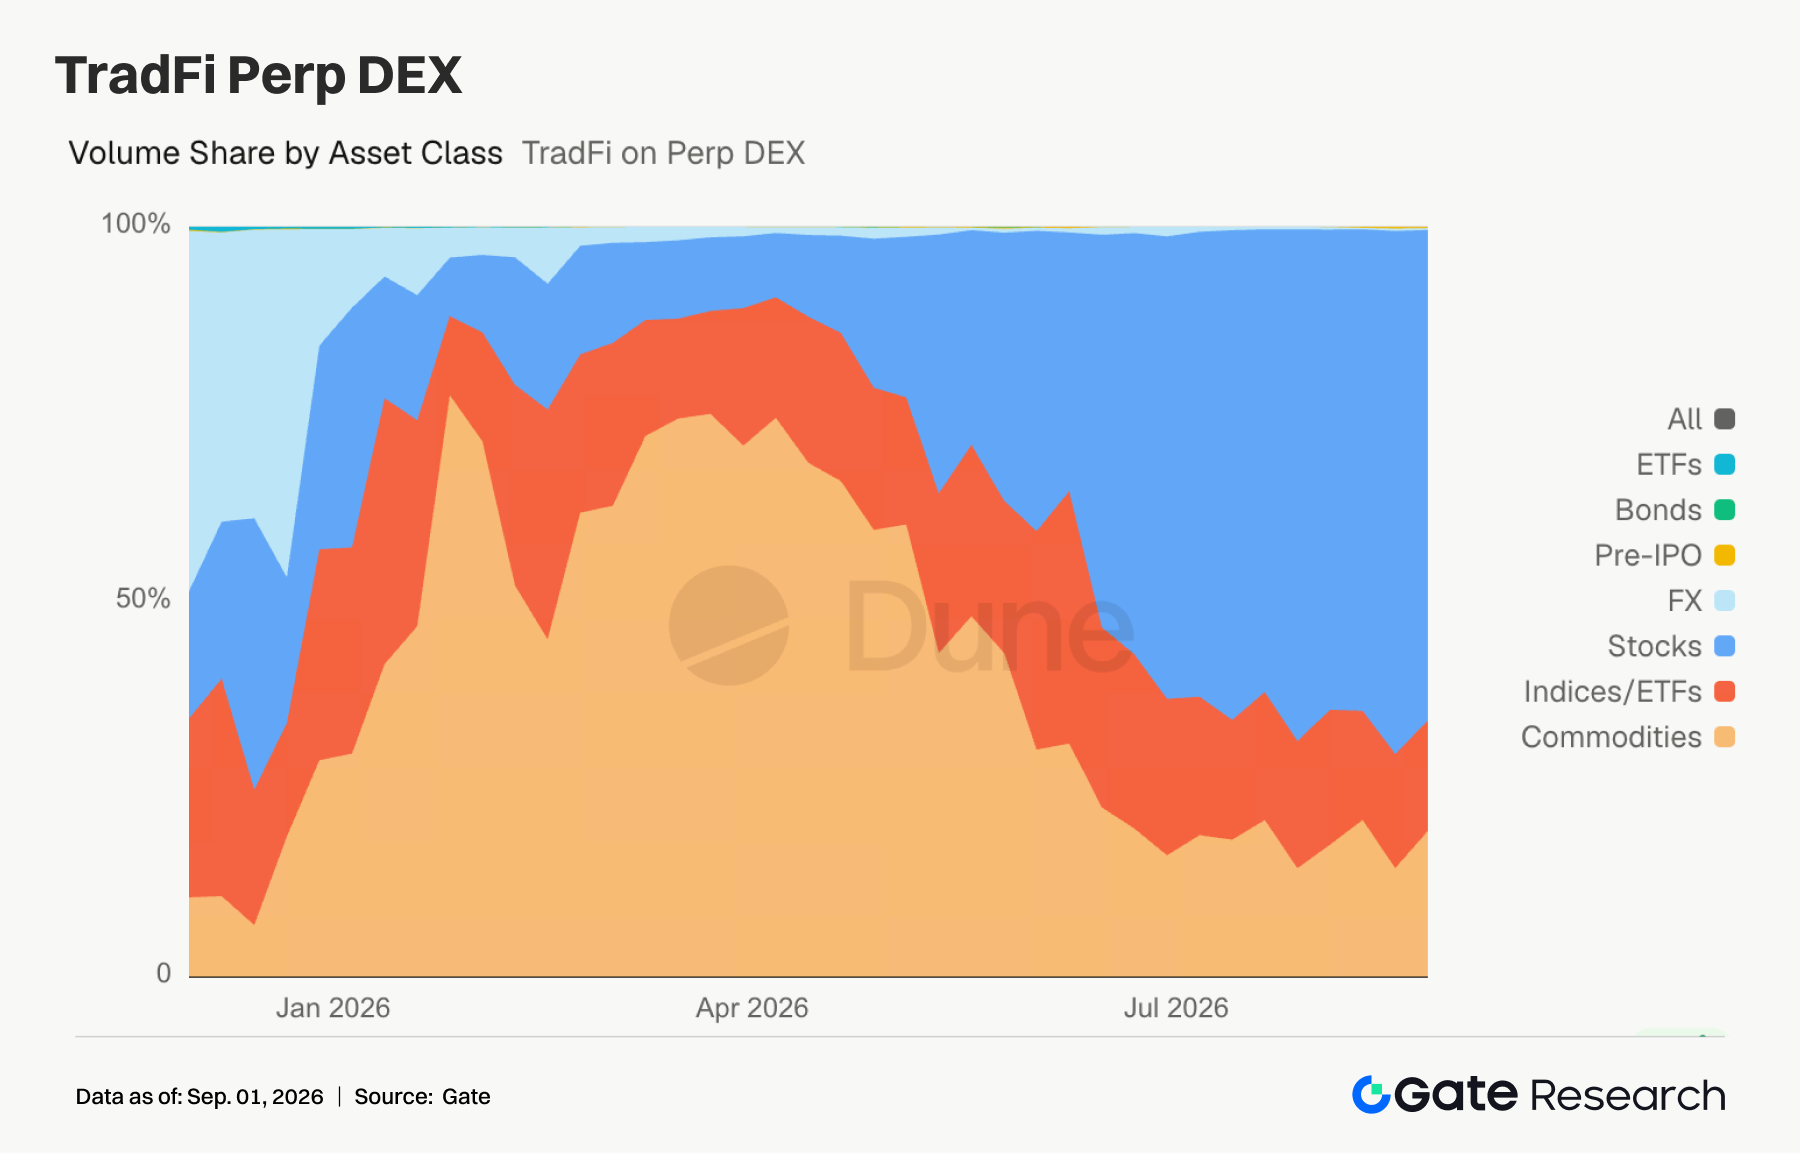
- TradFi Perp DEX: Over the past week, the overall TradFi Perp DEX market maintained the pattern of "stocks leading, with commodities and indices/ETFs sharing the remaining share". Stock trading volume still accounts for approximately 65%–70%, continuing to hold an absolute dominant position, marking a clear reversal from the structure where commodity assets outperformed in the first half of the year. The share of commodities fluctuated during the week, recently rebounding to around 20%, but still far below the peak of over 60% seen between March and April; the share of indices/ETFs remained relatively stable at around 10%–15%.Categories such as foreign exchange, bonds and Pre-IPO remain near marginal levels. Overall, the trading focus of on-chain TradFi derivatives has steadily shifted to equities, while commodities are more driven by periodic macro event trading demands.
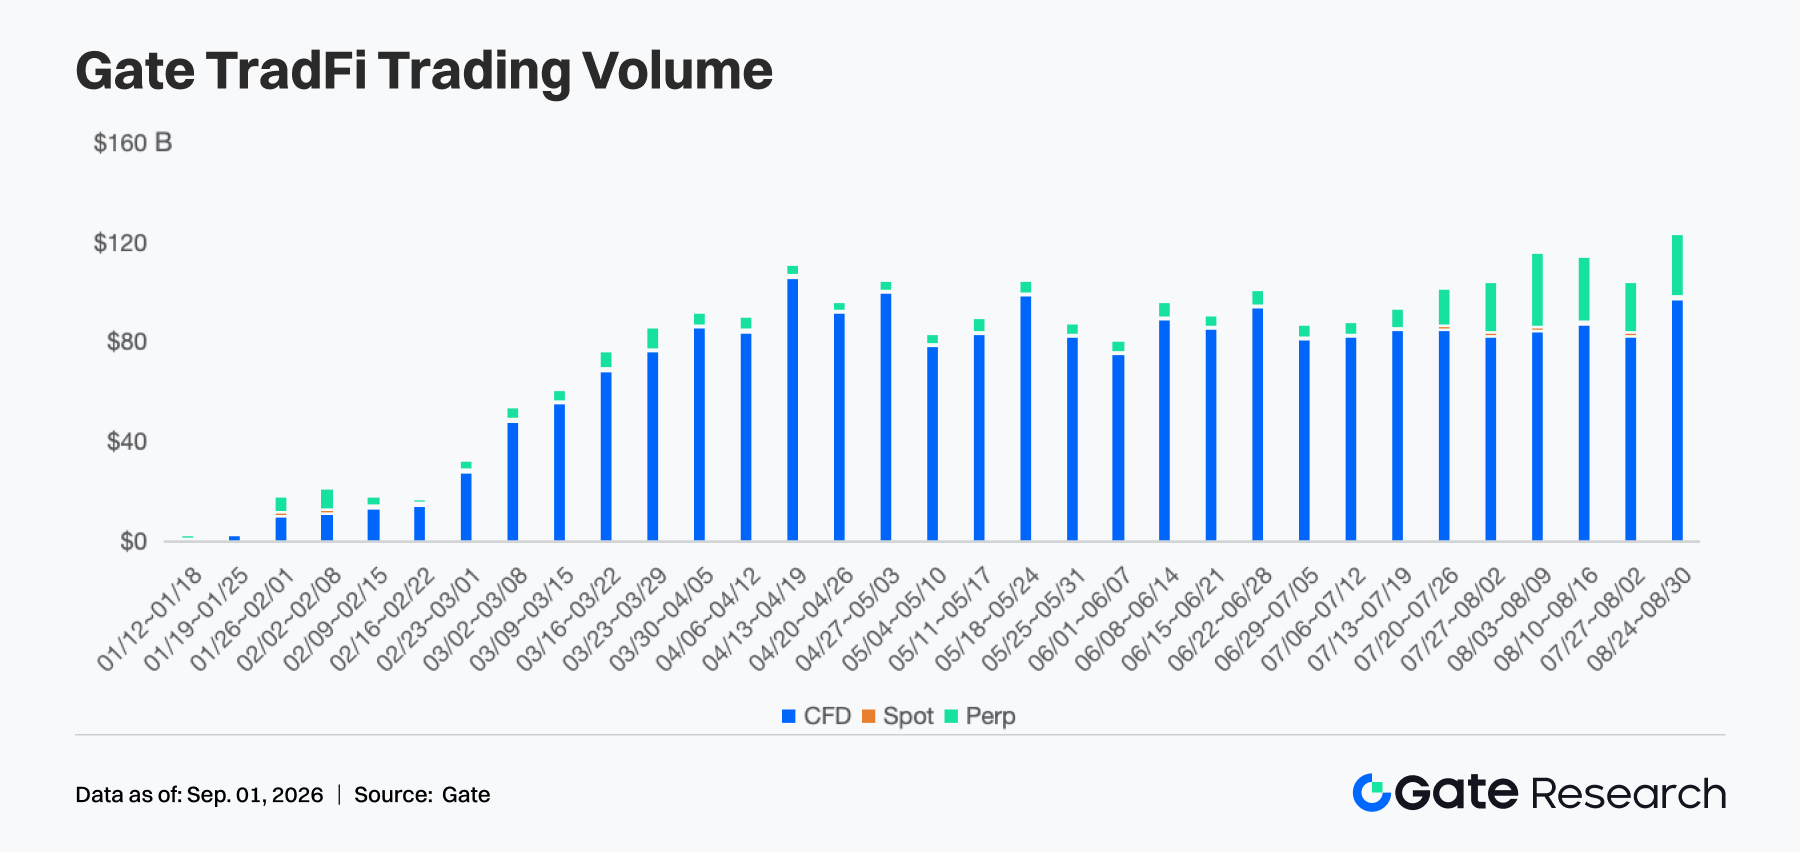
- Gate TradFi Trading Volume: Last week, the total trading volume of Gate TradFi rebounded significantly, rising to around $123 billion, hitting a recent new high and marking an approximately 17% increase from the previous week's roughly $105 billion. CFDs remain the core base, with a weekly trading volume of about $95 billion, accounting for nearly 80% of the total; Perps rose to around $27 billion, a notable increase from the previous week's roughly $22 billion, continuing to be the main source of incremental volume beyond CFDs; Spot trading volume remains at a relatively low level.It is worth noting that the weekly trading volume of Gate TradFi has generally risen gradually from around $100 billion since August. This week, both CFD and Perp trading volumes have increased simultaneously, indicating a renewed expansion in trading activity and a further upward shift in the central level of business scale.
- Gate Stock Asset Trading Volume: Last week, Gate's stock trading structure focused again on the US stock market. The proportion of US stock transactions increased from about 52% in the previous week to about 67%, approaching two-thirds again, continuing to be the largest market; the proportion of Korean stocks decreased significantly from about 36% to about 11%, after two consecutive weeks of rapid expansion, which cooled down significantly. The proportion of ETFs increased from about 8% to about 16%, becoming another highlight of this week's structural changes; the proportion of Hong Kong stocks was about 6%, and the overall level was still low.Compared with the "dual core of US and South Korean stocks" pattern in the previous week, capital has flowed back to US stocks and ETFs this week, reflecting that trading preferences have rotated from highly elastic South Korean stocks back to more liquid US stocks and diversified index instruments.
- TradFi Order Book Depth: We selected XAUT, the TradFi asset with the highest trading volume, to analyze its order book depth (Delta). Over the past week, the price of XAUT experienced a notable pullback, falling from above 4,600 USDT to around 4,450 USDT. During the decline from the 25th to the 28th, the ±1% order book Delta remained negative for an extended period, reaching a minimum close to -3.3 million USD, indicating persistent dominance of sell-side depth, which resonated with the weakening price trend.After 28 days, there was a significant change in the structure. Delta quickly rose to + 3 million USD, and then remained positive for most of the time. From 29 to 31, the overall depth of buyers was about + 200,000 to + 800,000 USD, and broke through + 1 million USD several times. Although the price has not yet rebounded significantly, the order book has shifted from sustained selling pressure to buying dominance, indicating that low-level acceptance is improving. It is necessary to observe whether the positive Delta can continue and promote price stabilization in the future.
3. On-chain Data Insights
3.1 Uniswap large-scale pulse subsides, Robinhood Chain re-accelerates over the weekend
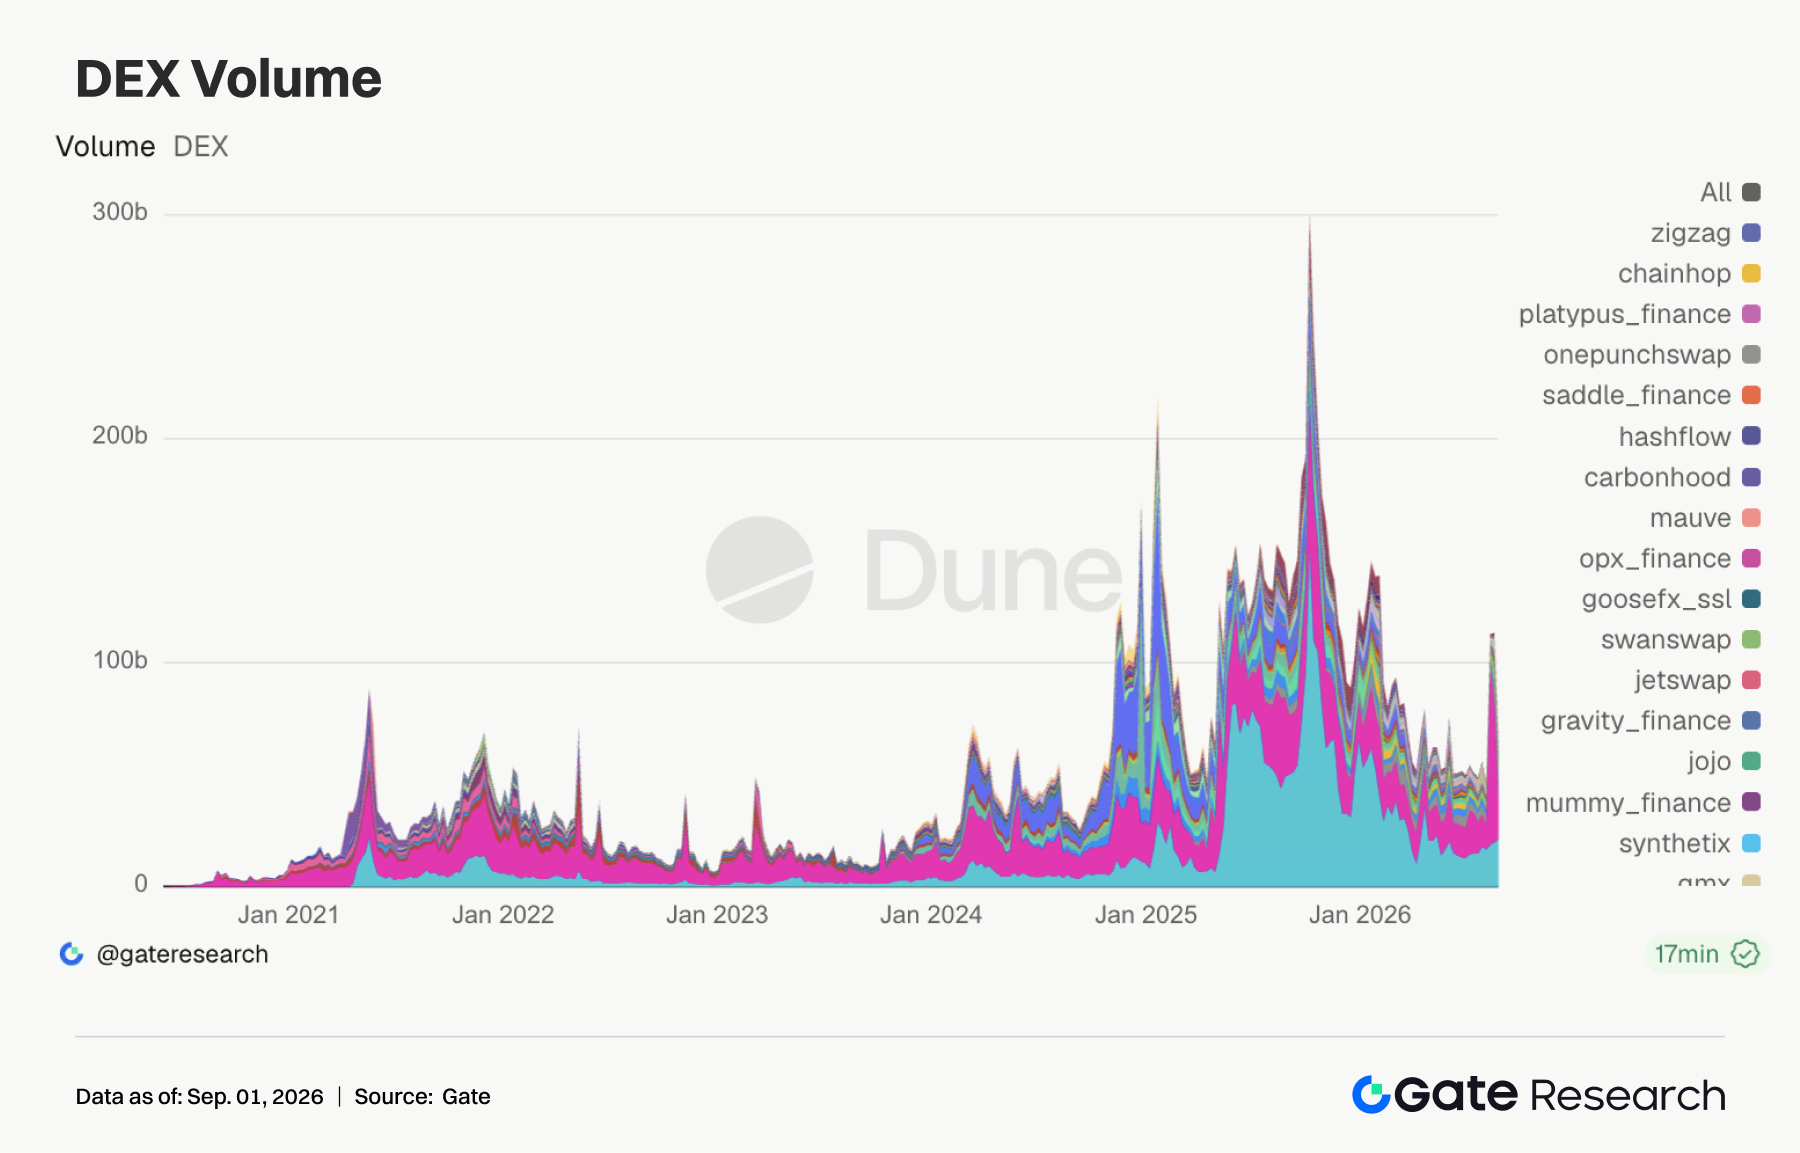
This week, Uniswap's trading volume dropped 72.9% week-over-week, while the number of trades rose 29.2% and the number of unique traders increased by 8%. The divergence between trading value and activity indicates that the large-volume trading pulse driven by Robinhood Chain's stock tokens and meme assets in the previous week has faded, while small-ticket high-frequency trading continues to expand. PancakeSwap reclaimed the top spot from Uniswap with $21.36 billion in trading volume, posting a 7.5% week-over-week increase in total volume, though its number of trades fell 19.8%, reflecting a rise in average trade size.Robinhood Chain has not cooled down in tandem. On a single weekend day, DEX trading volume on the chain exceeded $1 billion, with TVL rising by around 17.8% week-on-week. meme assets such as PONS and CASHCAT, along with stock tokens, drove trading activity. However, of the more than 11,000 tokens launched in a single day on the Uniswap launchpad earlier, only about 1% remained tradable by the end of the month, indicating a coexistence of surging traffic and a high token attrition rate.PumpSwap trading volume increased by 28.3%, Pump.fun Bonding Curve trading volume rose by 27.8%, and Solana meme coin weekly spot trading volume exceeded 5.2 billion USD, hitting a new high for the year.Capital is rotating rapidly between memecoins on Solana, Robinhood Chain and BNB Chain. Aerodrome and BisonFi retreated by 13.6% and 26.9% respectively, while Base failed to sustain the explosive growth seen in the previous week.
3.2 Stablecoin supply increased by approximately $1.7 billion, with new issuance shifting toward institutional settlement and yield-bearing dollar assets
The total supply of stablecoins and on-chain dollar-denominated assets increased by $1.73 billion week-over-week, representing a 0.56% growth. Among them, USDT saw a modest increase; USDC rose by approximately $283 million; RLUSD increased by around $296 million, marking a 14.3% growth; USD1 climbed by roughly $180 million to $4.19 billion; BUIDL and USDTB increased by $205 million and $196 million respectively.Meanwhile, USDS decreased by 275 million USD, USYC decreased by 149 million USD, and PYUSD decreased by approximately 92.4 million USD. The growth in supply is diversifying into payment, institutional settlement, and tokenized Treasury yield products. Recent developments are largely consistent with the supply changes. RLUSD's market capitalization exceeded 2 billion USD this week, with its supply on both Ethereum and XRP Ledger approaching 1 billion USD; USD1 is natively issued on the Canton Network, serving as the cash leg for tokenized asset trading and collateral for derivatives.
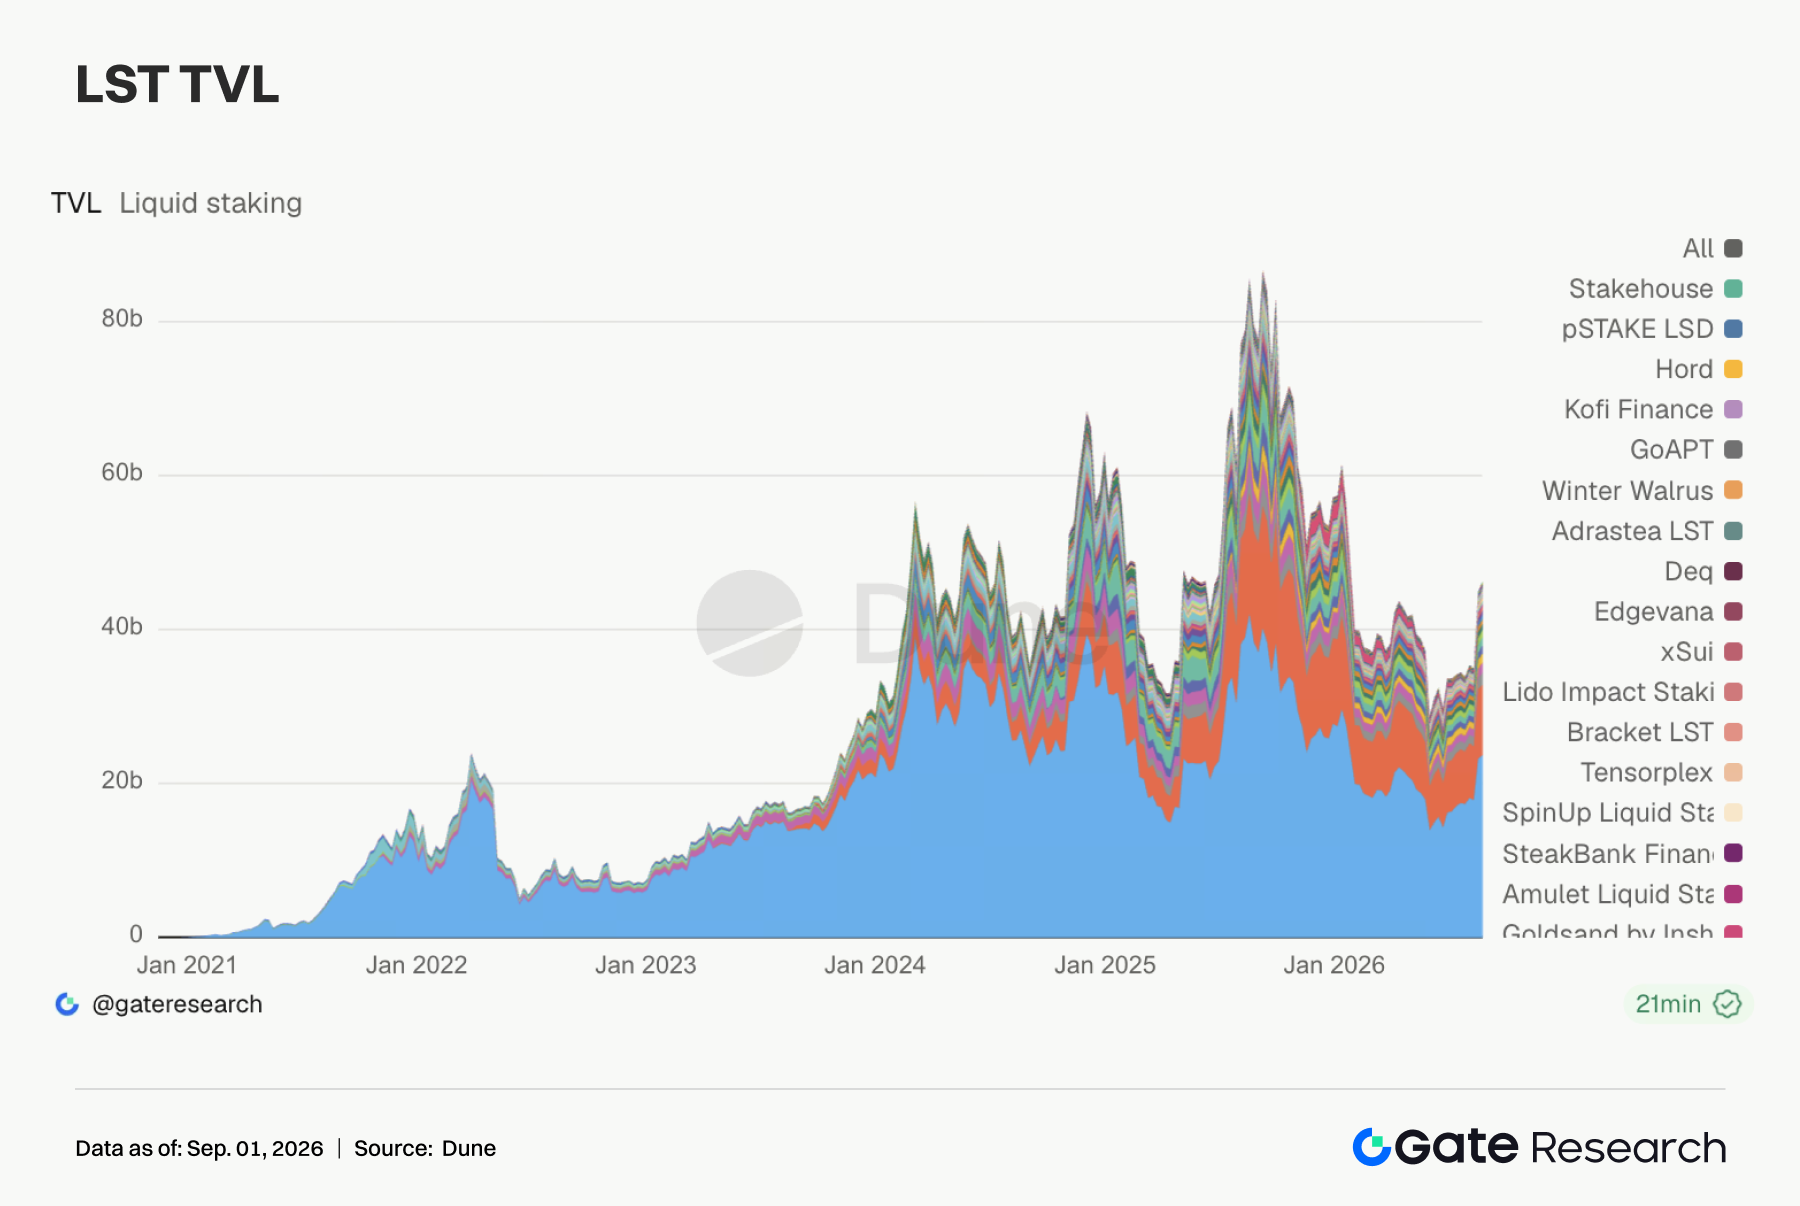
LSTs on the ETH chain have entered a moderate growth phase. Lido's TVL increased by 1.9% to $23.71 billion, Rocket Pool rose by 1.5%, while StakeWise remained largely flat. This week, Lido reduced the fixed management fee of the EarnETH Vault from 1% to 0.2% and raised the performance fee to 15%, reflecting that the protocol is competing for yield aggregation capital by lowering the cost of carry. SOL-based LSTs showed much stronger momentum.Sanctum increased by 14.1% to $1.61 billion, Jito rose by 9.8%, and Jupiter Staked SOL grew by 13.1%. The Bitwise Solana Staking ETF surpassed $1 billion in assets under management this week, with a net inflow of approximately $138 million over the past 10 days, and around 96% of its assets allocated to staking;Meanwhile, Solana validators passed the SGP-0002 proposal to accelerate the decline in inflation, which is expected to reduce SOL issuance by approximately 18.9 million over the next six years. The rise in SOL LSTs is driven not only by token price factors, but also by ETF inflows, staking yields, and expectations of supply contraction. The HYPE sector has cooled off, with Kinetiq kHYPE up 2.4% and stHYPE down 2.8%, consistent with the pullback in Hyperliquid's trading volume and revenue.
3.4 Aave's total borrowing volume has entered a plateau, with V4 growth yet to translate into credit expansion across the entire protocol
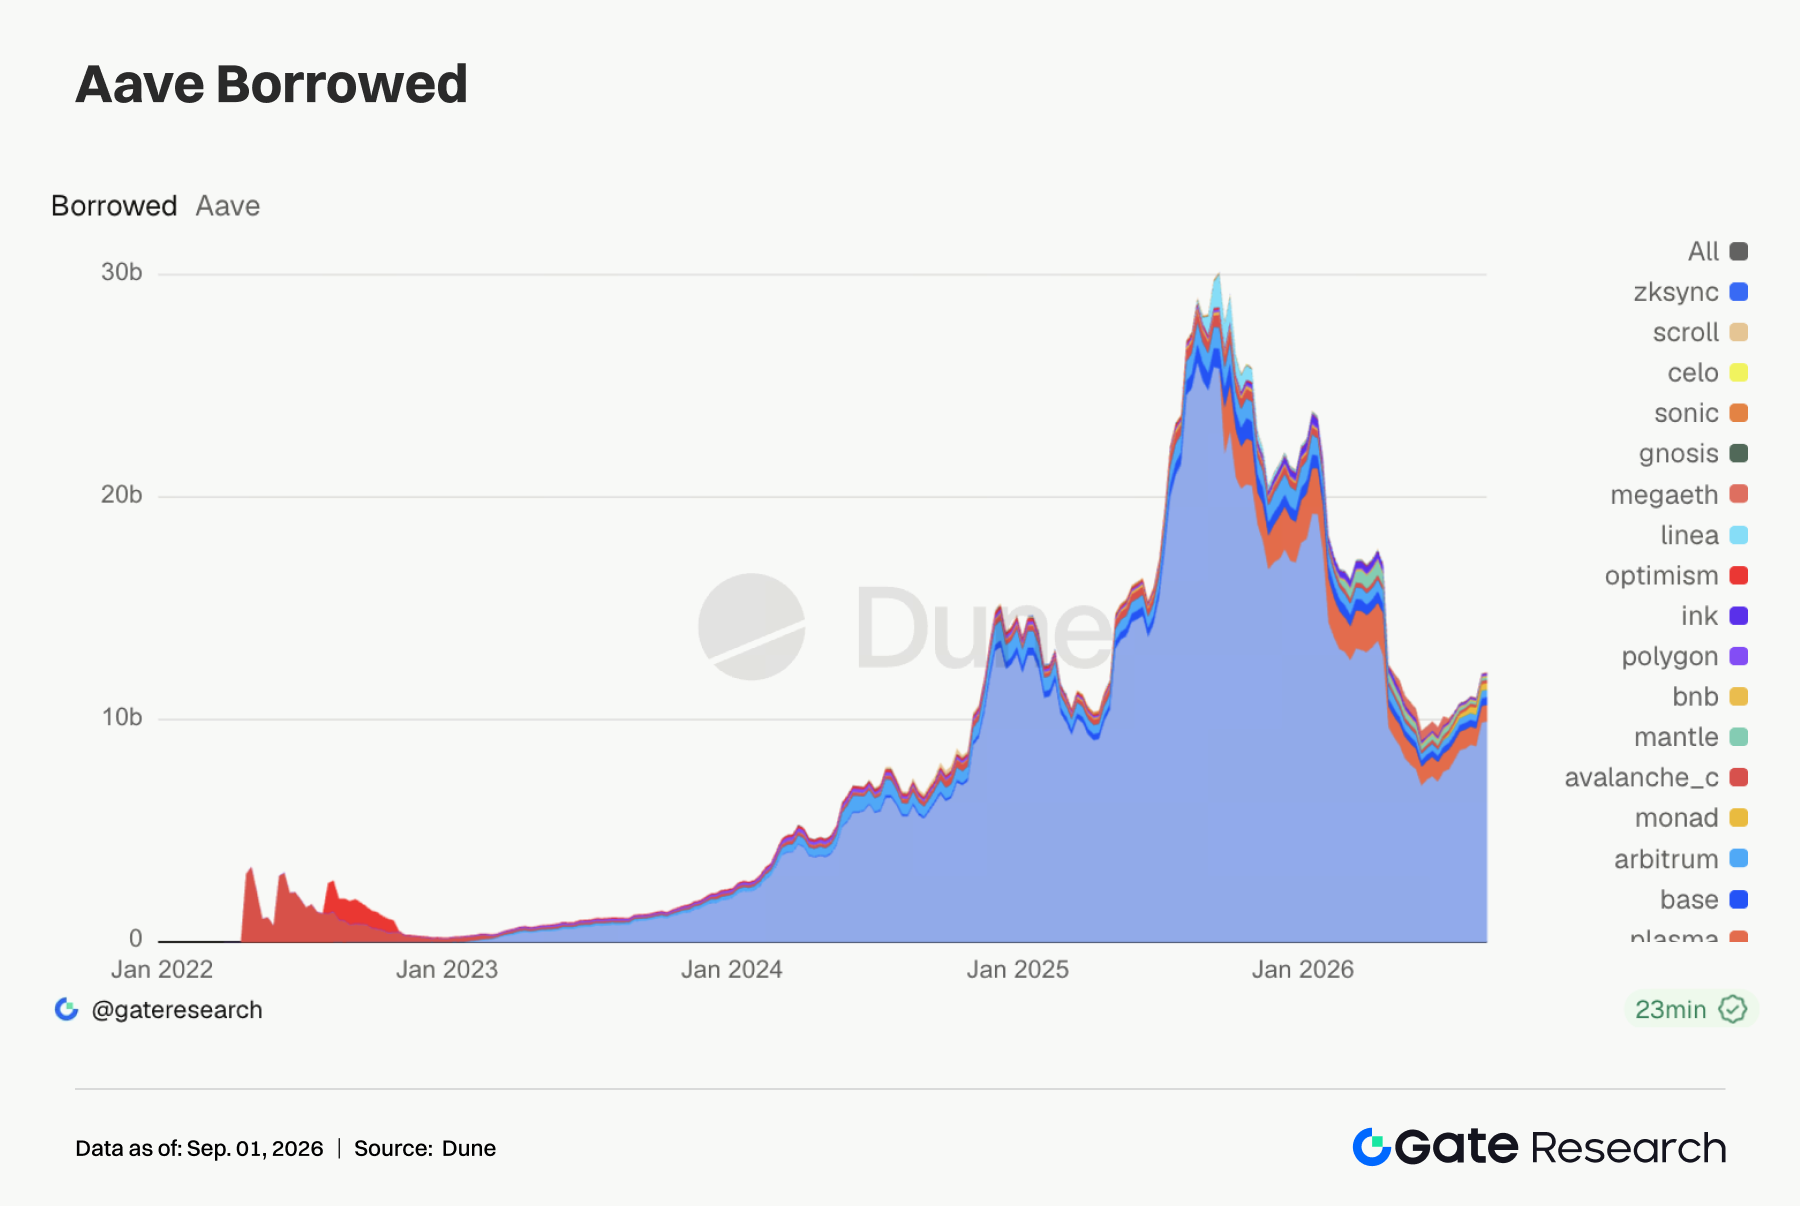
The total borrowing volume of Aave across all chains stands at approximately $12.15 billion, with a week-over-week increase of only 0.35%. The Ethereum market rose from $9.887 billion to $9.936 billion, representing an increase of around $49 million. Base, Arbitrum, Plasma, and Monad all saw slight declines, with Mantle dropping by 2.6%. Ink bucked the trend with a 10.6% increase to $48.2 million, but its absolute scale remains small and cannot alter the overall sideways pattern of cross-chain borrowing. A structural shift is emerging within the protocol.Aave V4's deposit size has risen to approximately $806 million, marking a 30% increase over 7 days, with active loans standing at around $216 million. Funds are primarily distributed across standalone markets such as Ethereum Core, EtherFi Cash on Optimism, and Global Dollar. The Hub-and-Spoke architecture of V4 is attracting deposits, yet a significant portion of the newly added funds remains on the supply side, with corresponding borrowing demand not yet materialized.Institutional capital needs to continue monitoring the V4 loan utilization rate, the effectiveness of risk isolation between different Spokes, and whether the newly added RWA collateral can generate meaningful borrowing
3.5 The borrowing costs of stablecoins continue to rise, with USDT liquidity marginally tightening
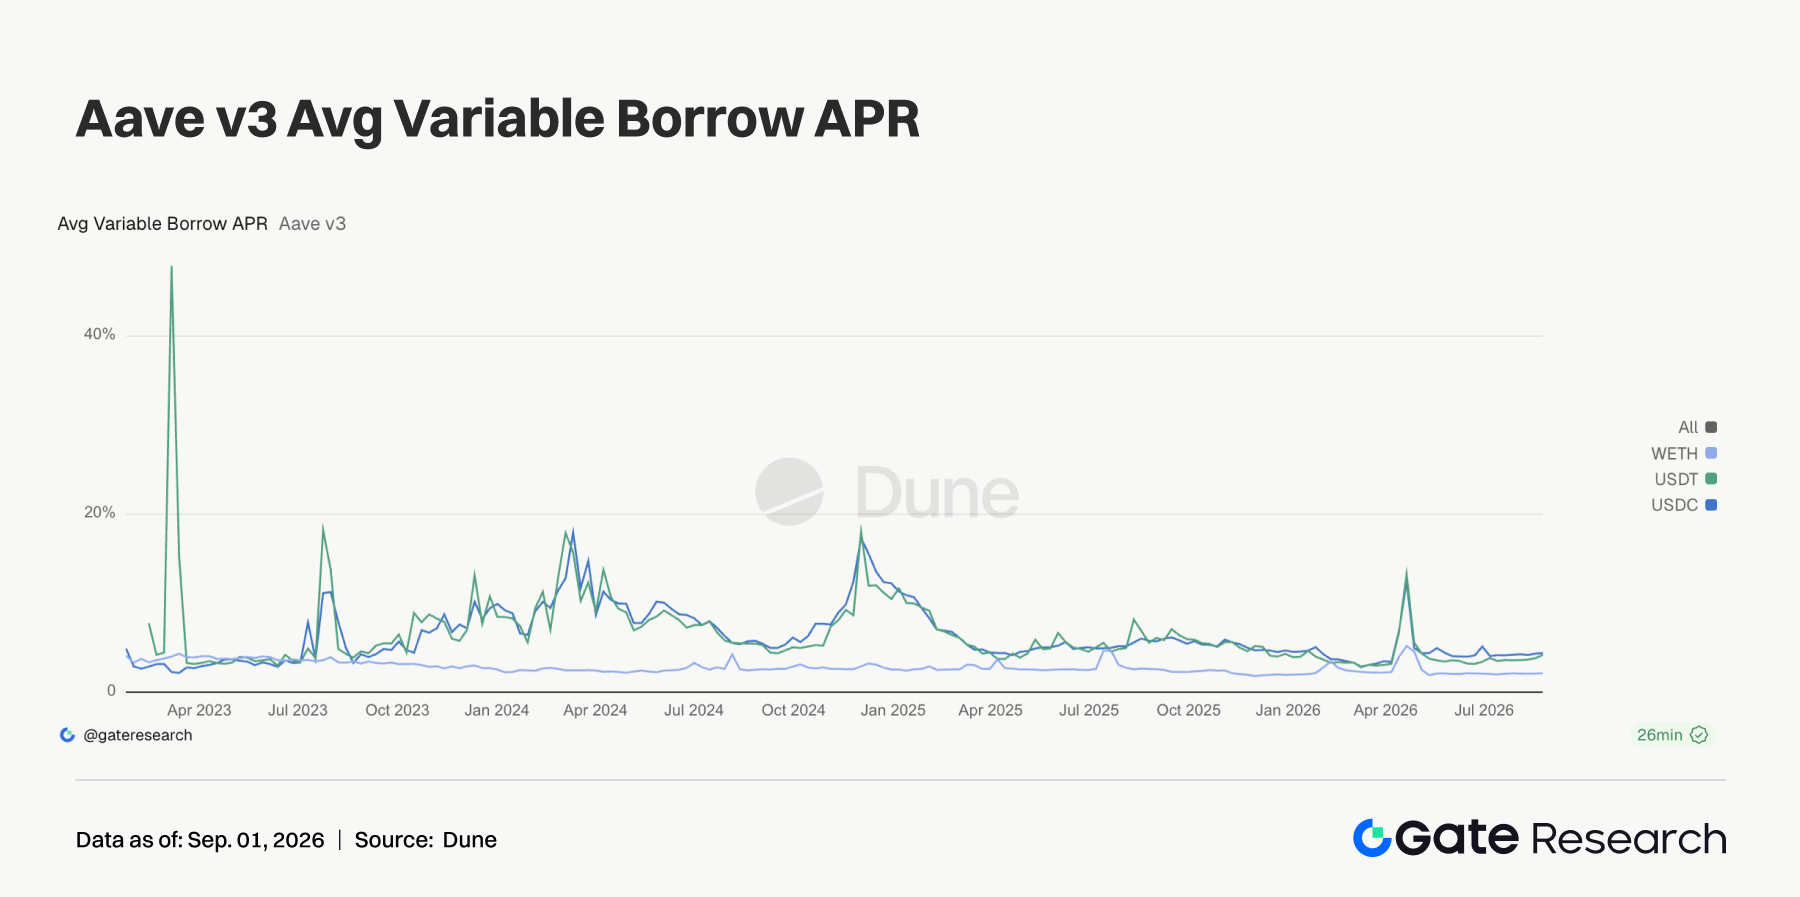
The average borrowing rate of USDC rose from 4.37% to 4.42%, an increase of about 5 basis points, with the highest rate during the week approaching 14%; the average rate of USDT rose from 3.85% to 4.22%, an increase of about 37 basis points, and its highest rate climbed from 4.52% to 5.39%. The average rate of WETH edged up slightly from 2.13% to 2.15%. The borrowing balance remained largely flat while the USDT rate rose significantly, indicating that the change mainly stems from localized utilization rates and the structure of stablecoins.USDC has deeper institutional and cross-chain liquidity. While its tail rates are higher, its average cost remains relatively stable. USDT's previous cost advantage is narrowing. WETH rates remain low, and directional leverage on ETH is restrained. This week's rise in staked assets is driven more by spot valuation and yield strategies rather than borrowing for leverage.
3.6 Pump Revenue Nears Hyperliquid, Meme Frontend Emerges as This Week's Major Profit Driver
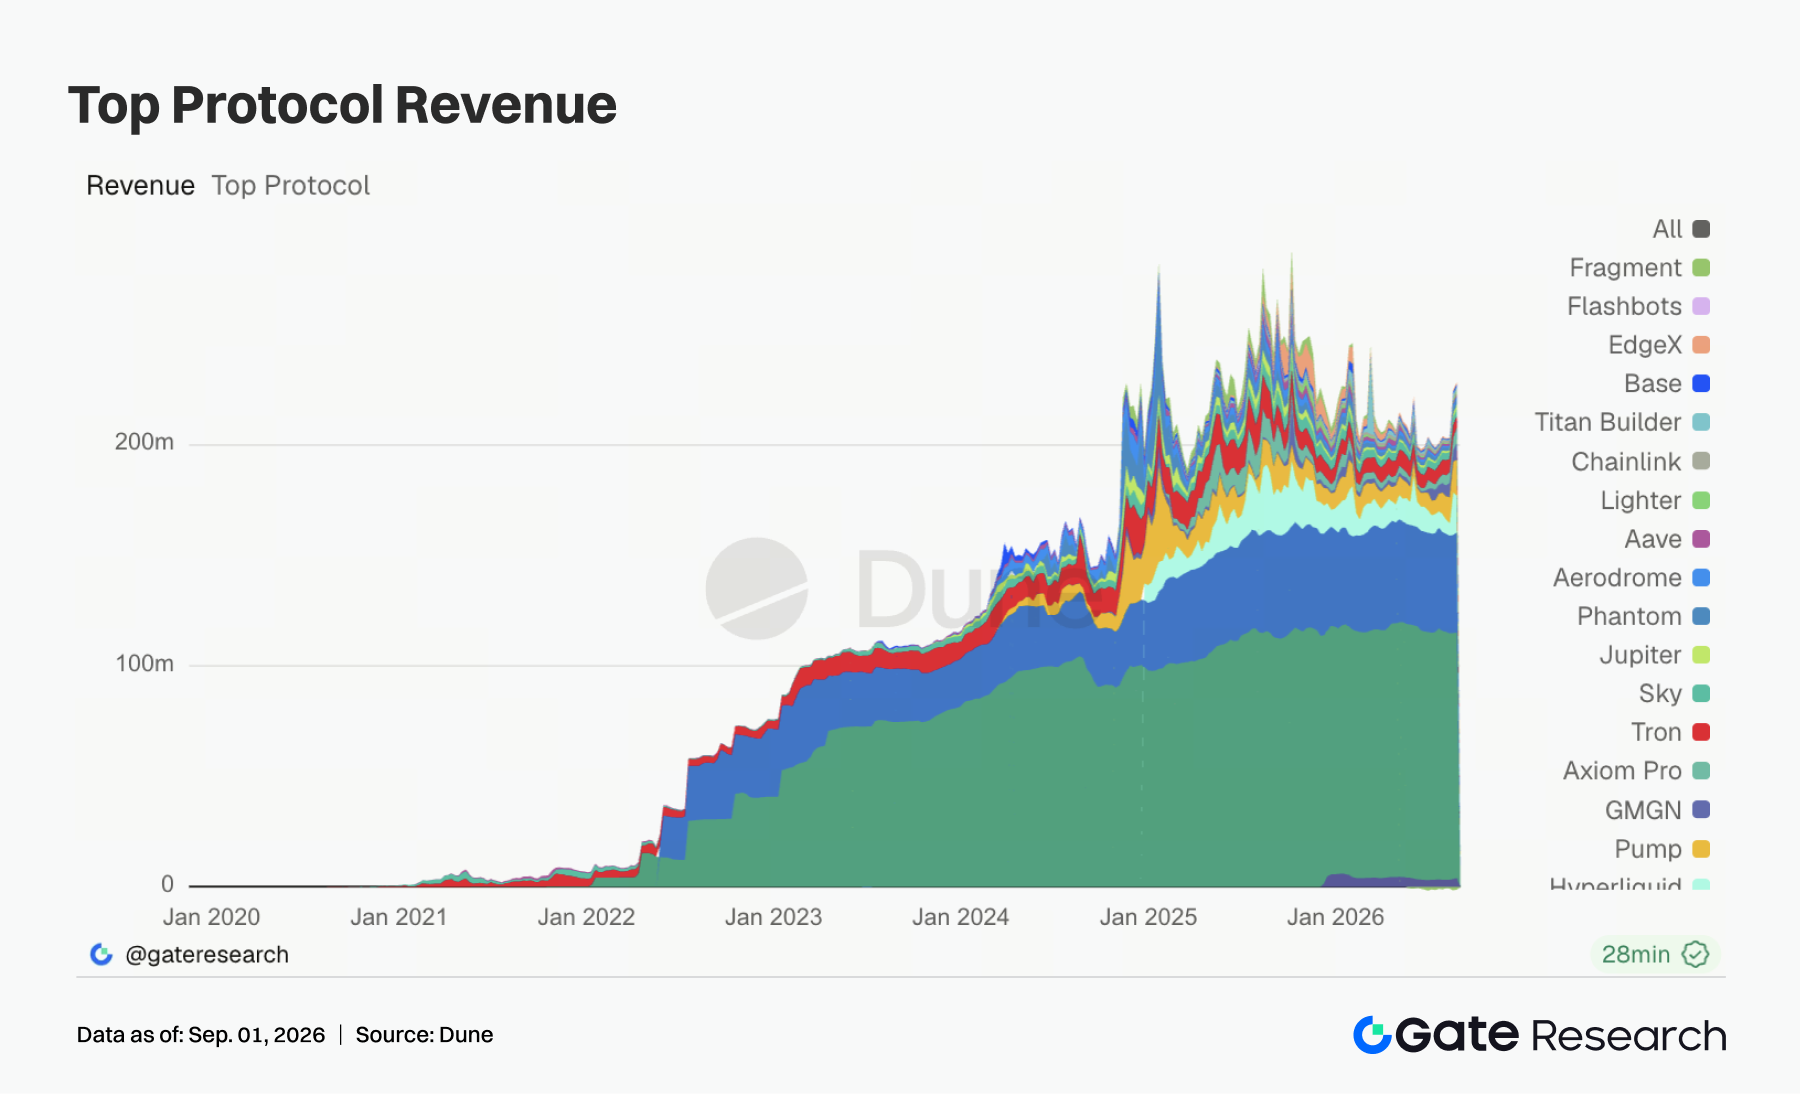
This week, Hyperliquid's revenue dropped from $19.33 million to $16.77 million, a 13.2% decline; Pump's revenue rose 19.0% to $16.28 million, narrowing the gap between the two to less than $500,000. GMGN's revenue increased 40.6% to $7.48 million, Axiom Pro grew 23.9%, and Jupiter rose 22.1%, indicating that meme trading and retail frontends were the clearest revenue growth drivers this week.Pump.fun Bonding Curve trading volume has increased for five consecutive weeks, with weekly trading hitting $928 million on August 17, nearly doubling from mid-July. This week, trading volumes on both PumpSwap and Pump.fun have risen again, proving that the growth in Pump's revenue is underpinned by genuine trading activity. GMGN, on the other hand, benefits from the cross-chain meme rotation across Robinhood Chain, Solana, and BNB Chain.Aave's revenue increased by 21.2% to $1.2 million, while Lighter posted a 10.7% growth; however, Titan Builder, Base and Aerodrome saw declines of 39.0%, 20.2% and 11.2% respectively.The industry revenue structure is a combination where stablecoin issuance maintains a base position, meme-trading frontends provide front-end growth, and lending is slowly recov
4. Derivatives Tracking
4.1 OI retreats after BTC fluctuates at high levels, funding rates cool down while bullish structure remains dominant
Over the past week, BTC has generally shown a trend of rallying before retracing. The price opened near $77,700 at the start of the week, briefly rose to $81,500 on August 28, but failed to sustain the breakout, then pulled back to around $77,600, ending the week largely flat. The weekly low was around $76,600, indicating that BTC has shifted from the rapid upward movement of the previous week to a consolidation at elevated levels phase.
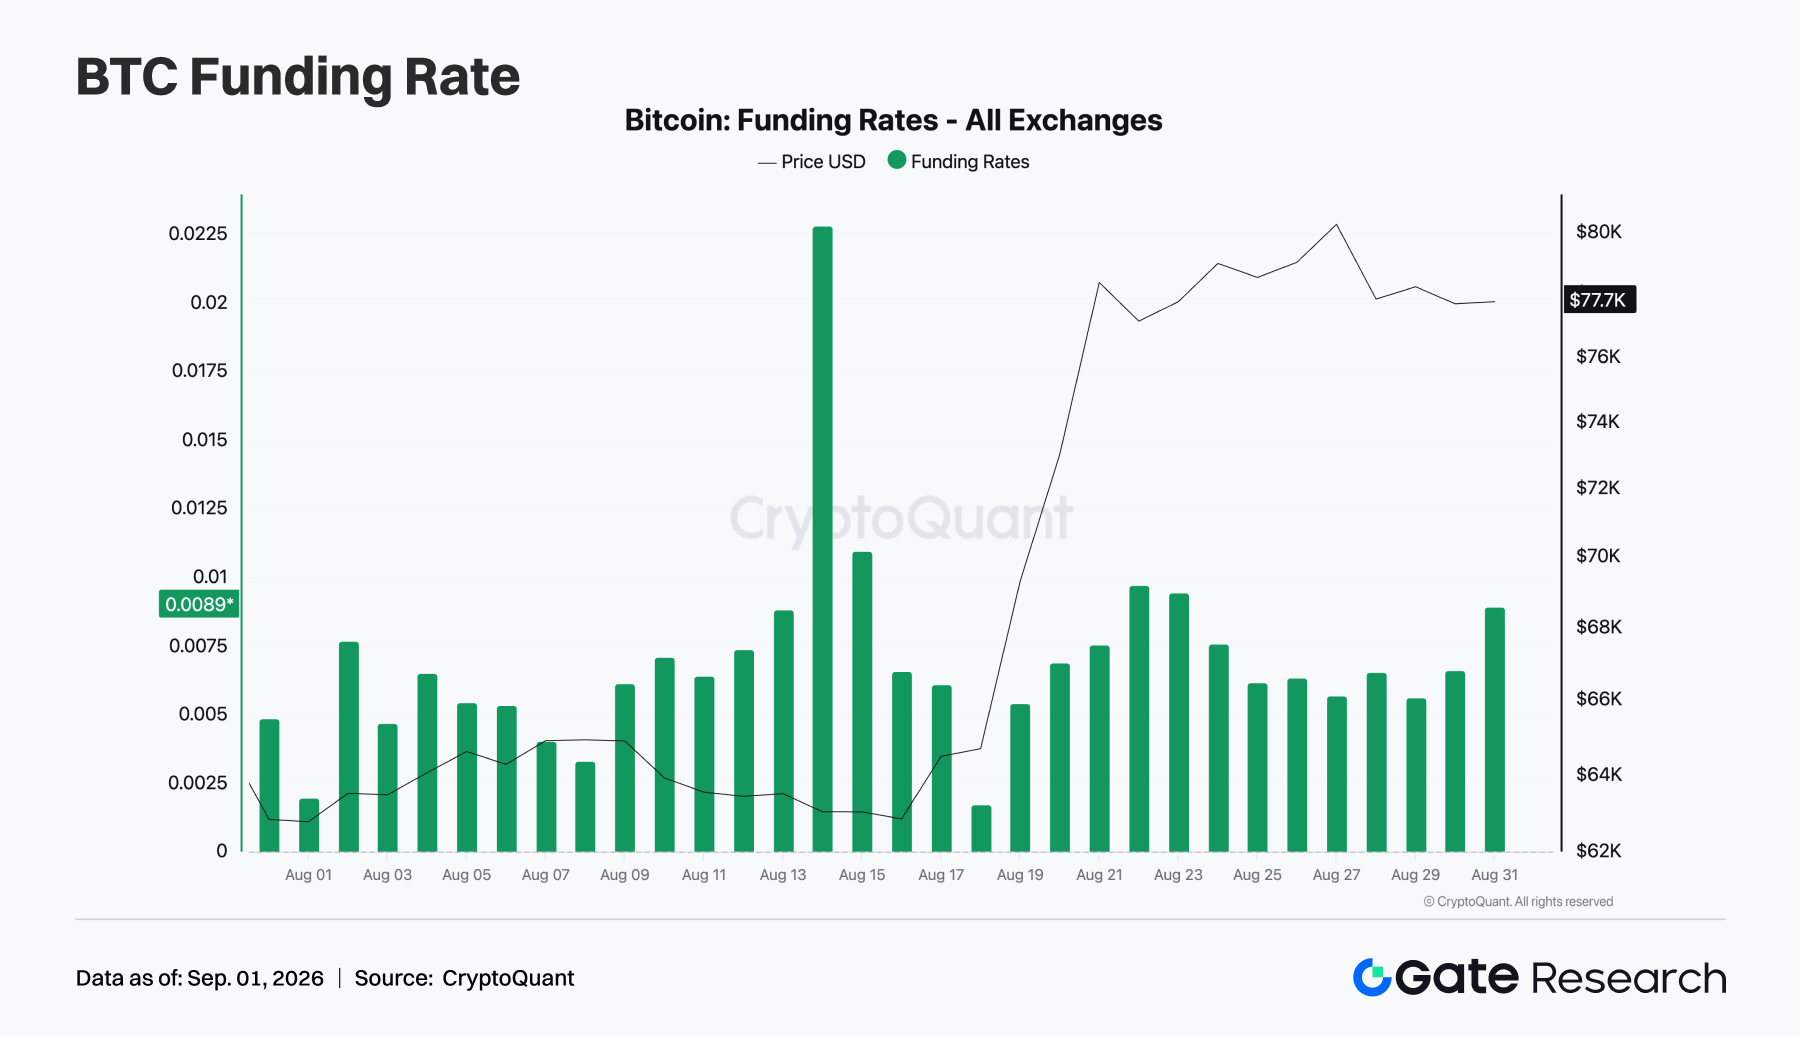
Cross-exchange aggregated OI stood at around $12.6 billion at the start of the week, rose to about $13.4 billion mid-week, and pulled back to roughly $12.4 billion by the weekend. When the price surged above the $80,000 level, there was no sustained OI expansion. Instead, the pullback phase was accompanied by the unwinding of some leveraged positioning, indicating limited follow-through from momentum-driven capital. Funding rates remained predominantly positive, with the Gate BTC perpetual rate staying within the 0.0001%–0.0094% range across most settlement periods, only briefly turning negative during the week, a notable easing from the high positive funding environment of the previo
Overall, this week the BTC derivatives market has exhibited a combination of range-bound price action at elevated levels, OI peaking and then pulling back, and moderately positive funding rates. The market has not yet shifted into a crowded short position, nor has long leverage continued to accumulate further. If BTC reclaims and holds above the $80,000 level, it will be critical to watch whether OI expands in tandem; if it breaks below the vicinity of $76,600, positions held at positive funding rates may still face further deleveraging pressure.
4.2 Positions shift to September and year-end contracts after the expiry at month-end, as short-dated put activity increases
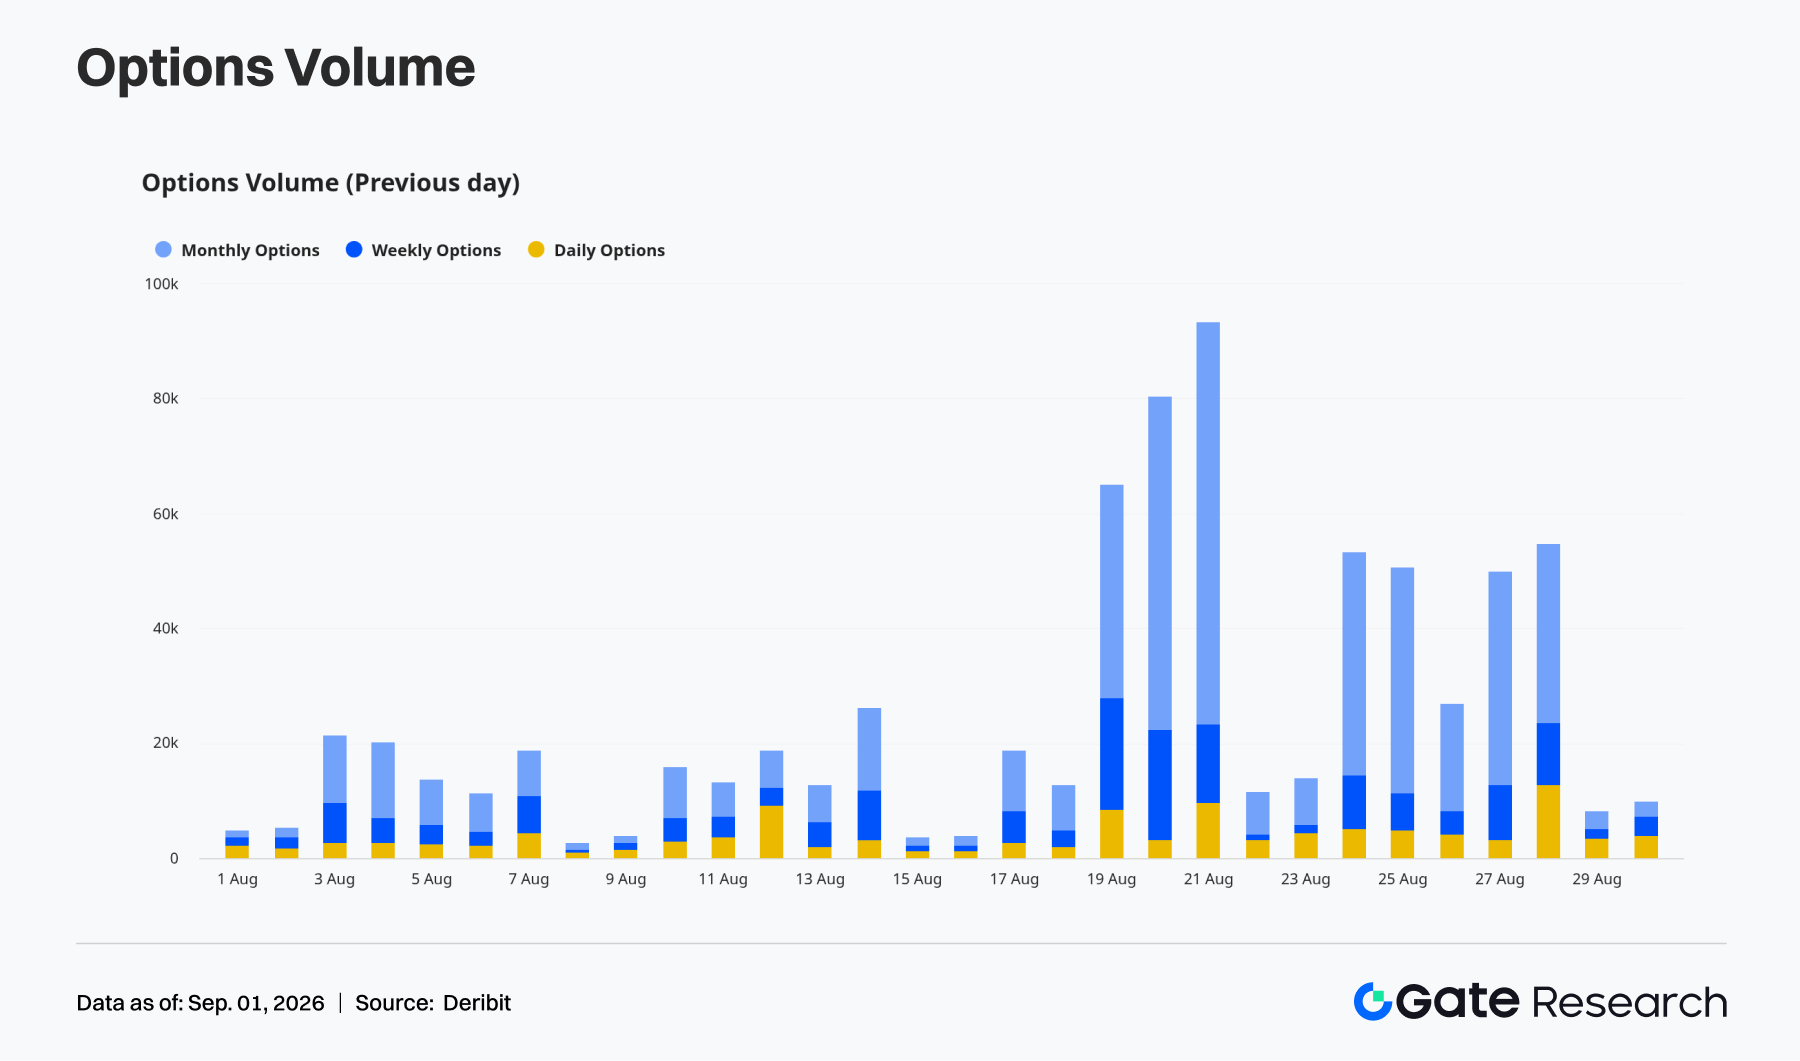
The options market completed part of its position rotation following the expiry at the end of August. As of August 31, the notional open interest of BTC options stood at approximately 31.2 billion USD, with a 24-hour notional trading volume of around 940 million USD. The overall open interest Put/Call Ratio was 0.57, indicating that the medium- and long-term positioning remains predominantly bullish in structure; however, the 24-hour trading Put/Call Ratio rose to 1.34, with short-term put option trading volume exceeding that of call options.
In terms of term structure, the OI of the contract expiring on September 25 is approximately USD 12.45 billion, and the OI of the contract expiring on December 25 is around USD 8.72 billion. The combined OI of these two contracts accounts for nearly 70% of the total OI, with monthly and quarterly contracts remaining the core vehicles for risk allocation. Meanwhile, the Put/Call trading ratios of short-dated contracts expiring on August 31, September 1 and September 3 reached approximately 2.75,3.66 and 3.23 respectively, indicating that the market has increased short-term hedging allocations following the pullback from highs.
Overall, the options market this period is characterized by a structure where bullish positions in the medium to long term dominate, while demand for short-term protection has picked up. End-of-month position rolls have shifted the core position focus to September and year-end contracts, and the rise in short-dated put trading also indicates the market remains cautious amid range-bound trading at elevated levels.
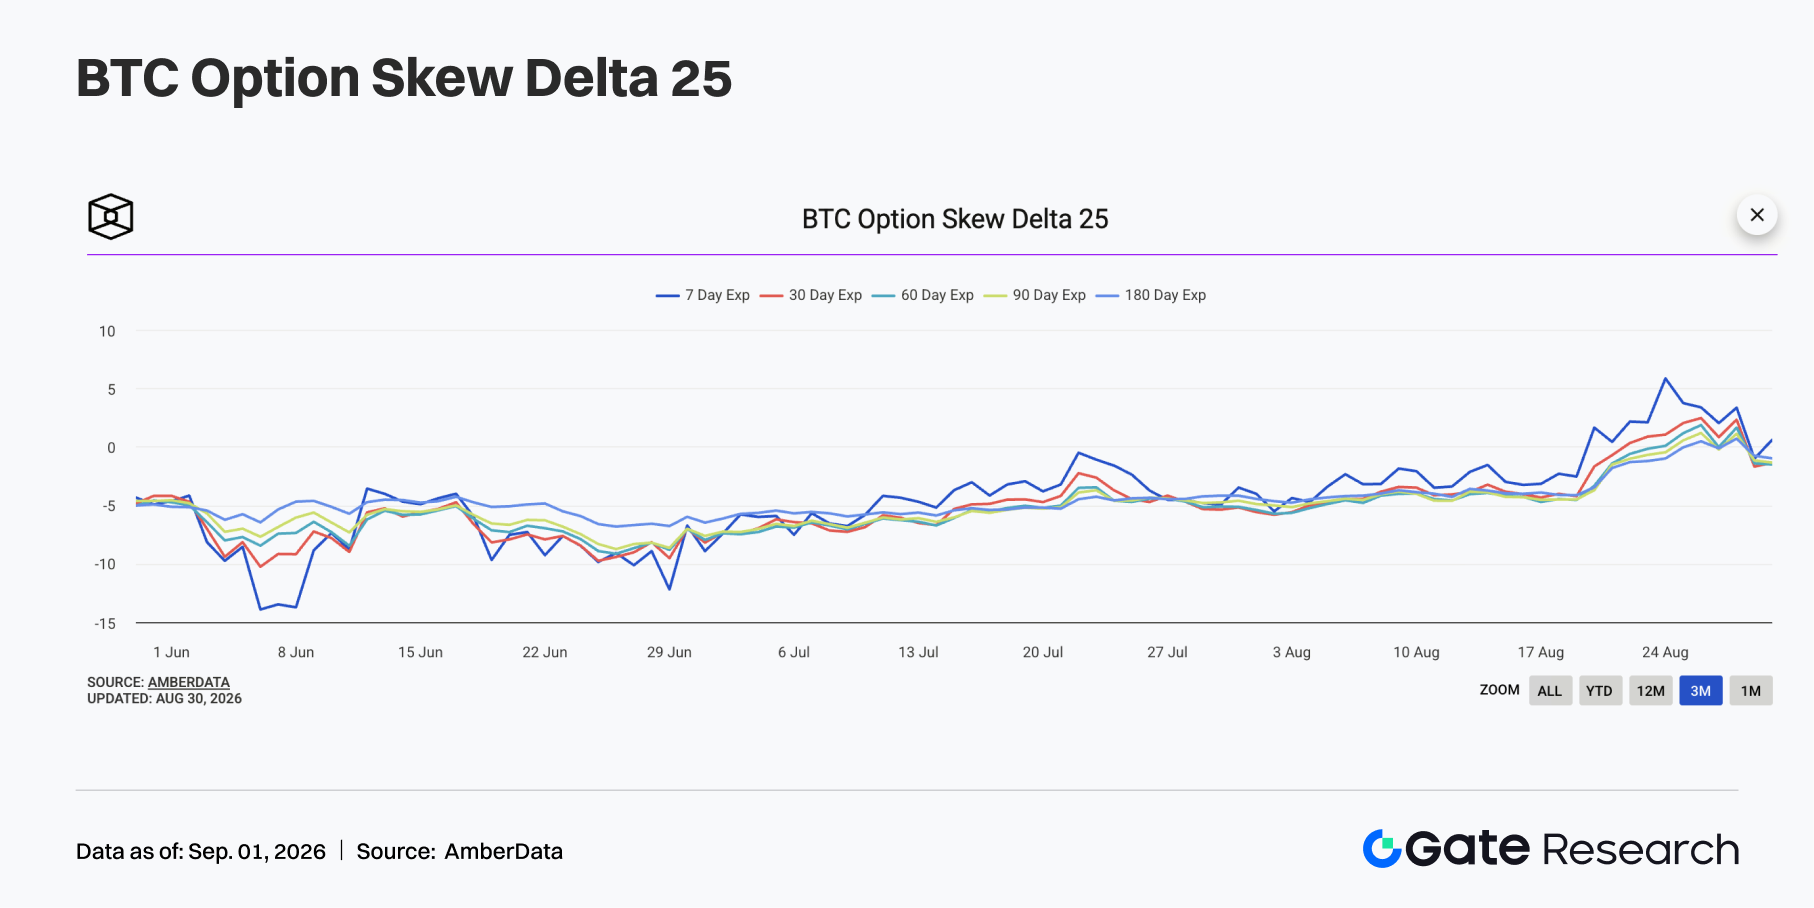
4.3 The 25D Skew has shifted from a defensive bias to neutral, with the downside-protection premium narrowing
The 25-delta skew normalized somewhat this week. Last weekend, the short-dated put skew for BTC was around -5.2% at one point, reflecting hedging demand after the pullback from highs; by the end of this week, the indicator rebounded to -3%, staying within a mildly negative, normal range. A negative value means the implied volatility of put options is higher than that of call options, so the market still retains a certain downside protection premium, but has not yet entered panic pricing.
The current reading of -3% is significantly above the sub -7% range typically considered extremely defensive, and sits at the lower end of its 30-day, 90-day and one-year historical percentiles, indicating relatively moderate hedging costs. Meanwhile, the bullish skew remains around + 3%, suggesting no meaningful pullback in medium-term upside positioning.
Overall, this week's Skew structure reflects that the previous defensive sentiment is cooling down, and the market's concerns about a sharp pullback from highs have eased compared to last week. If BTC stays within the range of $77,000 to $80,000, Skew may remain mildly negative; if it breaks below $76,600 again, demand for short-dated protection could pick up once more.
4.4 DVOL fell from around 43 to around 37, with short-end volatility pricing returning to stability
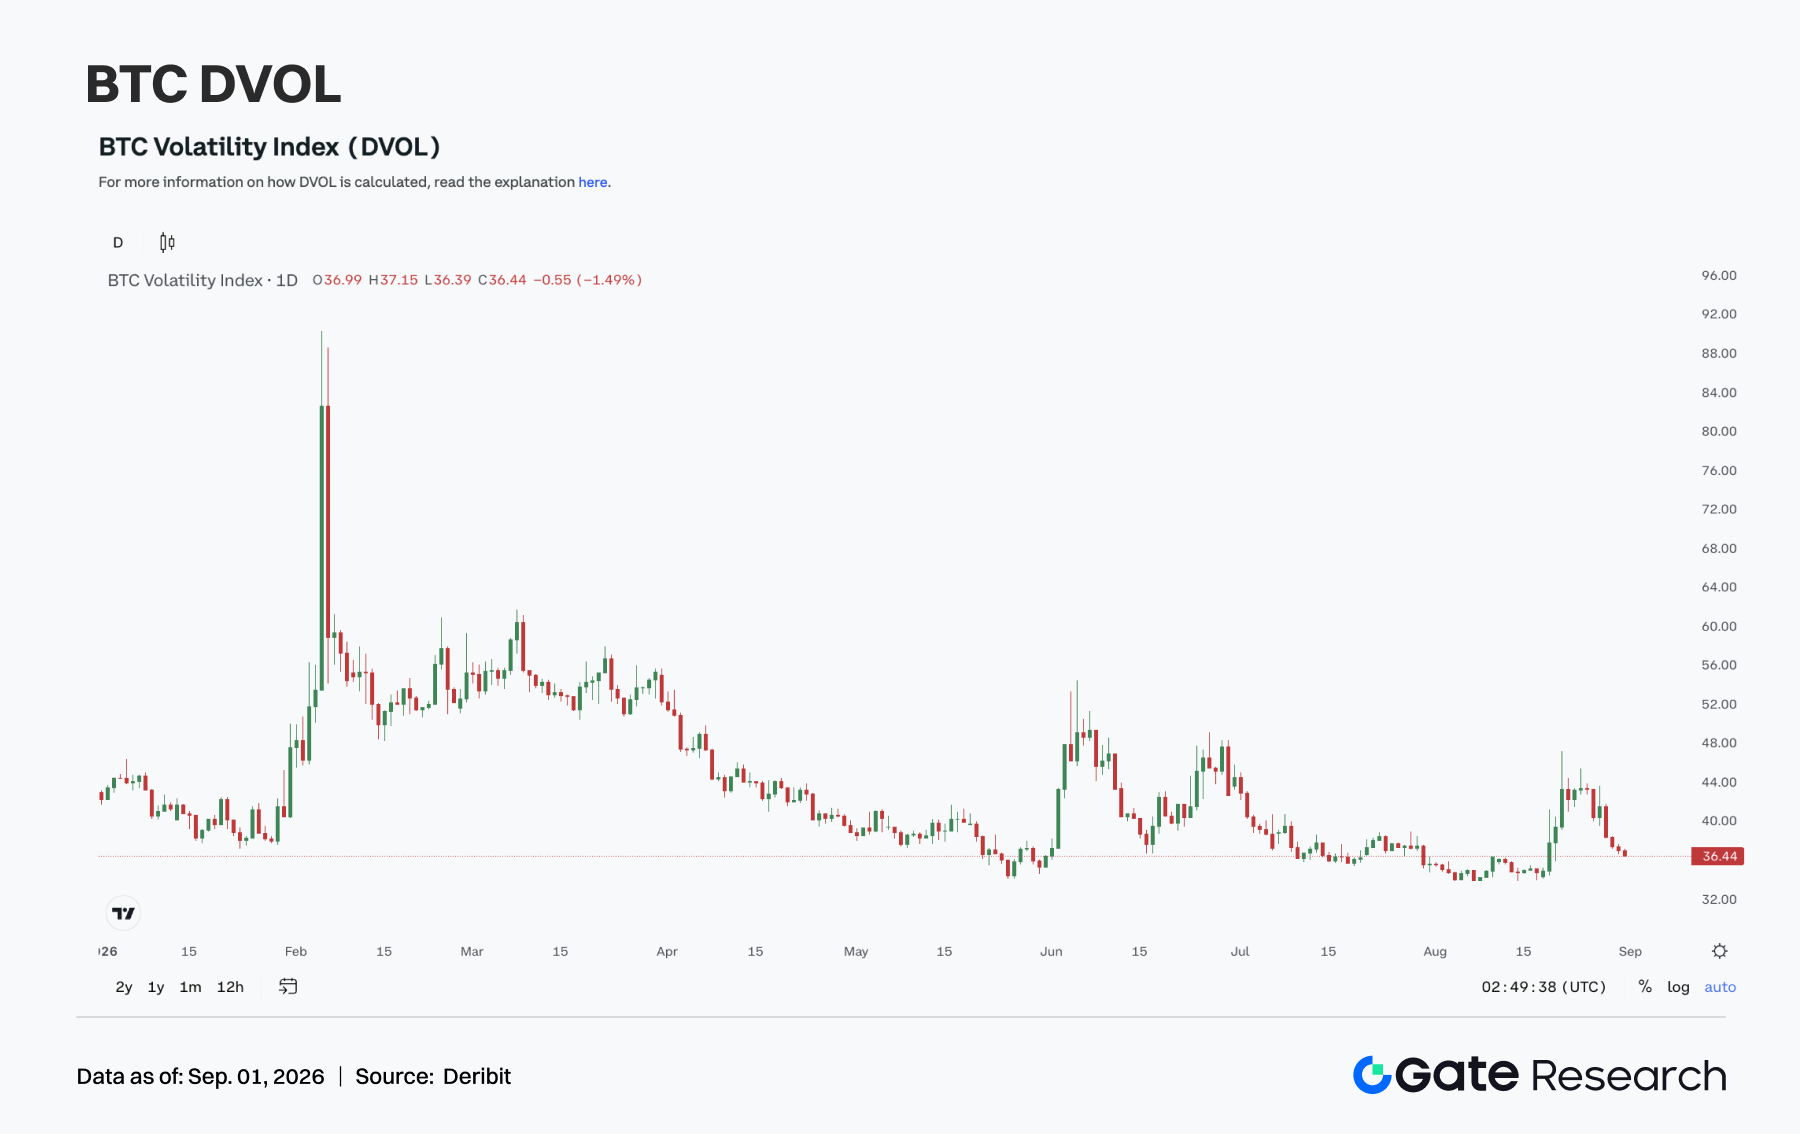
BTC DVOL has seen a notable overall pullback this week. On August 24, DVOL stood at around 43.2, having risen to near 46 earlier in the week. It then trended steadily downward as BTC faced resistance around the $80,000 level and price volatility gradually narrowed, closing at approximately 37.0 on August 30, with the latest reading around 36.6. The roughly 14% weekly decline indicates a clear cooling of the options market's pricing for sharp short-term volatility.
The term structure has shifted from the previous short-end premium to a relatively normal upward-sloping shape: the ATM implied volatility for the 0–4 day tenor is approximately 33%–36%, around 34% for the September 25 expiry, and roughly 39% for the December 25 expiry. The near-term IV is no longer significantly higher than the long-term IV, indicating that the market has largely priced in the immediate risks stemming from month-end expiry and pullbacks from elevated levels, while a premium remains for long-term uncertainty.
Overall, the current BTC derivatives market is in a state of sideways consolidation at elevated price levels, declining open interest (OI), moderately negative skew, and falling DVOL. If prices continue to trade within a range, implied volatility could compress further; if there is a decisive breakout above $81,500 or a breakdown below $76,600, the low-volatility pricing regime may be disrupted.
5. Outlook for This Week
Sources:
Gate Research is a comprehensive blockchain and cryptocurrency research platform that provides deep content for readers, including technical analysis, market insights, industry research, trend forecasting, and macroeconomic policy analysis.
Disclaimer
Investing in cryptocurrency markets involves high risk. Users are advised to conduct their own research and fully understand the nature of the assets and products before making any investment decisions. Gate is not responsible for any losses or damages arising from such decisions.