The Crypto Fear & Greed Index is a market sentiment analysis tool specifically designed for cryptocurrency markets, aiming to quantify and visualize the overall emotional state of investors. Based on the concept of traditional financial market fear and greed indices, it aggregates various market factors to categorize market sentiment on a scale ranging from "Extreme Fear" to "Extreme Greed." This indicator helps investors understand whether the market is overly fearful (potentially a buying opportunity) or excessively excited (potentially a selling opportunity), providing reference for decision-making. As a complementary tool to technical analysis, the Fear & Greed Index reflects the importance of market psychology and reminds investors to maintain rational judgment in the highly volatile cryptocurrency market.
What are the key features of Crypto Fear & Greed Index?
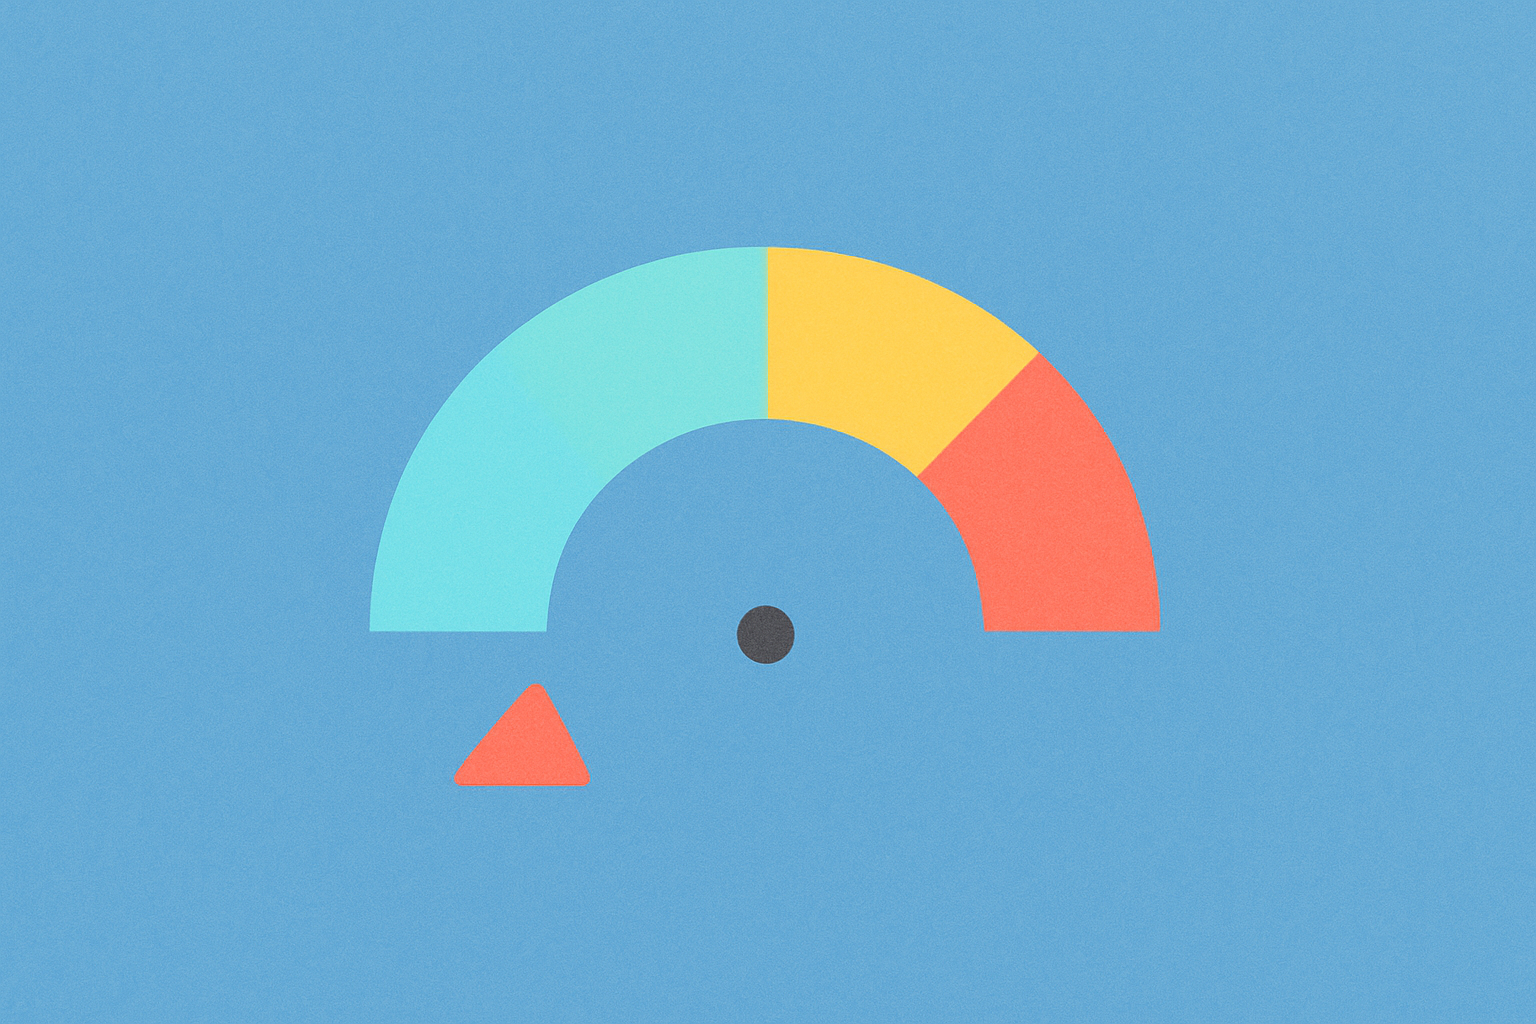
The Crypto Fear & Greed Index has the following key characteristics:
-
Scoring System: The index uses a 0-100 scoring system, where 0-24 represents "Extreme Fear," 25-49 represents "Fear," 50-74 represents "Greed," and 75-100 represents "Extreme Greed."
-
Calculation Factors:
- Market Volatility: The degree of price fluctuations
- Market Momentum/Volume: Trading activity and its relationship to price movements
- Social Media Sentiment: Discussion sentiment on platforms like Twitter and Reddit
- Survey Data: Regular polls of investor opinions
- Bitcoin Dominance: Bitcoin's market capitalization percentage in the entire cryptocurrency market
- Google Trends Data: Changes in search volume related to cryptocurrencies
-
Contrarian Indicator Nature: The index is based on the investment philosophy of "be fearful when others are greedy and greedy when others are fearful." When the index shows extreme fear, the market may be undervalued; when it shows extreme greed, the market may be in a bubble state.
-
Data Visualization: Typically displayed as a dashboard, using color coding (red for fear, green for greed) to intuitively express market sentiment.
-
Historical Comparison Function: Provides index changes over the past days, weeks, and months, facilitating analysis of market sentiment trends.
What is the market impact of Crypto Fear & Greed Index?
The Crypto Fear & Greed Index plays an important role in the market:
-
Sentiment Early Warning System: When the index reaches extreme values (0-10 or 90-100), it is often viewed as a signal that the market may be about to reverse, helping investors identify potential market tops or bottoms.
-
Trading Strategy Development: Many traders incorporate this index into their trading strategies, such as gradually buying in extreme fear zones and reducing positions in extreme greed zones.
-
Market Sentiment Feedback Loop: The index itself can influence market behavior. When many investors pay attention to and make decisions based on the index, it may reinforce existing market trends.
-
Institutional Investment Reference: Increasingly, institutional investors are also beginning to incorporate market sentiment indicators into their risk management frameworks as a complement to traditional technical analysis.
-
Educational Tool: Helps investors new to the crypto market understand market cycles and how sentiment fluctuations affect asset prices.
What are the risks and challenges of Crypto Fear & Greed Index?
Despite its value, the Crypto Fear & Greed Index faces several key challenges:
-
Lagging Indicator Issue: The index typically reflects market sentiment that has already occurred, rather than predicting future trends, potentially leading investors to make lagging decisions.
-
Data Collection Limitations:
- Social media data may be influenced by market manipulators or bot accounts
- Survey samples may not be sufficiently representative
- Unable to capture the true sentiment of over-the-counter trades or institutional investors
-
Insufficient Response to Sudden Events: Regulatory policy changes, security vulnerabilities, major hacking attacks, and other significant events can rapidly change market sentiment, while index updates may not be timely enough.
-
Risk of Over-reliance: Investors may overly depend on a single indicator while neglecting the importance of fundamental analysis, technical analysis, and risk management.
-
Applicability Issues: The index primarily reflects Bitcoin market sentiment, with limited applicability to small-cap cryptocurrencies or specific blockchain projects.
The importance of the Crypto Fear & Greed Index lies in providing a quantitative measurement standard for the highly emotional cryptocurrency market. The index helps investors detach from emotion-driven decisions and view market conditions more objectively. While it should not be seen as a predictive tool or sole basis for decisions, as part of an overall investment strategy, it can help investors stay calm when the market is extremely fearful and remain cautious when the market is overly excited. As the crypto market matures, the accuracy and effectiveness of such sentiment indicators may further improve, becoming standard tools for more investors and analysts.