Ripple (XRP) is maintaining a stable level around the opening price of $1.45 as of Saturday. The movement of this transfer token generally mirrors the overall cryptocurrency market, which has been under downward pressure since Tuesday due to geopolitical tensions in the Middle East, along with cautious investor sentiment regarding the Federal Reserve’s hawkish stance on the outlook for interest rate cuts in 2026.
Both institutional and retail investors are trending toward withdrawing funds, reflected in the weakening of the derivatives market. Meanwhile, selling pressure may be increasing as XRP transfers to exchanges rise, indicating many holders are preparing to take profits or cut losses.
In the short term, a solid rebound toward $1.50 could reinforce the initial bullish signal. Conversely, if the price continues to weaken and breaks below the key support level of $1.40, the overall downtrend is likely to be reaffirmed.
XRP Under Pressure as Capital Flows Out
Retail demand for XRP derivatives has shown signs of stagnation in recent days, evidenced by open interest (OI) in futures contracts decreasing to $2.56 billion on Saturday from $2.67 billion the day before.
According to data from CoinGlass, OI peaked at $2.87 billion during the week, up sharply from $2.11 billion in March. This increase coincided with XRP breaking above $1.61 on Tuesday before being restrained by unfavorable market factors.
To sustain an upward trend, the derivatives market needs to continue expanding steadily. Conversely, a prolonged decline in OI often signals waning confidence in the token’s recovery potential.
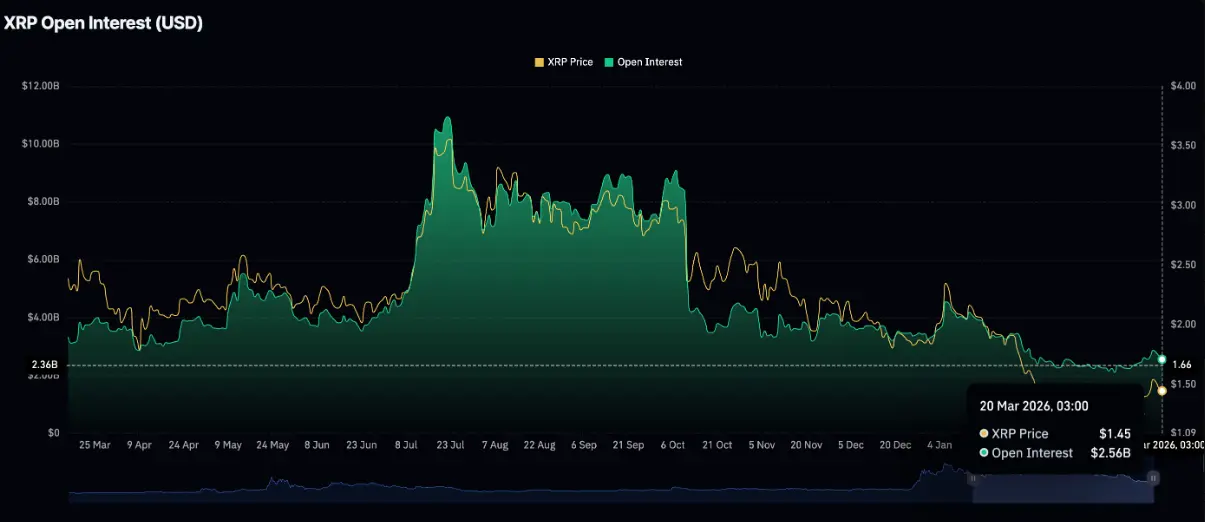 XRP Futures OI | Source: CoinGlass
In another development, activity in spot XRP ETF funds has remained quite subdued over the past two days, with capital flows recorded at zero according to SoSoValue data. The total accumulated funds remain at $1.21 billion, while the average assets under management (AUM) are around $1.02 billion. The lack of new institutional money somewhat dampens market sentiment, potentially prolonging the price recovery process.
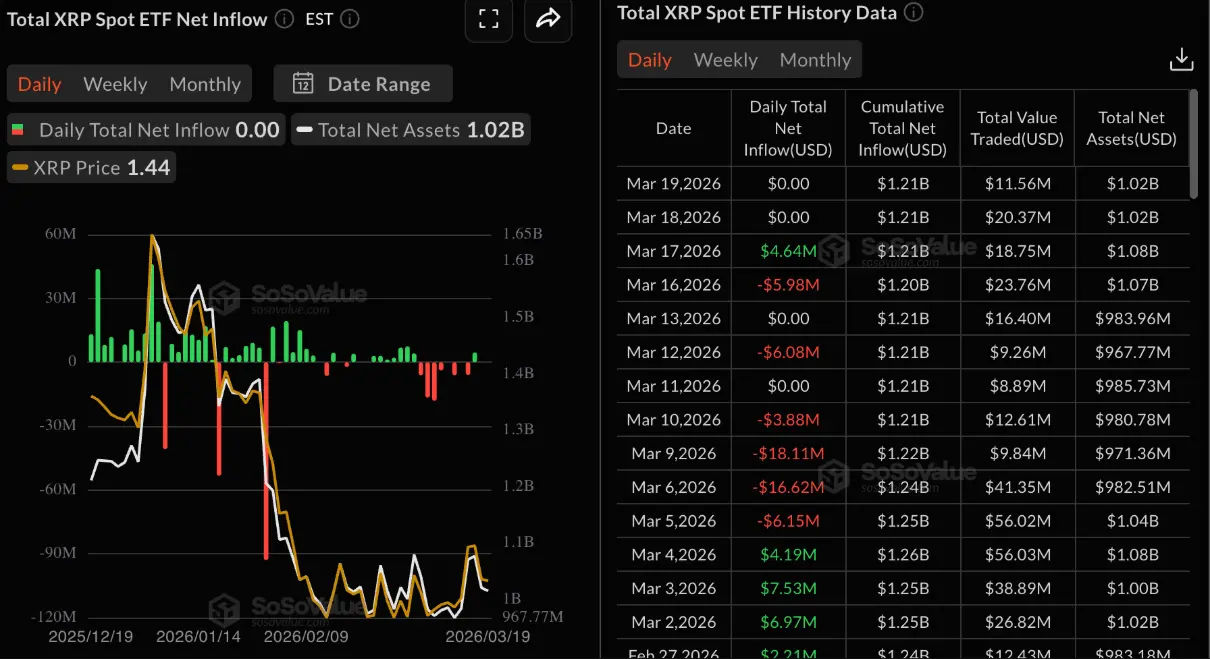 XRP ETF Capital Flows | Source: SoSoValue
At the same time, the trend of XRP moving onto exchanges is increasing, creating significant pressure on short- and medium-term bullish prospects. The amount of XRP on exchanges exceeded 2.8 billion tokens as of Thursday, up from 2.74 billion on March 1.
Previously, XRP holdings on exchanges hovered around an average of 2.55 billion in February, the lowest since the start of the year. An increase in tokens on exchanges generally indicates a larger supply ready to sell, exerting downward pressure on prices and reflecting growing investor caution about the sustainability of XRP’s recovery.
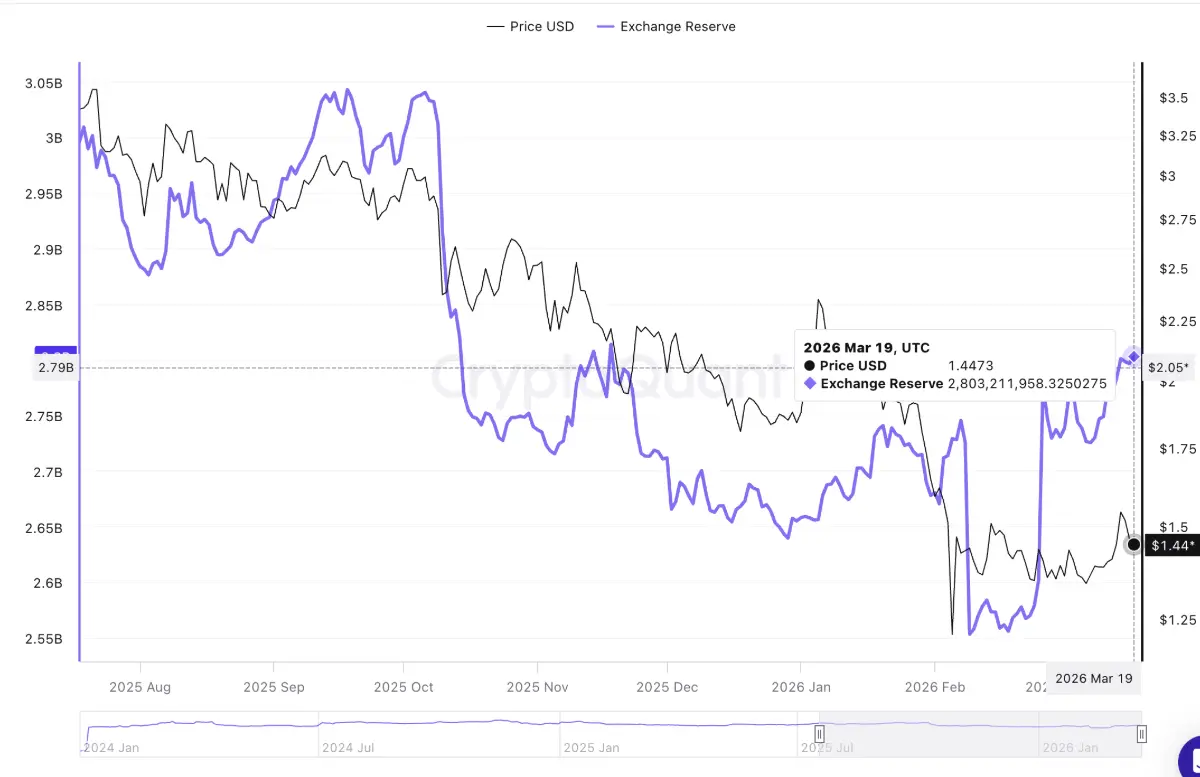 XRP Reserves on Exchanges | Source: CryptoQuant
Technical Analysis: XRP Holds Support but Rebound Momentum Is Weak
XRP is currently trading around $1.45, slightly higher than the opening level. After bouncing from a low of $1.42 on Thursday, the short-term trend has stabilized somewhat and leans toward bullishness. However, the recovery faces resistance as the price remains below the downward trendline formed since July.
Notably, XRP continues to trade below the 50-, 100-, and 200-day exponential moving averages (EMA) in the $1.50–$1.95 range, indicating the dominant trend remains bearish despite recent technical rebounds.
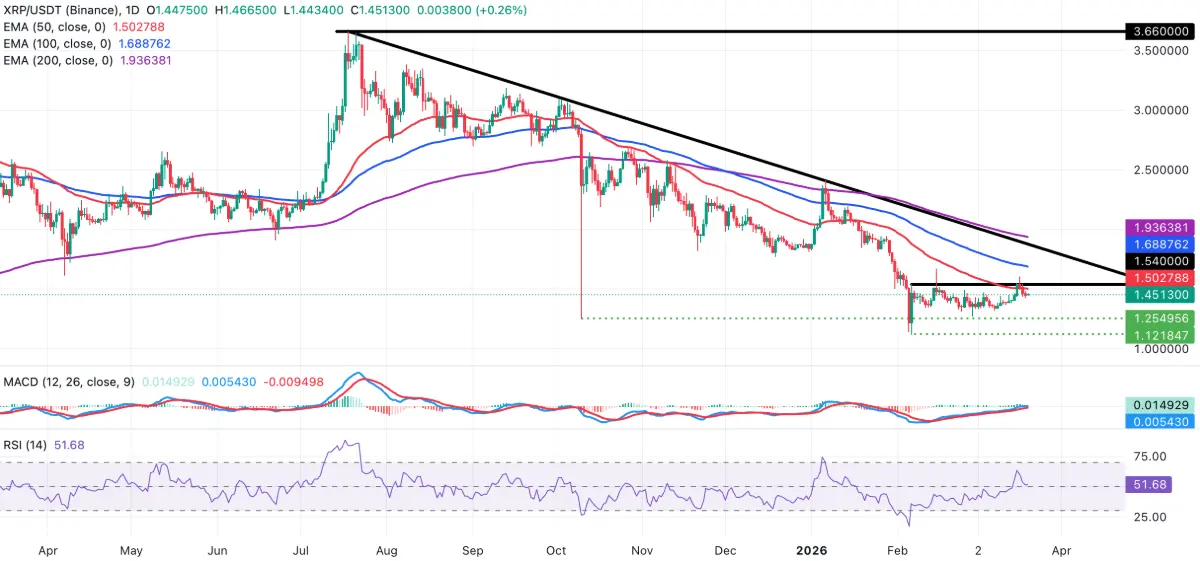 Daily XRP/USDT Chart | Source: TradingView
From an indicator perspective, the MACD remains above zero and above its signal line on the daily timeframe, while the histogram is gradually narrowing. The RSI is stable around 52, reflecting weakening selling pressure and emerging buying interest in the short term.
The nearest support zone is around the reaction low of $1.42, followed by the $1.40 area, which previously saw significant buying interest. If these levels are broken, the price could revert to a deeper downtrend aligned with the main trend.
On the upside, the 50-day EMA at $1.50 acts as the first resistance. A convincing break above this level could target the weekly high at $1.61, before moving toward the 100-day EMA around $1.69.
Disclaimer: The information on this page may come from third parties and does not represent the views or opinions of Gate. The content displayed on this page is for reference only and does not constitute any financial, investment, or legal advice. Gate does not guarantee the accuracy or completeness of the information and shall not be liable for any losses arising from the use of this information. Virtual asset investments carry high risks and are subject to significant price volatility. You may lose all of your invested principal. Please fully understand the relevant risks and make prudent decisions based on your own financial situation and risk tolerance. For details, please refer to
Disclaimer.
