The last trading week of March 2026 is bringing meme coins back into the spotlight. Amid the overall market correction, some tokens are forming distinct technical structures, opening up scenarios for notable volatility.
Coinphoton has selected three prominent meme coins that investors should pay close attention to in the final phase of the month.
Siren (SIREN)
Siren (SIREN) is currently trading around $1.02, down sharply 60% after a breakout increase of 163% within just two days from the March 21 bottom. However, the all-time high at $4.72 remains about 90% higher than the current price and is also a target confirmed by the “price target” pattern on the chart.
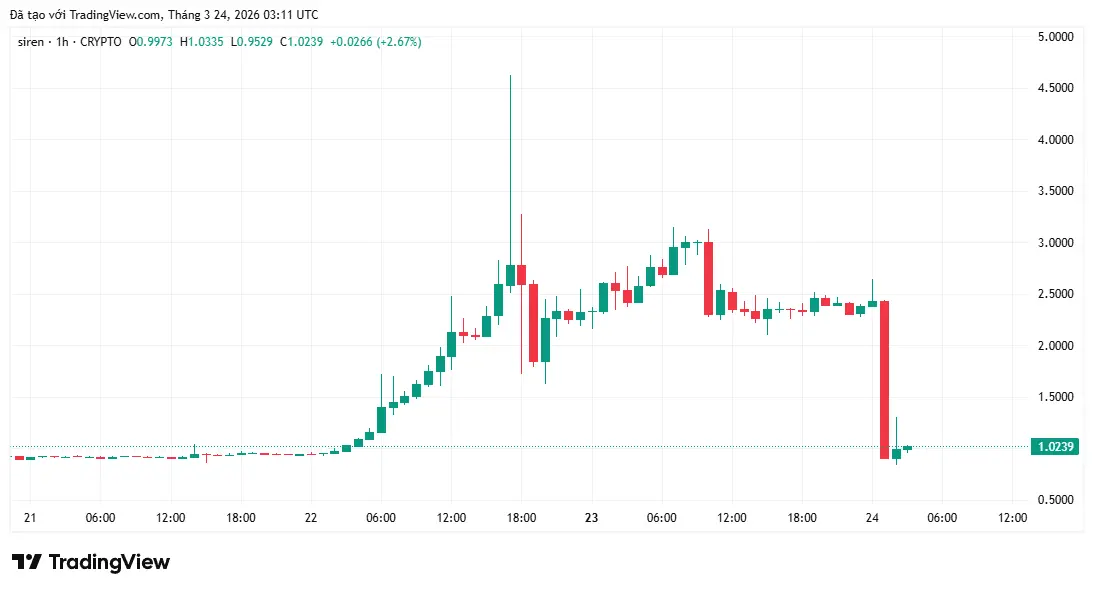 SIREN Price Analysis | Source: TradingView
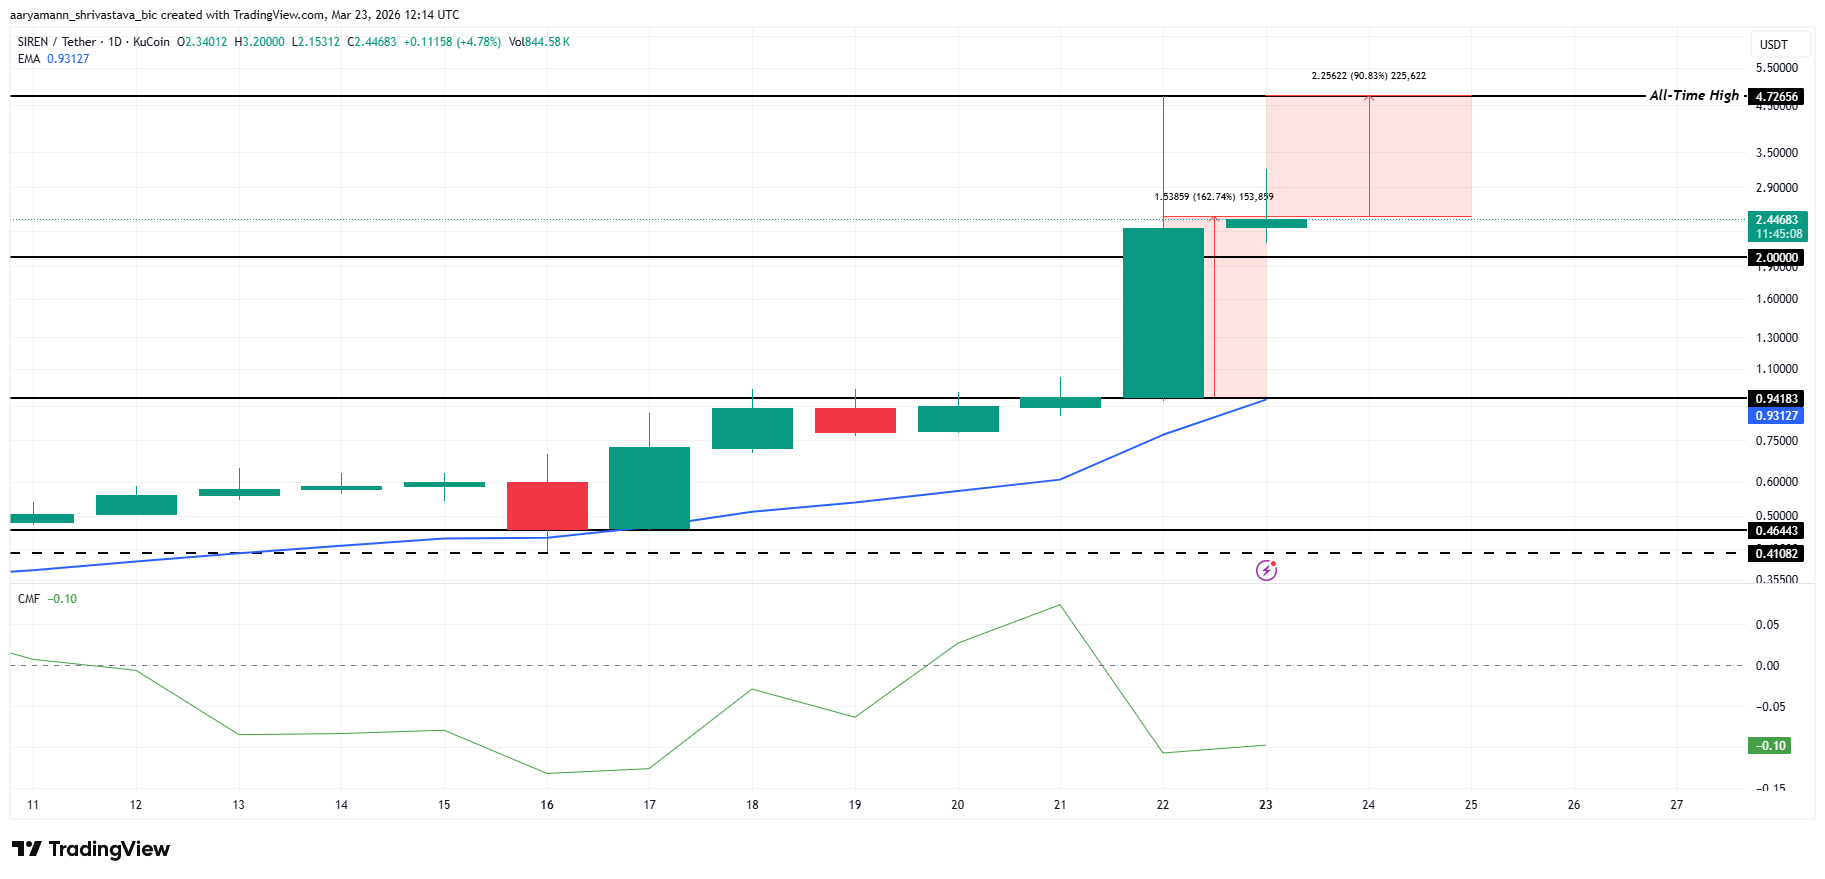
The negative CMF indicator remains at -0.10 and has been in the negative zone since March 20, despite the strong price rally. The price setting new highs while money flow does not confirm creates a clear negative divergence — a core element of the current structure.
SIREN Price Analysis | Source: TradingView
The negative CMF indicator remains at -0.10 and has been in the negative zone since March 20, despite the strong price rally. The price setting new highs while money flow does not confirm creates a clear negative divergence — a core element of the current structure.
The negative CMF amid a steep price rise indicates selling pressure is dominant, as sellers take advantage of the rally to exit. Volume does not confirm the upward trend, making the price range from March 22–25 a high-risk zone. In a reversal scenario, the $2.00 level and the EMA at $0.93 will serve as key support levels.
Memecore (M)
Memecore (M) is trading at $1.711, up slightly by 1.57%, and is in an accumulation phase just below the Fibonacci 0.786 level ($1.852) — the peak of the “price target” zone formed after the breakout on March 18. The price has regained above the EMA at $1.613, establishing a dynamic support zone in an uptrend.
The MFI indicator is at 58.67, maintaining a neutral stance but trending upward, indicating buying momentum is improving without entering overbought territory. This suggests room for further upside before signs of weakening appear.
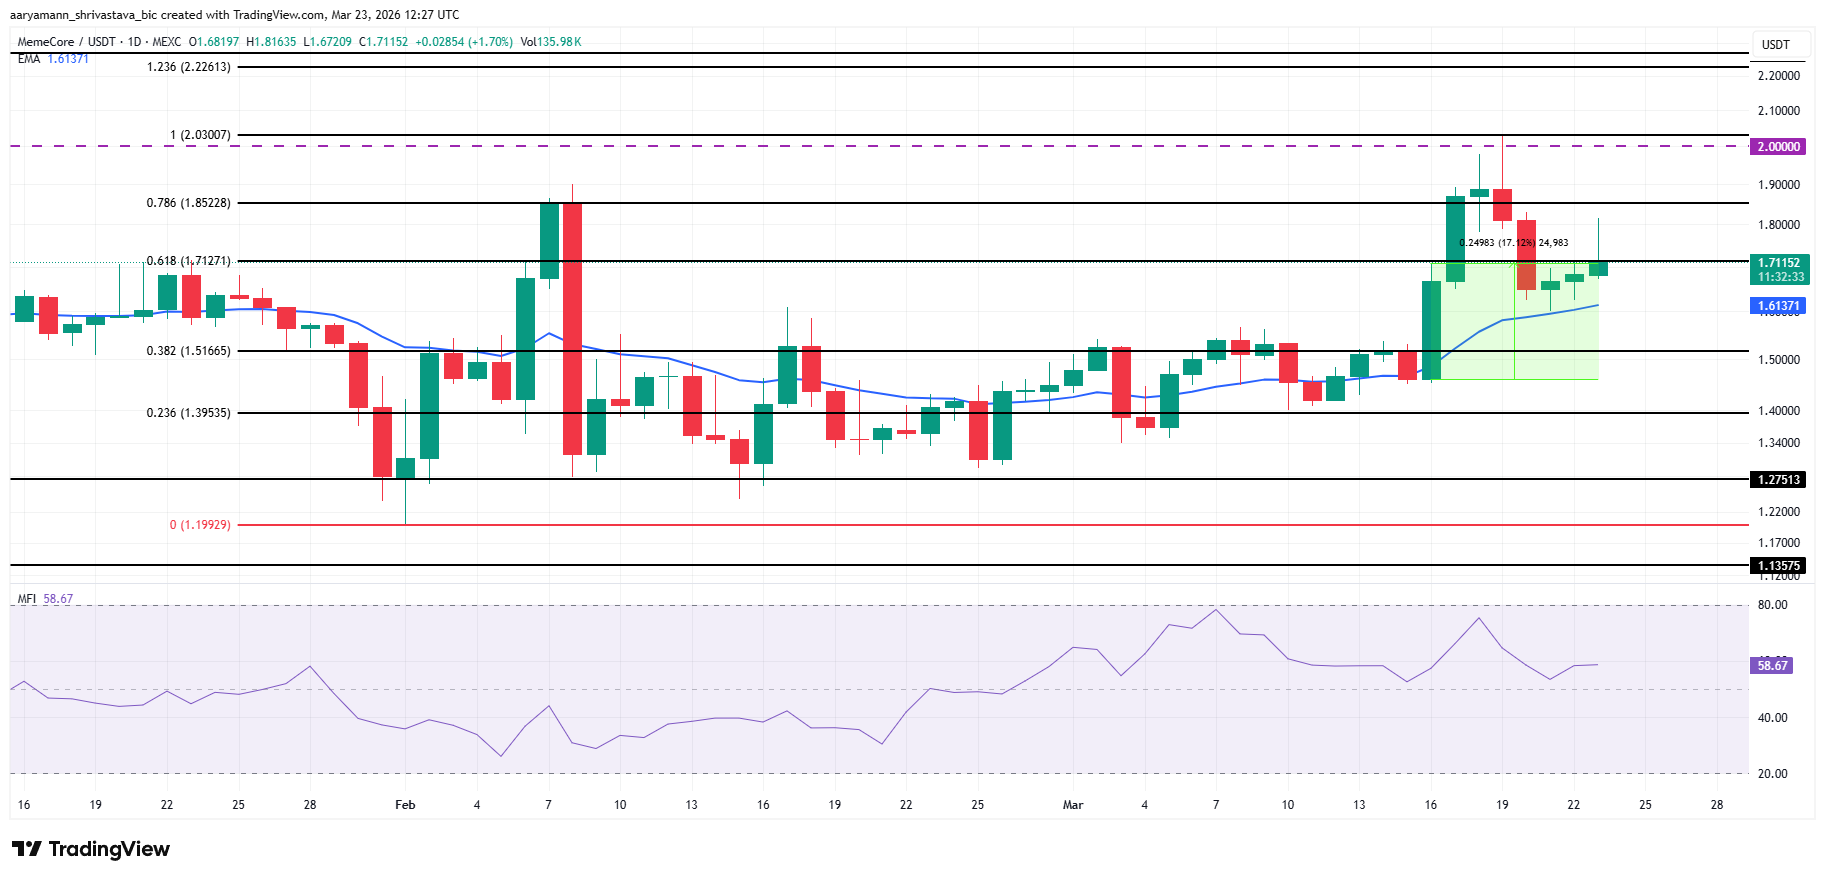 Memecore Price Analysis | Source: TradingView
A short-term key level is a daily close above $1.712. Once confirmed, the price will break through the 0.618 level and open extended Fibonacci targets at $2.030 (1.0) and $2.226 (1.236). Conversely, the $1.613 EMA is the trend-defining boundary; if broken, the risk of correction toward the $1.516 zone increases.
Memecore Price Analysis | Source: TradingView
A short-term key level is a daily close above $1.712. Once confirmed, the price will break through the 0.618 level and open extended Fibonacci targets at $2.030 (1.0) and $2.226 (1.236). Conversely, the $1.613 EMA is the trend-defining boundary; if broken, the risk of correction toward the $1.516 zone increases.
OFFICIAL TRUMP (TRUMP)
Official Trump (TRUMP) is currently trading at $3.254, up 1.88%. However, the OBV indicator peaked between March 13–14 and has since declined from around -$120 million to -$148.96 million. The weakening OBV while the price recovers short-term is a typical sign of distribution rather than accumulation.
The initial decline, following the “price target” pattern (-21.15%) from the March 13 peak, has completed, pulling the price from $4.04 down to the Fibonacci 0.382 level at $3.39. Currently, another decline (-15.23%) is forming, with a target toward $2.705 — the historical bottom.
 SIREN Price Analysis | Source: TradingView
Notably, the EMA at $3.397 acts as resistance when above the current price. To break the current downtrend, TRUMP needs to surpass the EMA and confirm a daily close above $3.39. Otherwise, the OBV trend combined with the “price target” structure continues to support the scenario of setting a new bottom before the month ends.
SIREN Price Analysis | Source: TradingView
Notably, the EMA at $3.397 acts as resistance when above the current price. To break the current downtrend, TRUMP needs to surpass the EMA and confirm a daily close above $3.39. Otherwise, the OBV trend combined with the “price target” structure continues to support the scenario of setting a new bottom before the month ends.
Disclaimer: The information on this page may come from third parties and does not represent the views or opinions of Gate. The content displayed on this page is for reference only and does not constitute any financial, investment, or legal advice. Gate does not guarantee the accuracy or completeness of the information and shall not be liable for any losses arising from the use of this information. Virtual asset investments carry high risks and are subject to significant price volatility. You may lose all of your invested principal. Please fully understand the relevant risks and make prudent decisions based on your own financial situation and risk tolerance. For details, please refer to
Disclaimer.
