


BTC Technical Outlook: Breakdown From Local Range, Retesting Macro Demand
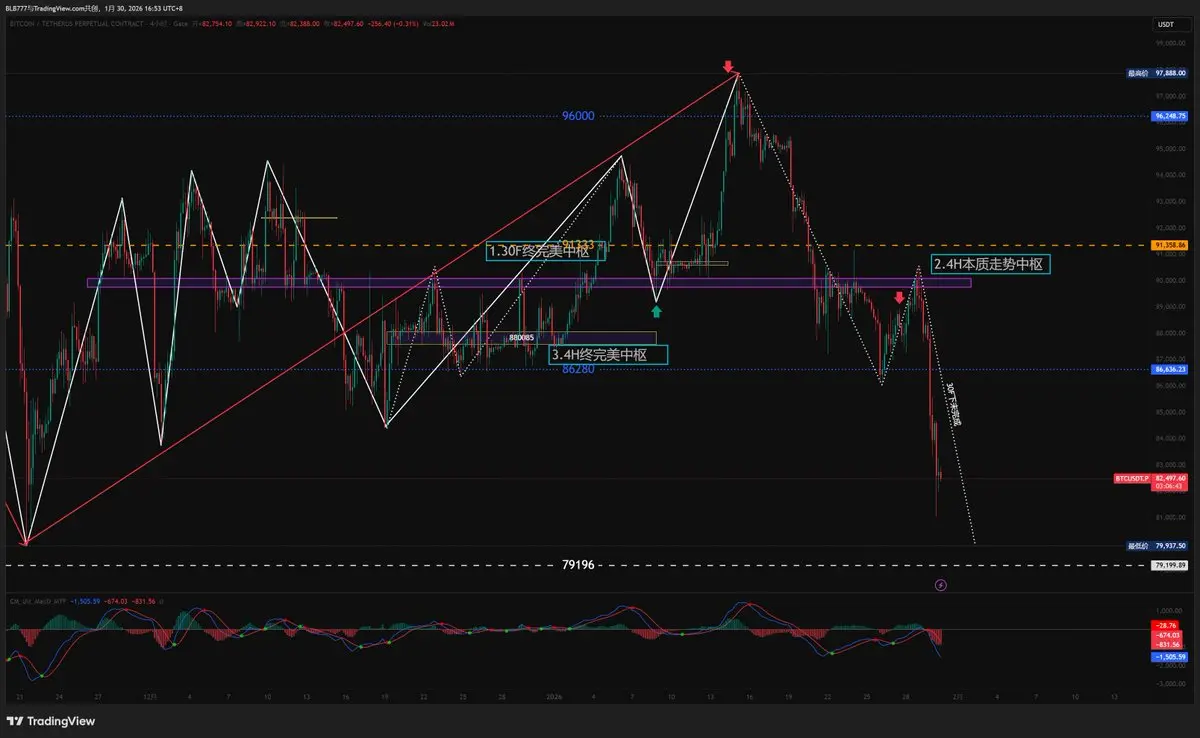
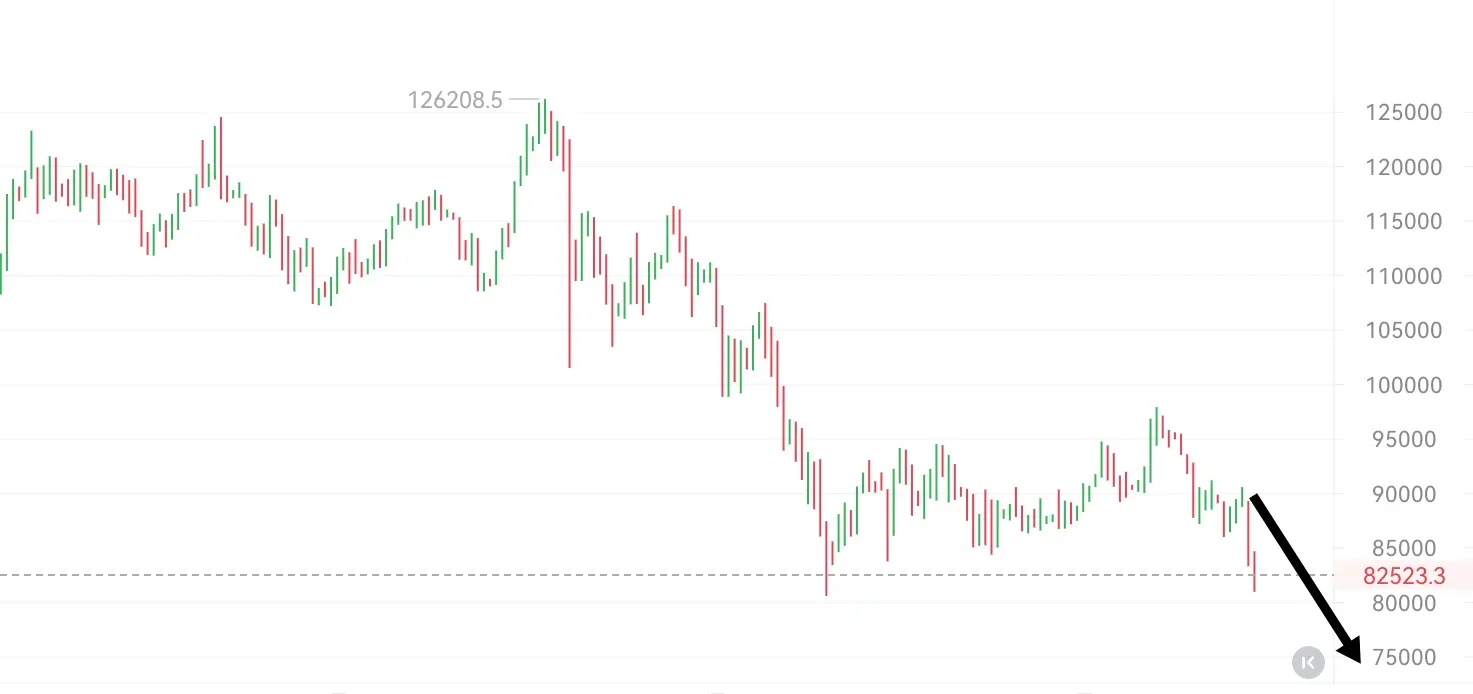
Bitcoin remains within a broader corrective structure after the rejection from the $108K–$116K macro supply zone (0.618–0.786 Fib). That rejection marked a distribution top, followed by a strong bearish continuation into late Q4.
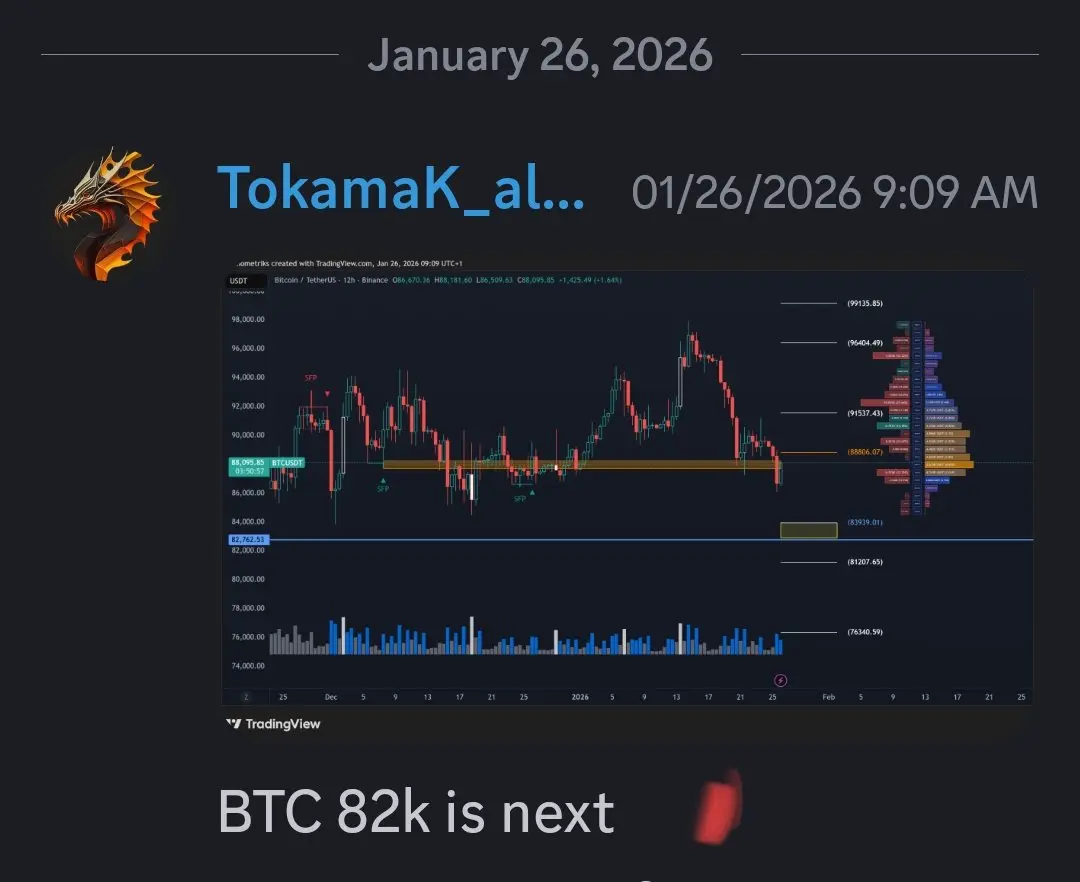
Recent price action shows BTC losing the $88K–$90K range base and now moving lower into the $83K–$80K macro demand zone, where buyers previously stepped in aggressively. Momentum has weakened again, and the higher-timeframe trend remains bearish.
EMA Structure (Bearish Bias, Breakdown Phase)
20 EMA: $89,173
50 EMA: $90,745
100 EMA: $94,295
200 EMA: $98,158
BTC is trading below all major EMAs, confirming bearish medium- and long-term structure. The failed reclaim of the 0.236 Fib + EMA zone (~$91K–$92K) triggered renewed downside pressure.
The $94K–$98K zone remains a major dynamic resistance band.
Fibonacci & Price Structure
1 Fib: $126,123
0.786 Fib: $116,399
0.618 Fib: $108,766
0.5 Fib: $103,405
0.382 Fib: $98,043
0.236 Fib: $91,410
Fib 0: $80,687
BTC has now lost the 0.236 Fib ($91,410) and is moving toward the Fib 0 macro base ($80,687). This keeps price in a corrective continuation phase, not a recovery structure.
A reclaim of $91K–$94K is required to re-enter the prior rrange.
Structural Context
The rounded accumulation attempt near $88K failed, leading to a range breakdown. Current structure suggests price is seeking liquidity inside the $83K–$80K demand block, which aligns with the Fib 0 level and historical support.
Only a decisive daily close back above $91K–$94K would shift structure away from bearish continuation.
RSI Momentum
RSI (14): 31–44
RSI has slipped back toward the lower zone, reflecting renewed bearish momentum and a lack of strong bullish participation. This supports continuation risk before any sustainable bounce.
📊 Key Levels
Resistance
• $91K–$94K (0.236 Fib / EMA zone)
• $98K (0.382 Fib)
• $103K (0.5 Fib)
Support
• $83K–$82K (local demand)
• $80.7K (Fib 0 / macro demand)
• $76K–$75K (last HTF support below)
📌 Summary
BTC has failed to hold the $88K–$90K base and is now rotating into the $83K–$80K macro demand zone. While this area may attract buyers for a technical bounce, the broader structure remains bearish and corrective unless BTC can reclaim $91K–$94K with strength. Until then, downside risk and range expansion remain active.
$BTC
Bitcoin remains within a broader corrective structure after the rejection from the $108K–$116K macro supply zone (0.618–0.786 Fib). That rejection marked a distribution top, followed by a strong bearish continuation into late Q4.
Recent price action shows BTC losing the $88K–$90K range base and now moving lower into the $83K–$80K macro demand zone, where buyers previously stepped in aggressively. Momentum has weakened again, and the higher-timeframe trend remains bearish.
EMA Structure (Bearish Bias, Breakdown Phase)
20 EMA: $89,173
50 EMA: $90,745
100 EMA: $94,295
200 EMA: $98,158
BTC is trading below all major EMAs, confirming bearish medium- and long-term structure. The failed reclaim of the 0.236 Fib + EMA zone (~$91K–$92K) triggered renewed downside pressure.
The $94K–$98K zone remains a major dynamic resistance band.
Fibonacci & Price Structure
1 Fib: $126,123
0.786 Fib: $116,399
0.618 Fib: $108,766
0.5 Fib: $103,405
0.382 Fib: $98,043
0.236 Fib: $91,410
Fib 0: $80,687
BTC has now lost the 0.236 Fib ($91,410) and is moving toward the Fib 0 macro base ($80,687). This keeps price in a corrective continuation phase, not a recovery structure.
A reclaim of $91K–$94K is required to re-enter the prior rrange.
Structural Context
The rounded accumulation attempt near $88K failed, leading to a range breakdown. Current structure suggests price is seeking liquidity inside the $83K–$80K demand block, which aligns with the Fib 0 level and historical support.
Only a decisive daily close back above $91K–$94K would shift structure away from bearish continuation.
RSI Momentum
RSI (14): 31–44
RSI has slipped back toward the lower zone, reflecting renewed bearish momentum and a lack of strong bullish participation. This supports continuation risk before any sustainable bounce.
📊 Key Levels
Resistance
• $91K–$94K (0.236 Fib / EMA zone)
• $98K (0.382 Fib)
• $103K (0.5 Fib)
Support
• $83K–$82K (local demand)
• $80.7K (Fib 0 / macro demand)
• $76K–$75K (last HTF support below)
📌 Summary
BTC has failed to hold the $88K–$90K base and is now rotating into the $83K–$80K macro demand zone. While this area may attract buyers for a technical bounce, the broader structure remains bearish and corrective unless BTC can reclaim $91K–$94K with strength. Until then, downside risk and range expansion remain active.
$BTC