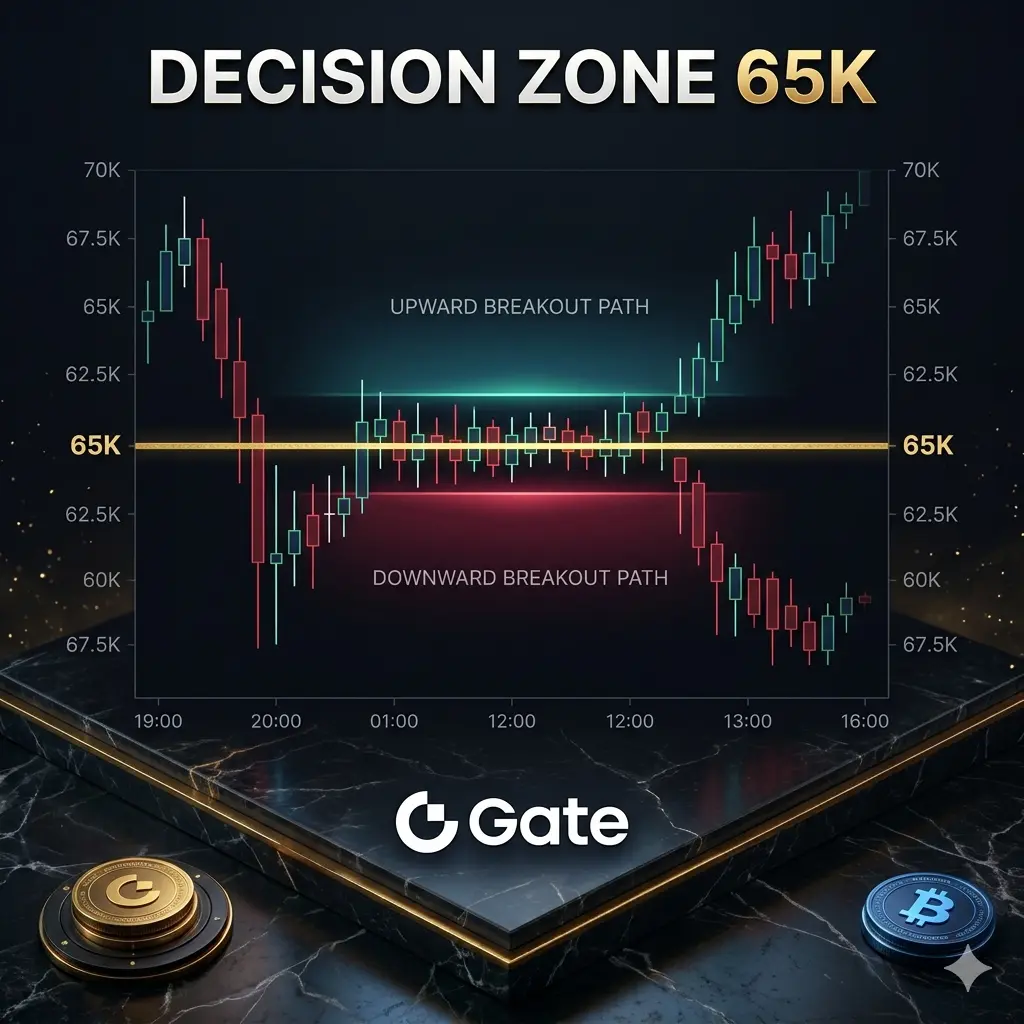

#CanBTCHold65K? 🚨 $65,000 Last Line of Defense? Critical Week for BTC
#GateSquare #TradingAnalysis #CryptoTrading #RiskManagement
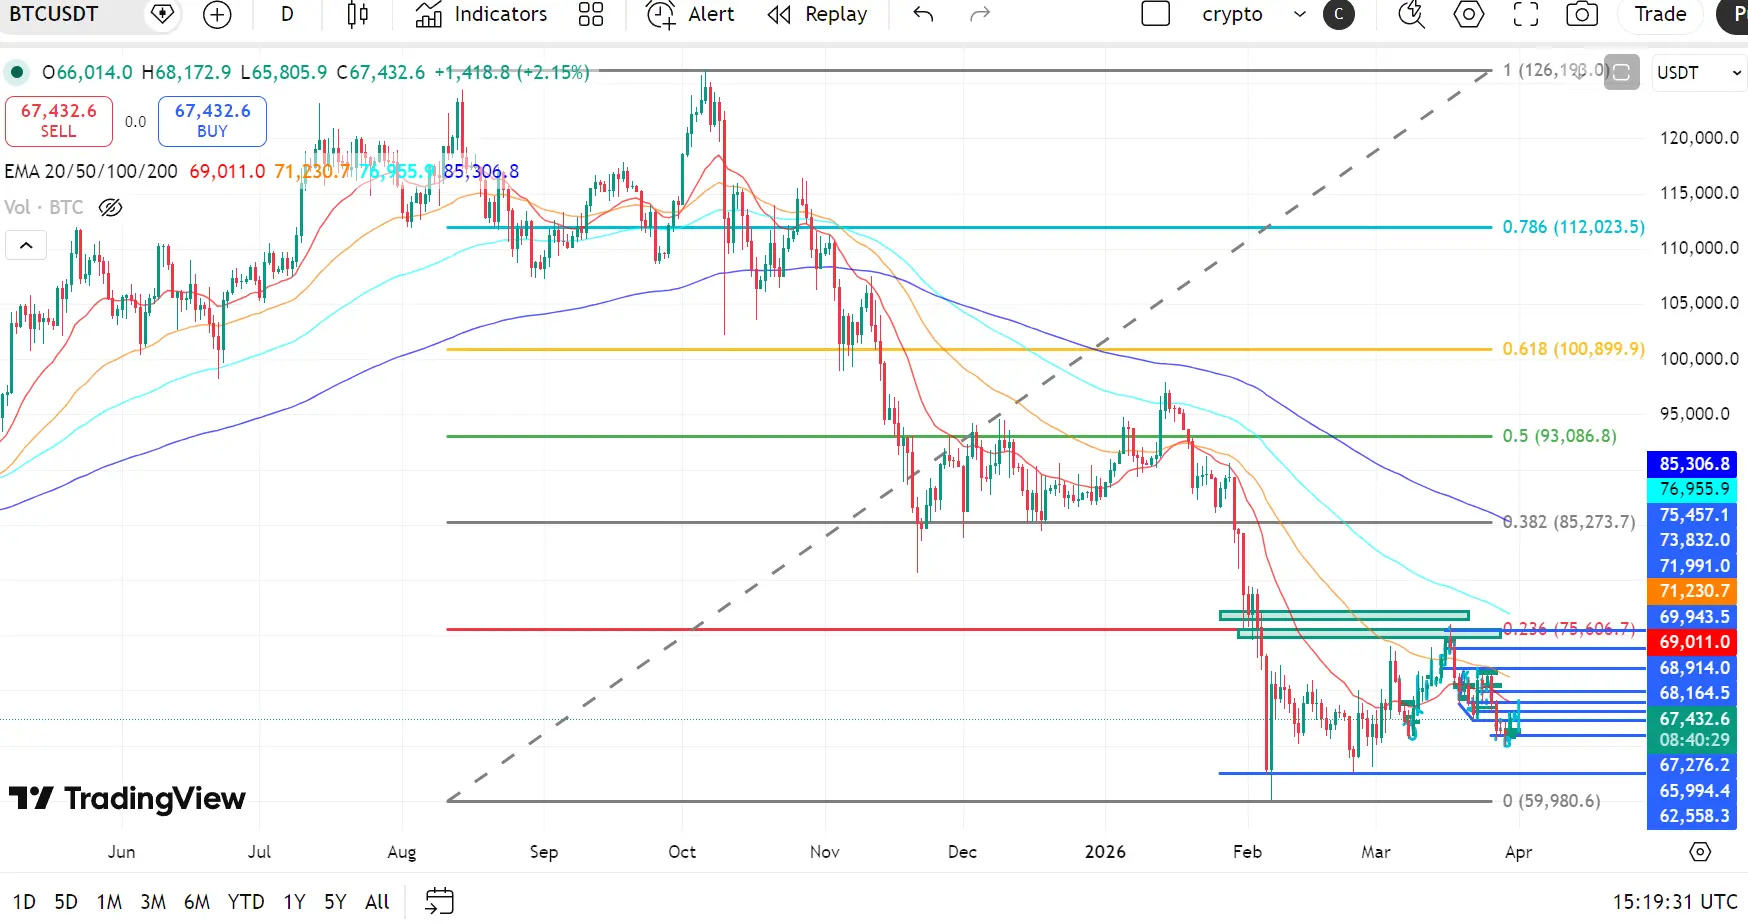
Bitcoin dropped to $65,000 this morning and is now trading around $67,436. The market’s short summary:
“It hasn’t crashed yet, but no decision has been made.”
This week is different — multiple major factors are converging at the same time.
Why the Middle East Crisis Matters for BTC
Yemen Houthi missile attacks are intensifying the conflict, sending Brent crude to $116.75 (+59% MoM).
Mechanism: Oil ↑ → Inflation pressure ↑ → Interest rate expectations ↑ → Risk assets exit → BTC under pressure.
U.S. statements on Iran oil show the conflict won’t end quickly → ongoing uncertainty supports oil and keeps BTC pressured.
Bottom line: BTC is behaving more like equities than digital gold.
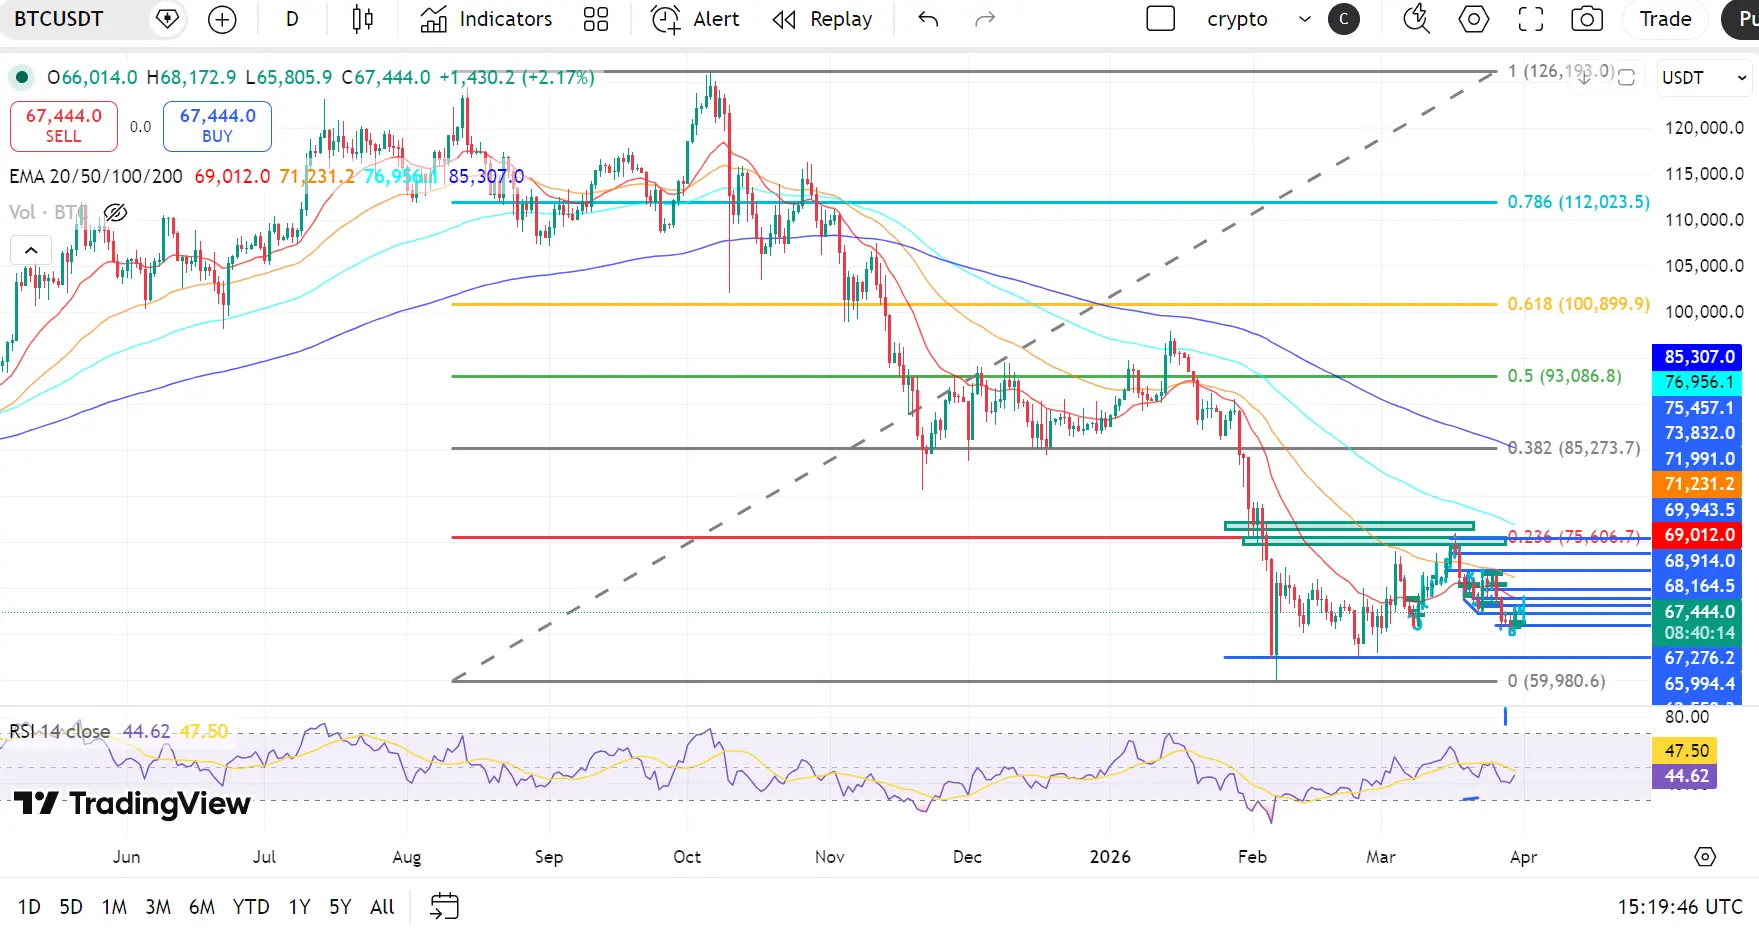
Technical Snapshot: Conflicting Signals
Weakness signs:
Daily MA7 < MA30 < MA120 → classic downtrend
MACD shows peak divergence
4h CCI and WR in overbought
Recovery signs:
Daily CCI entered oversold
15m & 4h SAR still below price
Morning volume increased → buyers returned
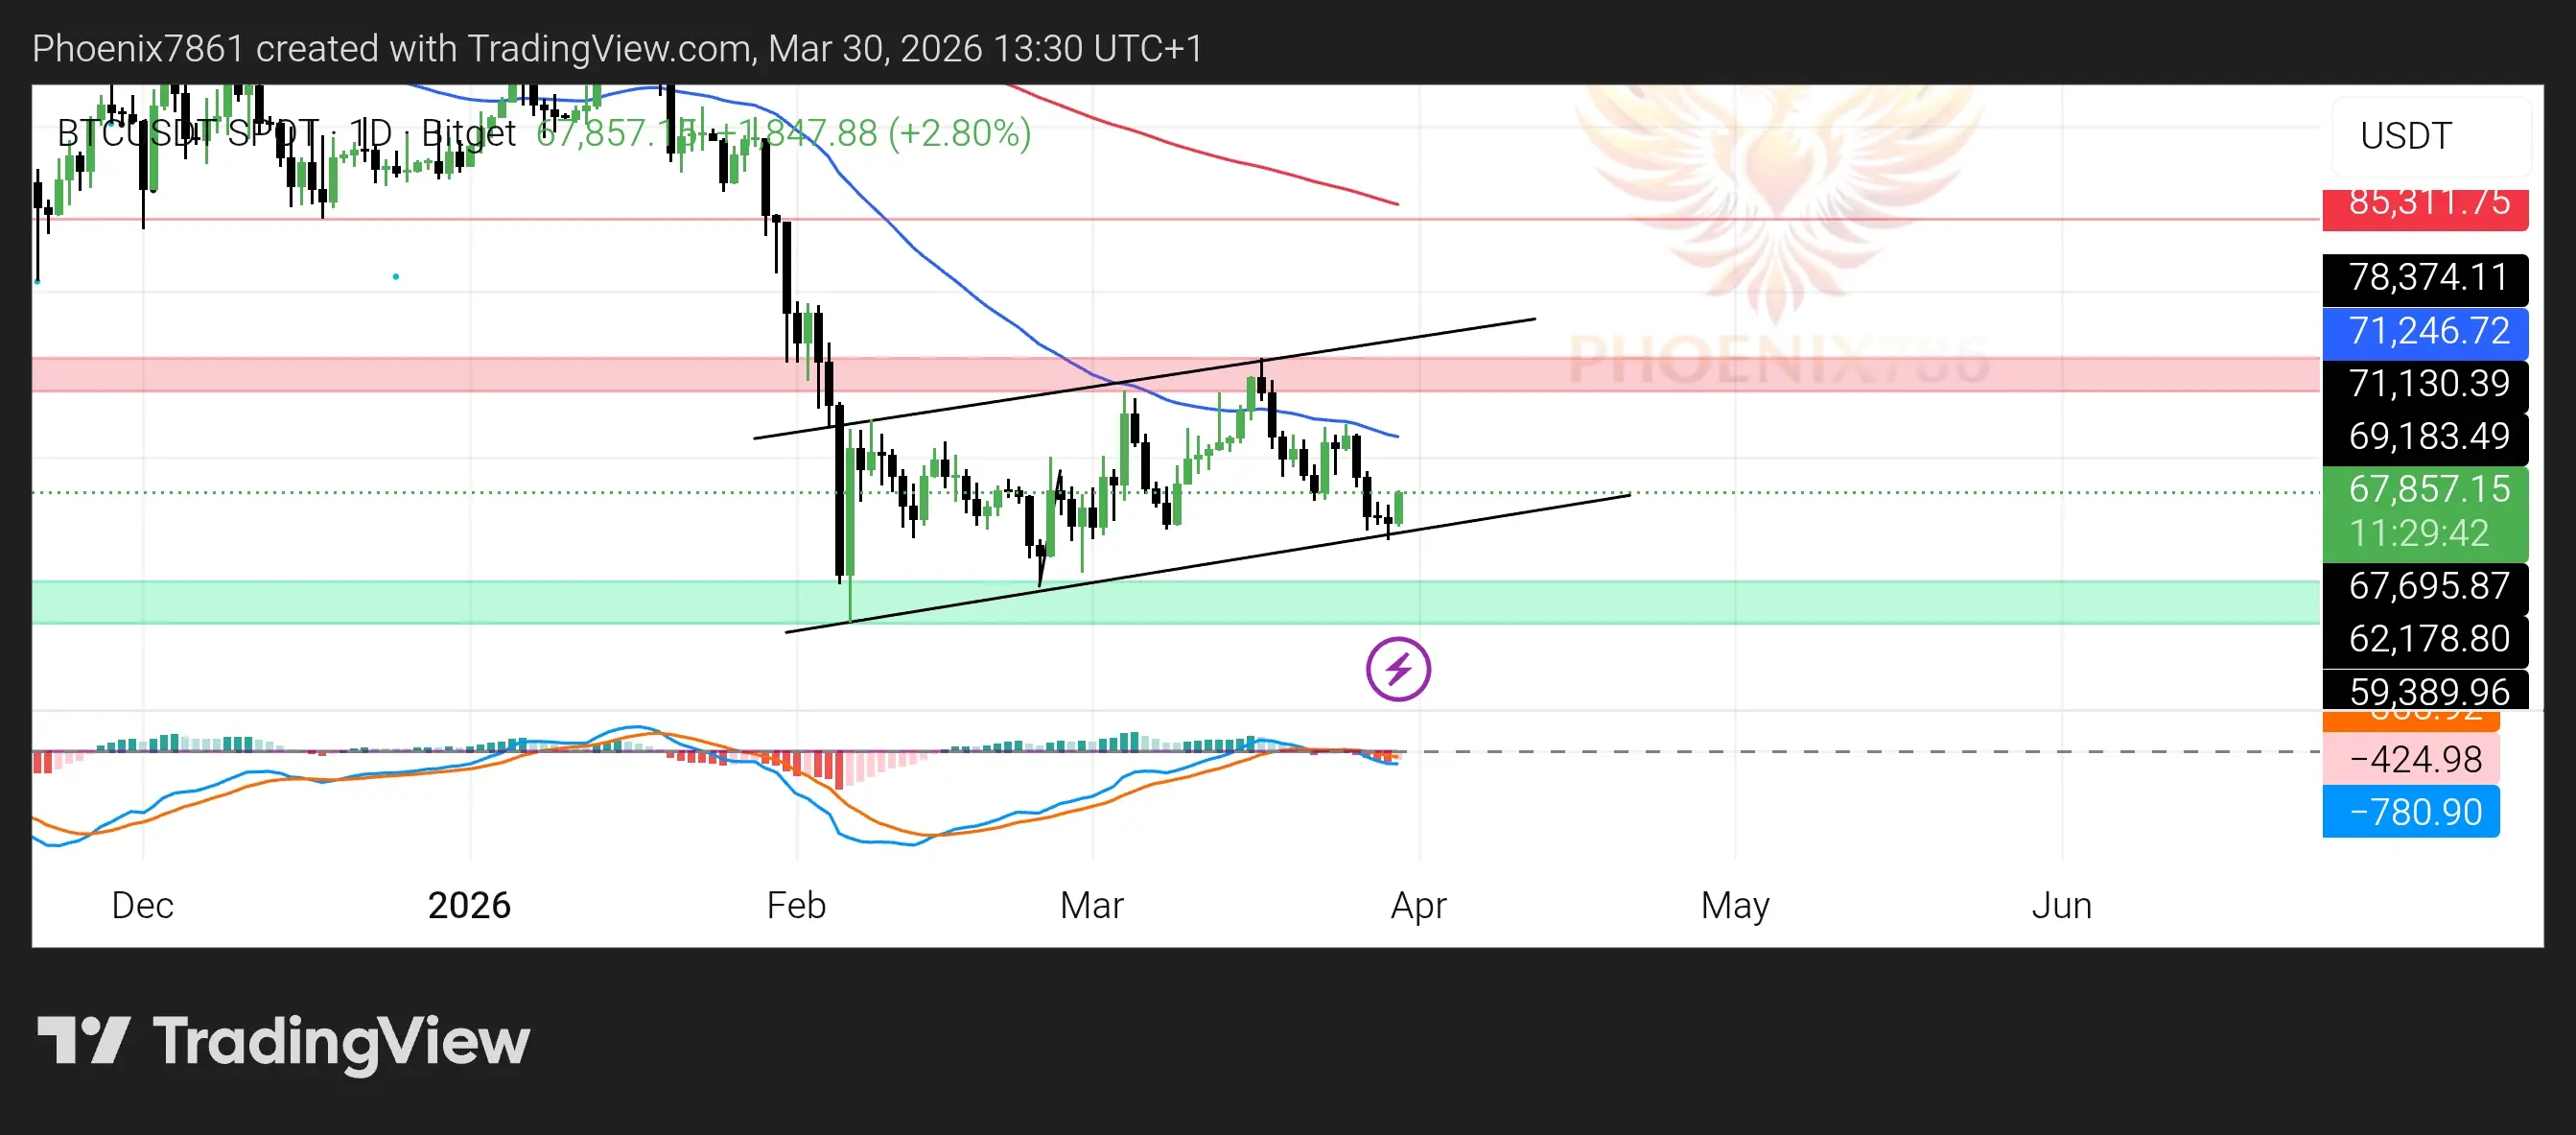
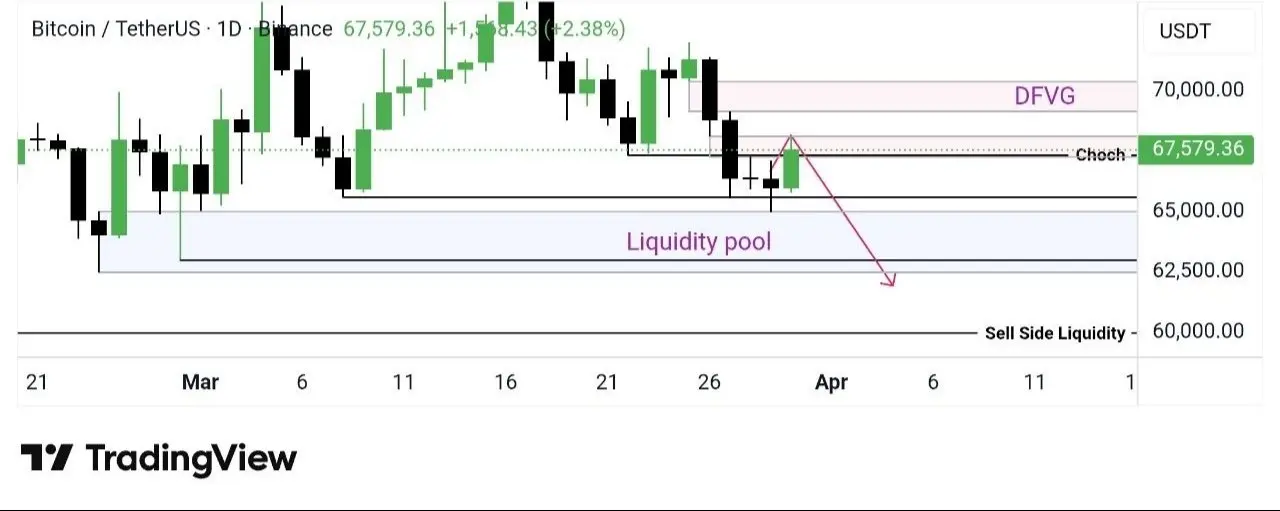
Key levels:
$65,000 support tested and held
Resistance: $68,000 – $72,000; $72,000 break could open path to $80,000 target
Institutional Buying Supports the Base
Strategy bought +1,031 BTC in March (total 762,099 BTC, avg cost $75,694)
Morgan Stanley announced low-fee spot BTC ETF
Coinbase + Fannie Mae launched crypto-collateral mortgages
Message: Institutions are buying, not selling at lows. Long-term base is strong.
Crude Oil Strategy
Bull scenario: Ongoing Houthi attacks, Strait of Hormuz pressure, no U.S.-Iran deal → Brent $120+
Bear scenario: Ceasefire or negotiations → Brent $80-$90
Risk management: Scale entries instead of one large directional bet. Monitor XAUUSD or crude oil on Gate TradFi.
My Thesis: Cautious Bull
Stay bullish while $65,000 holds
Stop-loss below $65,000
$80,000 target requires a sustained break of $72,000
Discussion Questions (CTA)
Will $65,000 support hold, or is it just a temporary pause?
Next major move: $60,000 or $80,000?
Will oil continue to pressure BTC, or will BTC emerge as a safe haven?
Share your thoughts below — let’s discuss!
$BTC $ETH $SOL
#GateSquare #TradingAnalysis #CryptoTrading #RiskManagement
Bitcoin dropped to $65,000 this morning and is now trading around $67,436. The market’s short summary:
“It hasn’t crashed yet, but no decision has been made.”
This week is different — multiple major factors are converging at the same time.
Why the Middle East Crisis Matters for BTC
Yemen Houthi missile attacks are intensifying the conflict, sending Brent crude to $116.75 (+59% MoM).
Mechanism: Oil ↑ → Inflation pressure ↑ → Interest rate expectations ↑ → Risk assets exit → BTC under pressure.
U.S. statements on Iran oil show the conflict won’t end quickly → ongoing uncertainty supports oil and keeps BTC pressured.
Bottom line: BTC is behaving more like equities than digital gold.
Technical Snapshot: Conflicting Signals
Weakness signs:
Daily MA7 < MA30 < MA120 → classic downtrend
MACD shows peak divergence
4h CCI and WR in overbought
Recovery signs:
Daily CCI entered oversold
15m & 4h SAR still below price
Morning volume increased → buyers returned
Key levels:
$65,000 support tested and held
Resistance: $68,000 – $72,000; $72,000 break could open path to $80,000 target
Institutional Buying Supports the Base
Strategy bought +1,031 BTC in March (total 762,099 BTC, avg cost $75,694)
Morgan Stanley announced low-fee spot BTC ETF
Coinbase + Fannie Mae launched crypto-collateral mortgages
Message: Institutions are buying, not selling at lows. Long-term base is strong.
Crude Oil Strategy
Bull scenario: Ongoing Houthi attacks, Strait of Hormuz pressure, no U.S.-Iran deal → Brent $120+
Bear scenario: Ceasefire or negotiations → Brent $80-$90
Risk management: Scale entries instead of one large directional bet. Monitor XAUUSD or crude oil on Gate TradFi.
My Thesis: Cautious Bull
Stay bullish while $65,000 holds
Stop-loss below $65,000
$80,000 target requires a sustained break of $72,000
Discussion Questions (CTA)
Will $65,000 support hold, or is it just a temporary pause?
Next major move: $60,000 or $80,000?
Will oil continue to pressure BTC, or will BTC emerge as a safe haven?
Share your thoughts below — let’s discuss!
$BTC $ETH $SOL