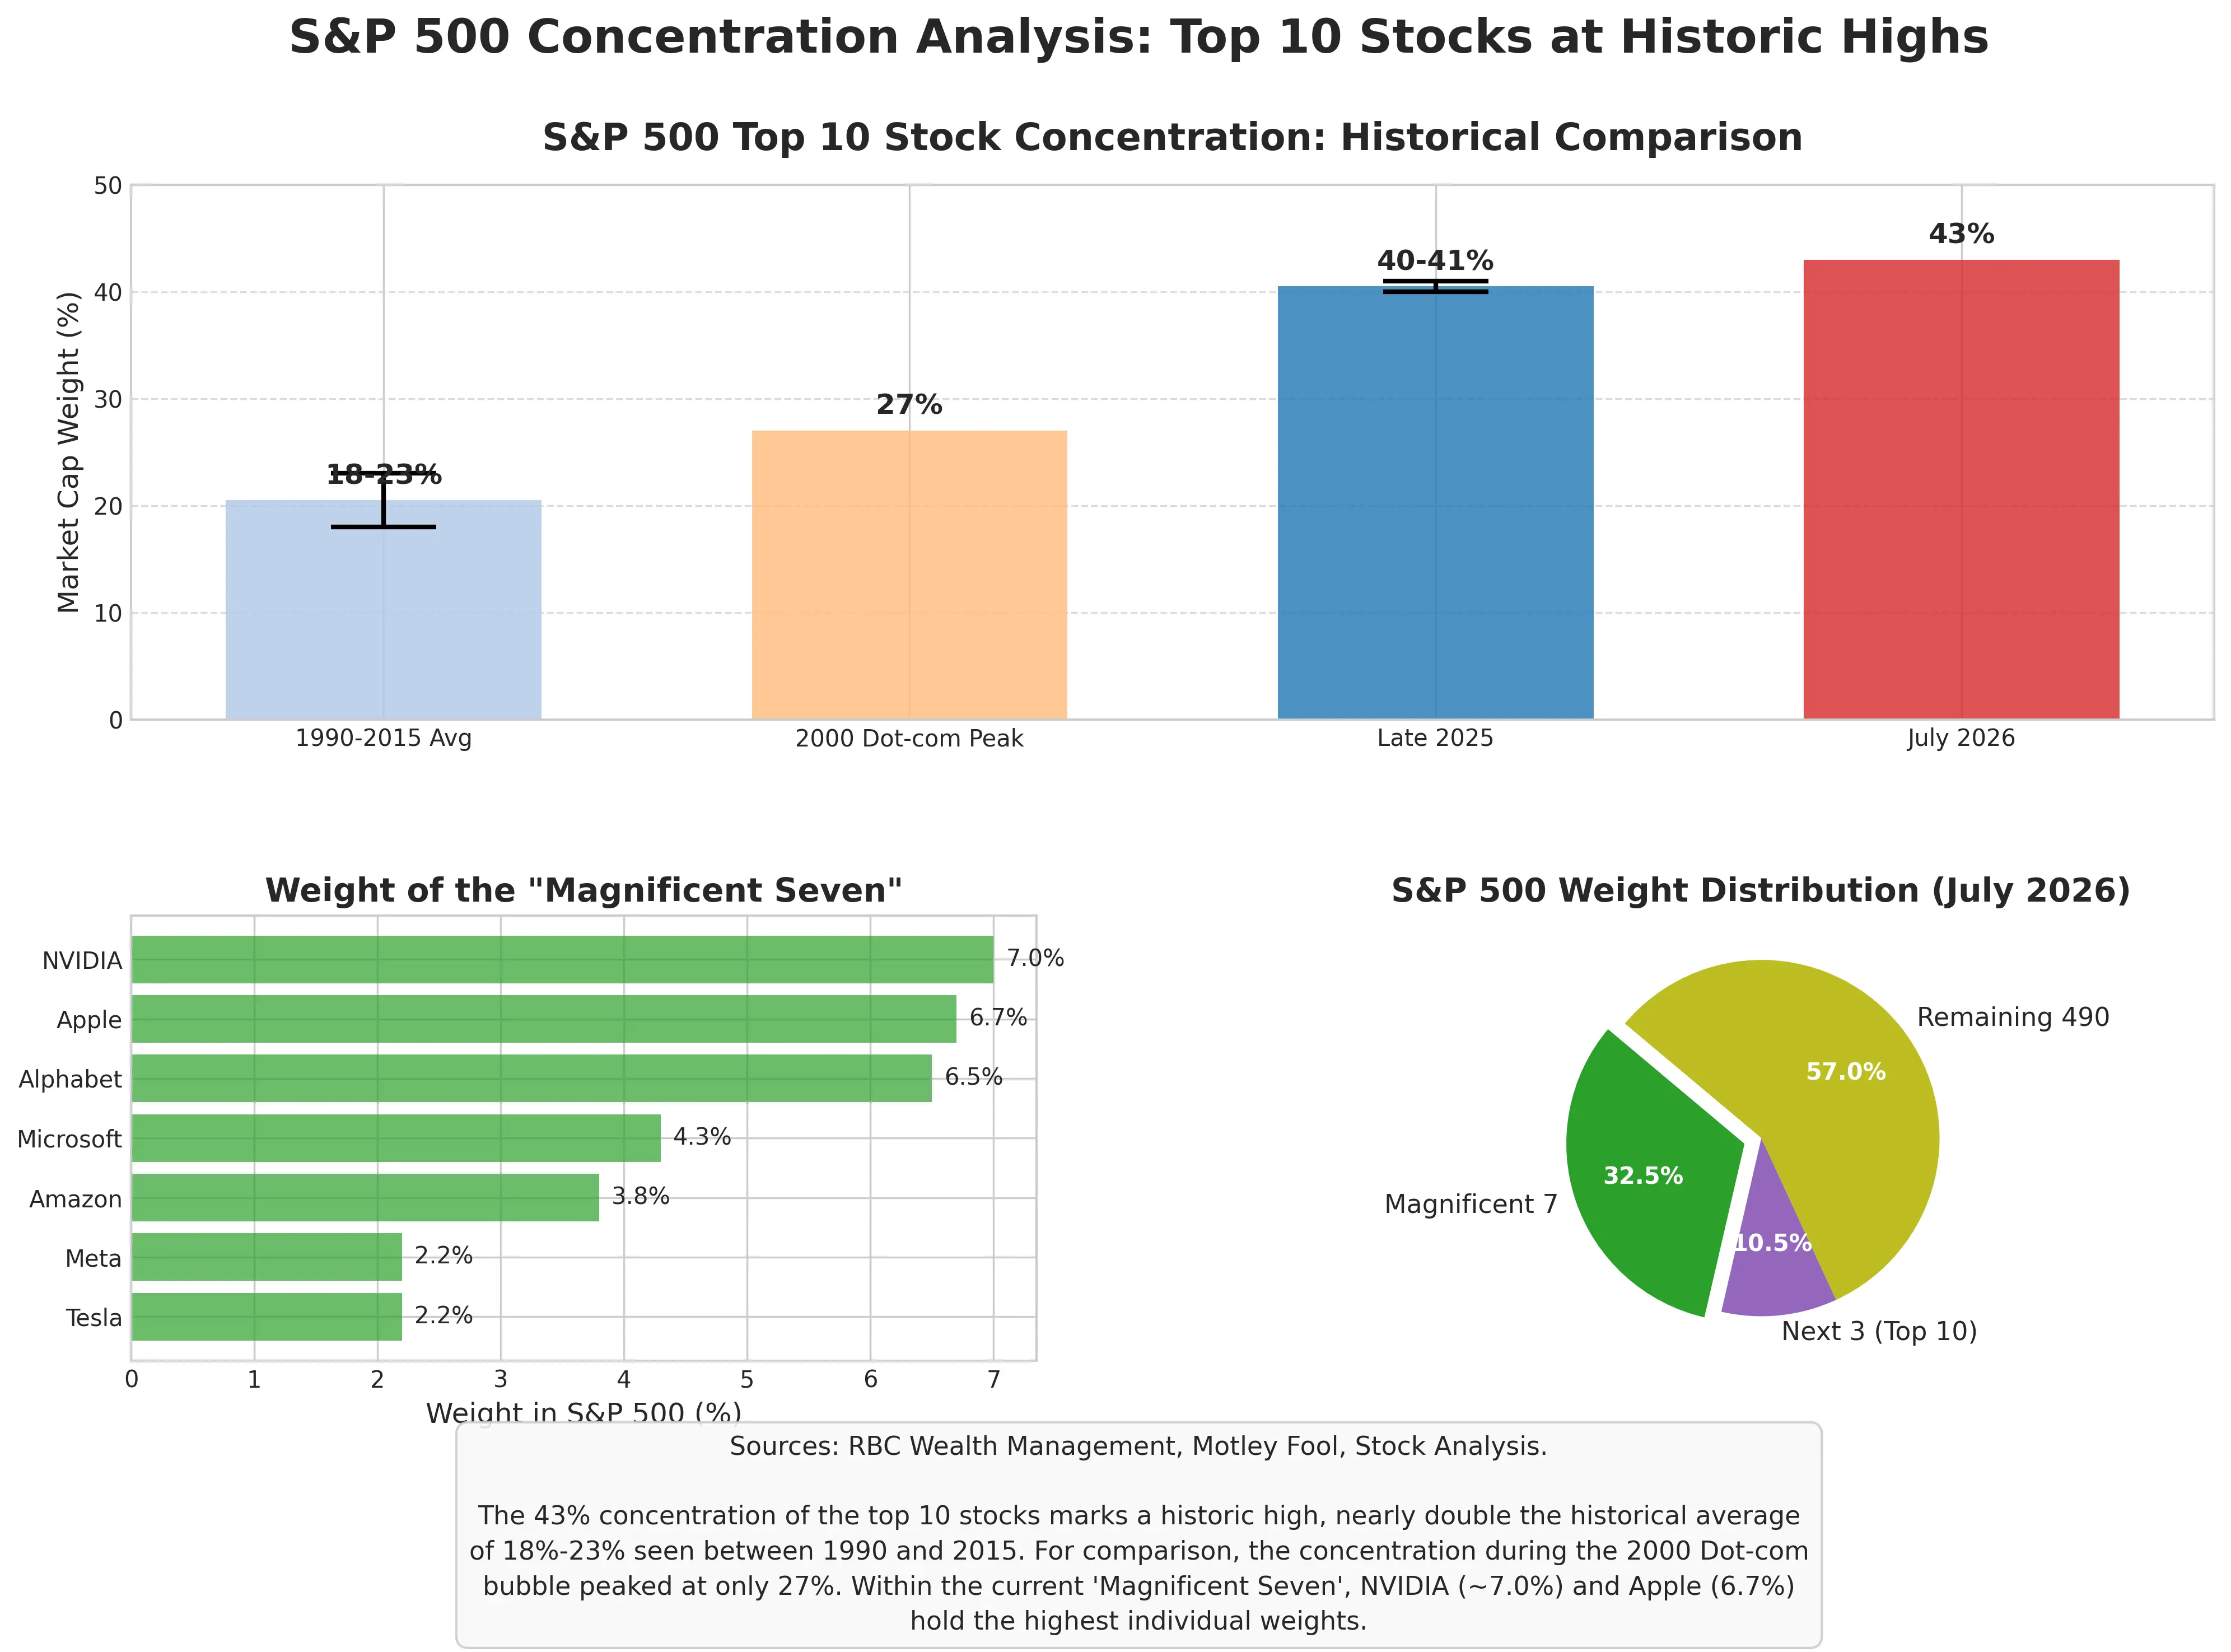
S&P 500 index concentration evolution (1990–2026)
The specific weights are: NVIDIA alone at about 7% of the S&P 500, Apple at about 6.7%, Alphabet (including two classes of shares) at about 6.3%, Microsoft at about 4.1%, and Amazon at about 3.8%. In some index funds with higher weights in certain tech stocks, the concentration of the top ten constituents can reach around 45%.
What does this concentration mean? It means the S&P 500’s performance no longer reflects the average performance of 500 companies; it increasingly depends on the fate of roughly 10 tech giants. If these AI leaders undergo a collective adjustment, the index would absorb shocks far greater than historical norms.
And this is exactly what is happening now. The index tracking the Seven Giants fell 4.8% in a single day after Alphabet released its earnings, marking the worst single-day performance since April 2025. Year to date in 2026, the index is down 3.7%, after having risen steadily over the prior three years. The Seven Giants’ overall performance in 2026 has lagged the S&P 500 index.
More worth watching is the divergence within the Seven Giants. As of July 24, Apple and Alphabet were still positive year to date, but Microsoft’s decline had reached about 19%, and Tesla’s drop was about 28%. Alphabet’s share price fell about 8% last week, with a market-cap loss of about $330B. This internal divergence shows that even the tech giant bloc viewed as “ironclad” is facing increasing scrutiny of its AI narrative.
Another side of concentration risk is: if capital leaves the Seven Giants, who will take over? In 2026 to date, semiconductors have been the most direct beneficiaries of the AI theme. The Philadelphia Semiconductor Index surged 101% in the first half, but gave back 17% in July. AI-hardware beneficiary sectors such as memory chips have also experienced sharp volatility. Rapid rotations of this kind among sectors are, by themselves, a reflection of uncertainty in the market.
Do earnings growth and valuation match?
High valuation alone does not necessarily mean a bubble—if earnings growth is fast enough, the premium can be absorbed. The key debate in the current market is whether AI investment is producing revenue, profits, and free cash flow that match the spending.
On the revenue side, AI is indeed driving growth. Alphabet’s second-quarter cloud computing revenue surged 82%. Intel’s second-quarter revenue reached $16.13B, up 25% year over year, the fastest growth rate in 15 years. These figures indicate that AI is not just a hype concept—it is translating into real corporate revenue.
The problem lies in profits and cash flow. Alphabet raised its full-year 2026 capital expenditure guidance to a maximum of $205 billion, causing free cash flow in the second quarter to turn negative for the first time since it went public. Management then raised spending plans again. Based on the market’s summarized analysts’ average estimates, capital expenditures for Alphabet, Microsoft, Amazon, and Meta combined are expected to reach about $724 billion in 2026 and to approach about $950 billion in 2027. Moody’s expects capital expenditures for six tech companies to reach about $785 billion in 2026 and further approach $1 trillion in 2027.
What do these numbers mean? They mean the long-standing development path of the technology sector—relying on an asset-light model to sustain high profit margins and stable balance sheets—is undergoing a fundamental change. Generative AI requires heavy hardware investment such as data centers, GPU servers, and high-performance chips. This is not a marginal-cost-decreasing logic of the software era; it is a capital-intensive logic of the heavy-asset era.
Take Oracle as an example: for its fiscal year as of May 2026, capital expenditures were $55.7 billion, while operating cash flow was only $32.0 billion—meaning it spent $1.74 to build a data center for every $1 earned. Microsoft’s capital expenditures in the last quarter were $31.9 billion, and free cash flow fell to $15.8 billion, down sharply from the level of $25.7 billion two quarters earlier. Bloomberg data shows that AI capital expenditures are expected to exceed earnings by the end of 2026, pushing net free cash flow into negative territory and keeping it there through the end of 2027.
This is the core logic behind the current reversal in market sentiment. In recent years, the market has been tolerant of AI spending by tech giants—as long as revenues continued growing and throwing large sums of money was rewarded. But this “gentlemen’s agreement” is unraveling. Jason Lemire, chief investment officer at Bold Wealth Partners, said: “The market is now highly sensitive to capital expenditures, even to the point of obsession. In the past, more was better; now it’s the opposite—less is more.”
The latest AAII survey (American Association of Individual Investors) shows that the share of investors holding a bearish stance rose to 42.3%, while the share holding a bullish stance fell to 29.6%, the lowest level since September 2022. This shift in sentiment occurred within just a few weeks.
From a more macro perspective, the pressure on the market comes not only from corporate fundamentals. In a report on July 27, Bank of America’s chief investment strategist Michael Hartnett warned that the yield on the 30-year US Treasury has risen to the highest level since June 2007 at 5.2%, and that the real yield has touched a peak not seen since November 2008 at 3%. The degree of financial tightening is now exceeding the support that corporate earnings can provide to the market. Meanwhile, federal funds futures traders expect the Federal Reserve to raise rates in July with a 38% probability—in a market where valuations are already at historical highs, any rate hike could become a trigger for a repricing of valuations.
Conclusion
Returning to the core question at the start: has the US stock market already detached from fundamentals?
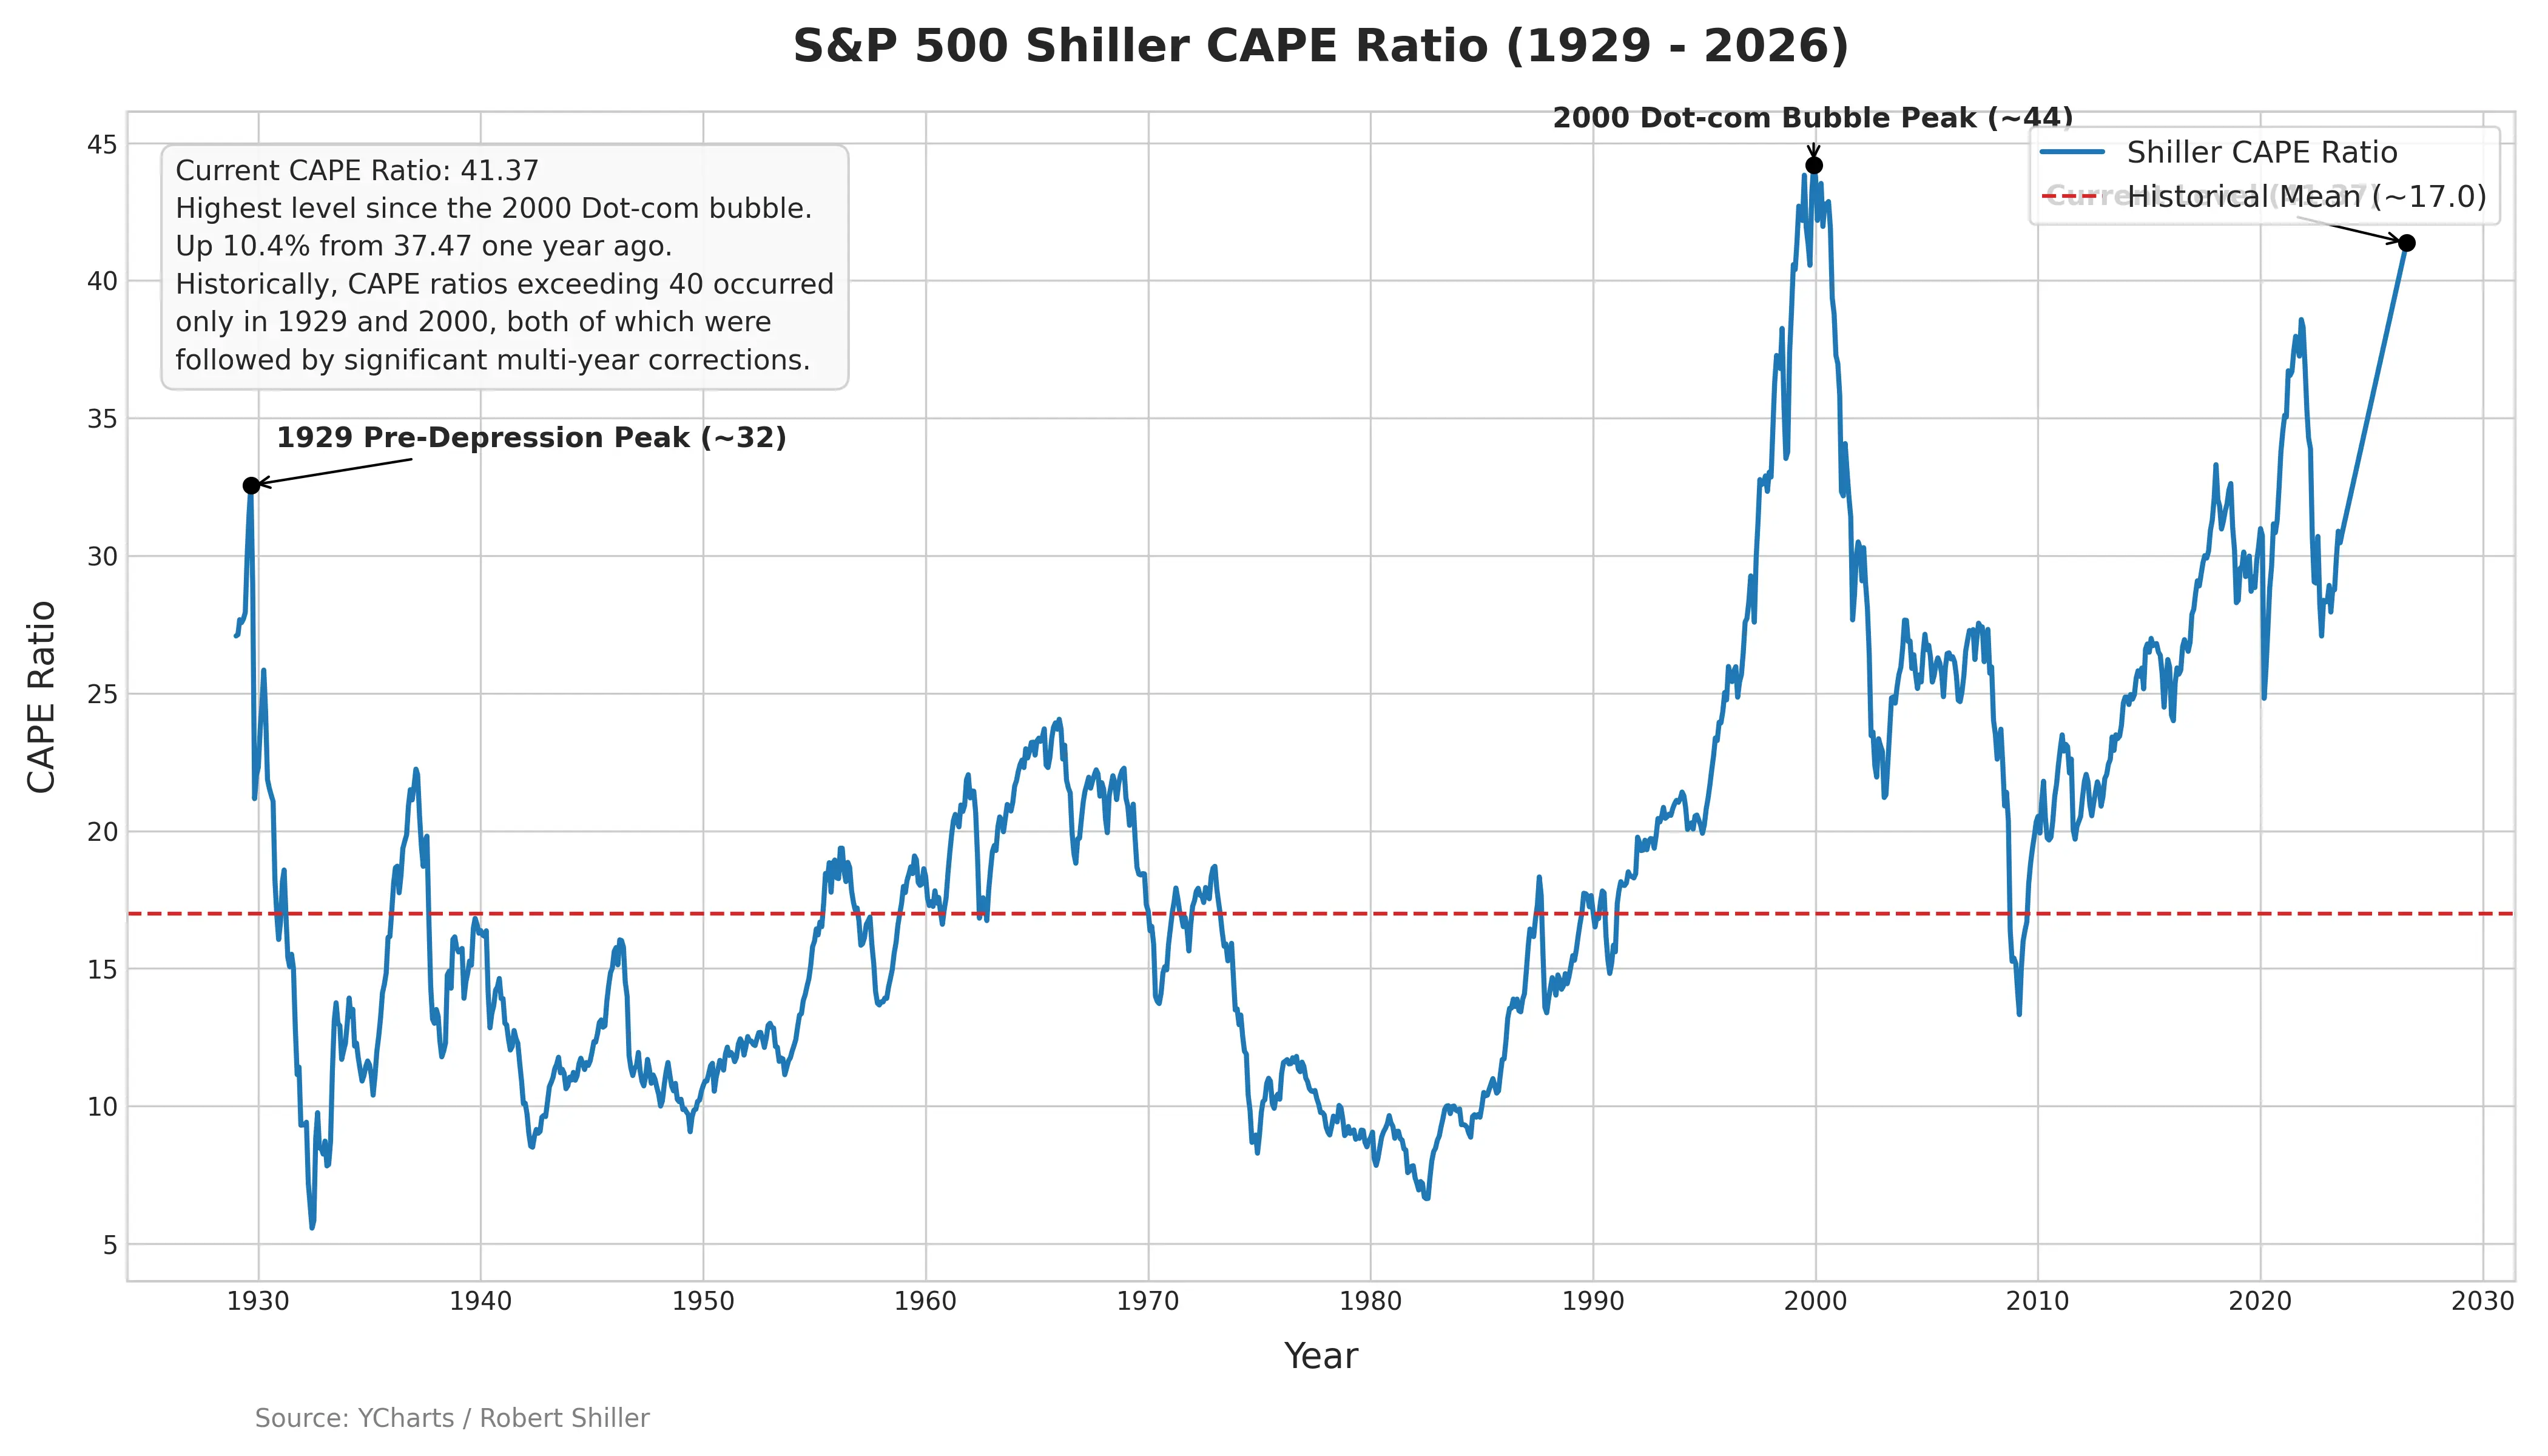
From the data, the answer is hard to be optimistic. The S&P 500’s CAPE ratio sits at the historical extreme of 41.37. The top ten stocks account for 43% of market value, an unprecedented level of concentration. AI leaders’ capital expenditures are eroding free cash flow at an unprecedented pace—these indicators together draw a picture that bears unsettling similarities to any major market top in history.
But this does not mean the market must inevitably crash in the short term. NVIDIA’s forward valuation has fallen sharply. Microsoft’s P/E is below its historical average. Alphabet’s cloud business is still growing rapidly. These facts suggest that the AI industrial trend has not reversed, and that the valuations of some individual stocks have, to some extent, digested part of the earlier bubble premium.
The real risk in today’s market is not whether AI exists, but whether AI valuations have already priced in growth expectations for the years ahead. If AI investment can translate as expected into revenue, profits, and free cash flow, elevated valuations can be absorbed over time. But if the capital expenditure payback cycle turns out to be longer than the market expects, or if the macro environment (interest rates, inflation, geopolitics) changes beyond expectations, the optimistic assumptions embedded in current pricing could face a systemic correction.
The market is waiting for answers. And the answers will gradually emerge over the next few weeks in the earnings reports of Microsoft, Amazon, Meta, and Apple, in the Federal Reserve’s interest rate decision, and in the return data from each AI capital expenditure cycle.
FAQ
Q1: What is the Shiller CAPE ratio? Why is it considered an important indicator for measuring a bubble?
The Shiller CAPE ratio (cyclically adjusted P/E) was proposed by Nobel Prize-winning economist Robert Shiller. Its formula is the S&P 500’s current price divided by the average earnings over the past 10 years adjusted for inflation. By smoothing out short-term earnings fluctuations, the indicator more accurately reflects the market’s long-term valuation level. Historical data show that periods when the CAPE ratio exceeds 40 have occurred only twice—1929 and 2000—and after both times the market underwent deep corrections.
Q2: How much weight do the “Magnificent Seven” stocks have in the S&P 500? Why does concentration pose a risk?
As of July 2026, the Seven Giants combined account for 32.5% of the S&P 500’s total index market capitalization. The top ten stocks together make up 43%, nearly double the historical average peak of about two times between 1990 and 2015. This means the index’s performance is highly dependent on a small number of stocks. If these AI leaders adjust due to valuation corrections or earnings falling short of expectations, the index would take a shock larger than what has occurred in any earlier period.
Q3: How large are the capital expenditures of AI giants? Why does it raise market concerns?
Alphabet, Microsoft, Amazon, and Meta are expected to have combined capital expenditures of about $724 billion in 2026 and to approach $950 billion in 2027. Alphabet’s free cash flow turns negative for the first time since it went public due to a substantial increase in capital expenditures. The core market concern is that large hardware investments are shifting the technology industry from an asset-light, high-margin model to a heavy-asset, capital-intensive one, while the time frame and scale of investment returns are highly uncertain.
Q4: How does the current US stock valuation compare with bubble periods like 1929 or 2000?
Based on the CAPE ratio, the current level of 41.37 is nearing the historical peak seen during the dot-com bubble around 2000. Based on market concentration, the top ten stocks’ 43% share of market value is far above the dot-com peak of about 26% to 27% around 2000. Based on the Buffett indicator (total stock market capitalization divided by GDP), the metric has risen to above 236%, setting another historical high. Multiple indicators point to the current market valuation being at a historically rare extreme level.