Futures
Access hundreds of perpetual contracts
TradFi
Gold
One platform for global traditional assets
Options
Hot
Trade European-style vanilla options
Unified Account
Maximize your capital efficiency
Demo Trading
Introduction to Futures Trading
Learn the basics of futures trading
Futures Events
Join events to earn rewards
Demo Trading
Use virtual funds to practice risk-free trading
Launch
CandyDrop
Collect candies to earn airdrops
Launchpool
Quick staking, earn potential new tokens
HODLer Airdrop
Hold GT and get massive airdrops for free
Launchpad
Be early to the next big token project
Alpha Points
Trade on-chain assets and earn airdrops
Futures Points
Earn futures points and claim airdrop rewards
More
Zhang Yaoxi: Are we entering an era of high oil prices and high inflation? Gold prices are expected to fluctuate and rise amid the chaos.
Zhang Yaoxun: Is a high-oil-price and high-inflation era coming? Will gold prices rise amid market chaos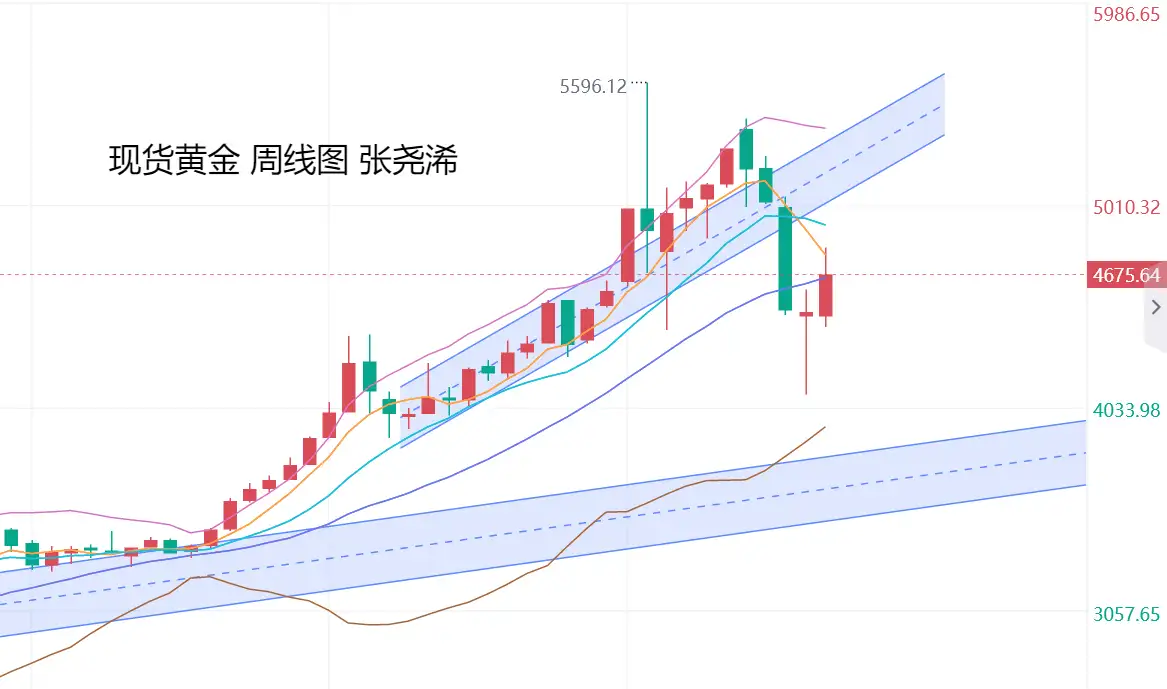
On the previous trading day, Thursday (April 2): International gold met resistance and retreated, closing lower. A nationwide address by Trump did not convince the market that the war is about to end and that the issue of the Strait of Hormuz will be resolved. Instead, it intensified the conflict, saying that over the next two to three weeks, the U.S. will continue to deal Iran a heavy blow. This boosted crude oil and the U.S. dollar sharply, and pressured gold prices; gold once plunged by nearly 250 dollars. But in the end, it bottomed out and rebounded. In the U.S. evening session, Iran said it is drafting a Strait of Hormuz transit agreement with Oman, easing concerns about inflation. This kept gold prices still above the 100-day moving average, suggesting that the bulls still have a certain advantage. Expectations remain for another upside rebound later on.
In terms of the specific price action, gold opened in the Asian session at $4,757.97 per ounce. It first moved higher, recording an intraday high of $4,800.19. After that, it met resistance and pulled back, then continued to plunge lower. At the 14:00 time segment, it recorded an intraday low of $4,553.93. Finally, it stopped falling, and overall it rebounded in a range-bound manner. It ultimately closed at $4,668.84 at the end of the U.S. session, with a daily swing of $246.26 and a net loss of $89.13, down 1.87%.
Looking ahead to today, Friday (April 3): The international gold market will be closed all day due to Good Friday, and will show no movement. It will reopen normally next Monday. As for the impact of the U.S. March nonfarm payrolls data to be released tonight, based on the already released ADP and initial jobless claims data at the start of the week, although they are both weaker than the prior values, they are still better than market expectations. Therefore, nonfarm employment data is highly likely to come out with a positive reading, which would be a bearish factor for gold prices. However, because March average hourly earnings year-over-year and month-over-month are overall lower, that would be bullish for gold. So overall, the impact is still mainly expected to be range trading. Extending into next Monday’s open, gold is also expected to either remain range-bound or continue to rebound and rise. In the short term, it still has the potential to test the $4,840 or $5,000 levels.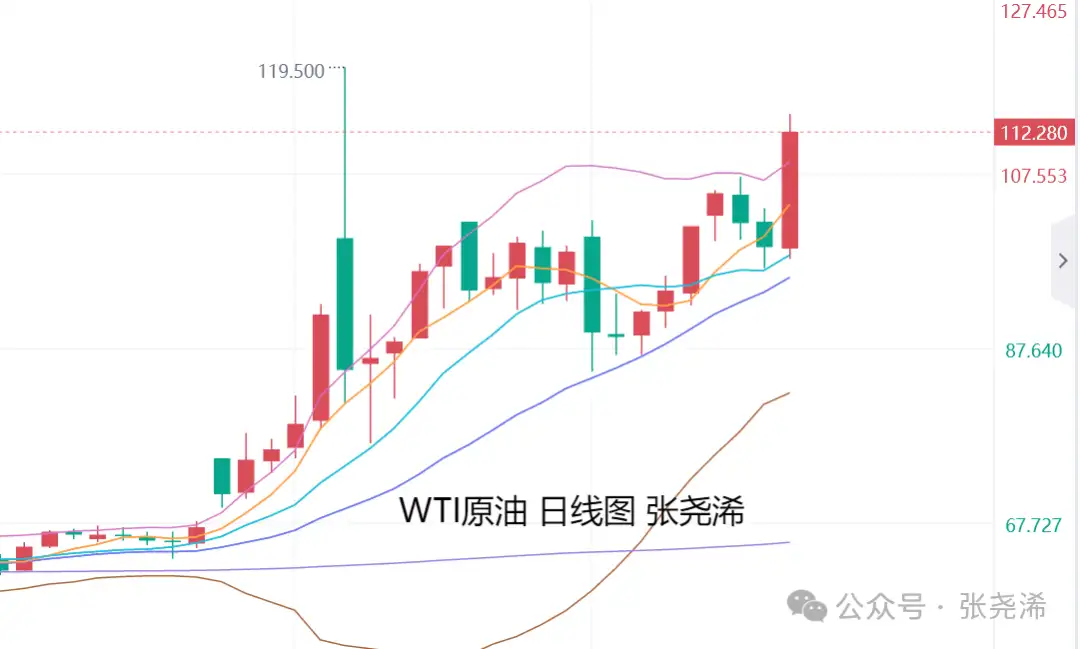
On the fundamentals, even though the U.S.-Iran situation has not stopped firing and Trump’s back-and-forth keeps geopolitical risk elevated, it is because Iran is drafting an agreement with Oman for a transit arrangement through the Strait of Hormuz—charging transit fees for ships passing through the strait. This is making the market lean toward the view that although fighting may not stop, passage through will still be possible.
Therefore, on the one hand, the market will continue to be supported by safe-haven demand. On the other hand, the fact that passage is possible indicates that energy demand concerns can be resolved and demand worries will ease. But since it must be paid for, costs will rise. Thus, crude oil prices in the future will be in a certain high-level range-bound pattern: not a sustained rally, but also difficult to sustain a prolonged decline. In addition, inflation will continue to remain high. Iran also has “real-time control” over global inflation. But I believe the adjustment strength is limited; it will only change the benchmark and thresholds for inflation going forward.
For the U.S., if it accepts the agreement and regains transit passage, then it is the retreat of hegemony. If it does not accept it, then it will need to take the road of using force. And other oil-producing countries will inevitably build additional oil pipelines to bypass the strait, and so on. So, looking at the situation overall, instability remains and the market still has a high level of volatility. Trading still needs to be cautious.
But Zhang Yaoxun believes that the gold market has always been driven by expectations. For the violent surge in crude oil and the rise in inflation, as well as the Federal Reserve’s interest-rate-hike expectations arising from this, gold had already probed down to the $4,100 level at the low end—one could say it has already priced in the worst-case outcome. Now, although the conflict is still ongoing, as long as passage through the strait is possible, it is more likely to be controllable. This implies that if inflation remains controllable in the future, the continued geopolitical situation will shift toward increasing safe-haven demand for gold.
In addition, Federal Reserve Chair Powell said he will wait and observe the impact of the war on the economy and inflation, and will not consider rate hikes for now. Fed Governor Milan also said the Fed could gradually cut rates by one percentage point within a year, and so on. The market will again revisit rate-cut expectations. So, whether the geopolitical situation ends or does not end, the market will again return to the Federal Reserve’s rate-cut cycle, along with structural bullish factors such as central banks’ gold buying and de-dollarization. Therefore, I still lean toward the view that this round of gold’s decline is only an intermediate correction within a larger up-cycle. Over the coming year, it is still expected that gold may rise again to refresh highs.
Technically, on the monthly chart level, gold’s March closing is above the rising trendline, maintaining a bullish outlook for a bull market. Even this month’s opening still stays on that upward track. As long as the price does not close below this trendline, the outlook for new highs will remain.
On the weekly chart level, gold this week has, as expected, continued the pattern from last week: bottoming out, rebounding, stopping the fall, and forming a bullish shape with rebound momentum, and it has further strengthened. Although it has not yet broken through the 5- to 10-week moving average resistance and is holding steady to turn stronger, based on the bullish arrangement of the long-term moving averages below and whether the ZZ indicator is still not showing a top for the current rebound, the direction still remains bullish. Key resistance to watch is the 10-week moving average pressure. If it breaks through this level, it may again refresh highs.
On the daily chart: On Thursday, gold was sharply resisted and fell, but ultimately it bottomed out and closed above the 100-day moving average. The ZZ indicator did not show signs of a top during the rebound, and the attached indicators also maintain bullish signal development. This suggests the outlook for gold’s price action remains upward. On the downside, focus on support around the 100-day moving average; or support from the 5- to 10-day moving average as well—overall, it is still primarily bullish. Continue to wait for a move to test the $4,900 or $5,100 targets.
Gold: Support to watch below at around $4,620 or $4,530; resistance to watch above at around $4,845 or $4,910;
Silver: Support to watch below at $72.10 or $71.00; resistance to watch above at $76.60 or $78.40;
Note:
Gold TD = (international gold price × exchange rate) / 31.1035
If international gold moves by 1 dollar, gold TD is about a 0.25 yuan move (theoretically).
U.S. futures gold price = London spot price × (1 + gold swap interest rate × number of days until futures maturity / 365)
Follow me—so your gold trading ideas become clearer!
Review historical cause and effect, interpret the current environment, and look ahead to the future direction. Adhere to the principle of bold forecasting and cautious trading. --Zhang Yaoxun
The above views and analysis only represent the author’s personal thinking, for reference only, and do not constitute trading advice. Any gains or losses from trading based on this are your own responsibility.
You decide your own money.