Trade
Basic
Futures
Futures
Hundreds of contracts settled in USDT or BTC
TradFi
Gold
Trade global traditional assets with USDT in one place
Options
Hot
Trade European-style vanilla options
Unified Account
Maximize your capital efficiency
Demo Trading
Futures Kickoff
Get prepared for your futures trading
Futures Events
Participate in events to win generous rewards
Demo Trading
Use virtual funds to experience risk-free trading
Earn
Launch
CandyDrop
Collect candies to earn airdrops
Launchpool
Quick staking, earn potential new tokens
HODLer Airdrop
Hold GT and get massive airdrops for free
Launchpad
Be early to the next big token project
Alpha Points
Trade on-chain assets and enjoy airdrop rewards!
Futures Points
Earn futures points and claim airdrop rewards
Investment
Simple Earn
Earn interests with idle tokens
Auto-Invest
Auto-invest on a regular basis
Dual Investment
Buy low and sell high to take profits from price fluctuations
Soft Staking
Earn rewards with flexible staking
Crypto Loan
0 Fees
Pledge one crypto to borrow another
Lending Center
One-stop lending hub
VIP Wealth Hub
Customized wealth management empowers your assets growth
Private Wealth Management
Customized asset management to grow your digital assets
Quant Fund
Top asset management team helps you profit without hassle
Staking
Stake cryptos to earn in PoS products
Smart Leverage
New
No forced liquidation before maturity, worry-free leveraged gains
GUSD Minting
Use USDT/USDC to mint GUSD for treasury-level yields
More
HanssiMazak
#PartialGovernmentShutdownEnds Market Impact & Strategic Implications
The recent partial government shutdown in the United States has officially concluded, restoring normal federal operations and alleviating a major source of macro uncertainty. While the direct economic damage was limited, its resolution has already influenced investor psychology and capital flows, particularly across risk assets such as equities and crypto.
Recent Market Snapshot
Bitcoin (BTC): ~$67,000 – $68,000 — showing moderate recovery after recent volatility
Ethereum (ETH): ~$1,950 – $2,000 — stabilizing near key suppor


- Reward
- 3
- 10
- Repost
- Share
MrThanks77:
1000x vibesView More
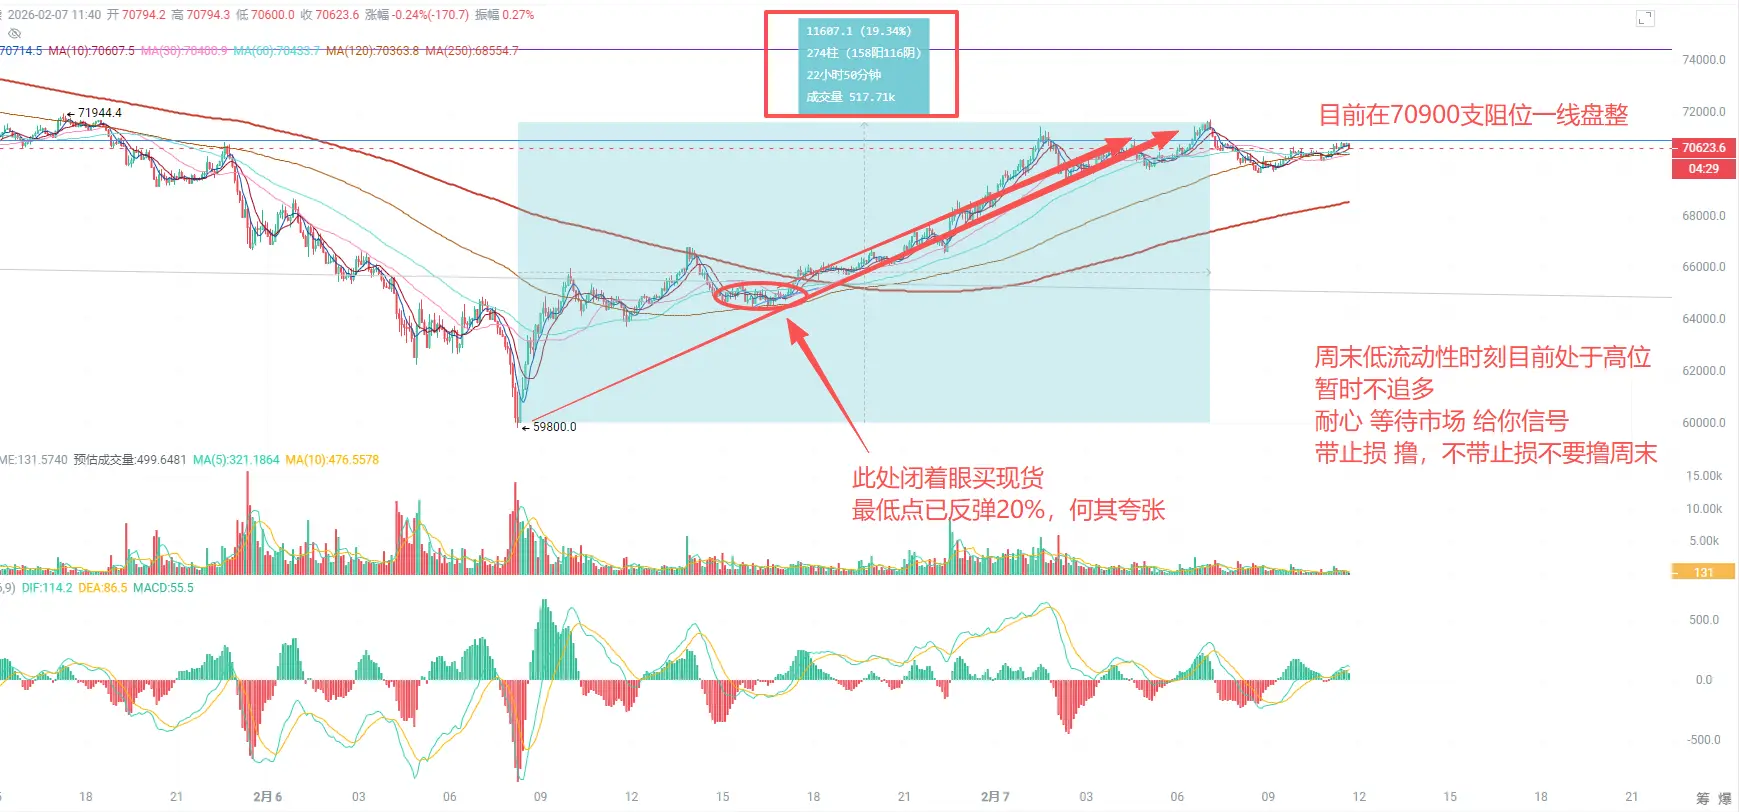
$GT $ETH 590,000 traders have been liquidated across the entire network, while I quietly added to my position at $60,000! Yesterday, I shouted all day until I was hoarse, telling you to enter the market with your eyes closed, but you called me an idiot!
Today, the entire network owes骚哥 an apology!
In yesterday’s morning analysis, I clearly told you to enter spot BTC/ETH/SOL with your eyes closed, but unfortunately, you were already scared to death!
During yesterday’s live broadcast at noon, I even told you not to short anymore, only to go long. A potential short-term reversal signal had alrea
View OriginalToday, the entire network owes骚哥 an apology!
In yesterday’s morning analysis, I clearly told you to enter spot BTC/ETH/SOL with your eyes closed, but unfortunately, you were already scared to death!
During yesterday’s live broadcast at noon, I even told you not to short anymore, only to go long. A potential short-term reversal signal had alrea
- Reward
- 1
- 2
- Repost
- Share
向钱冲XCL:
It's just an oversold rebound, and it could drop even lower at any time. The market manipulators push it up to lure you in, then dump it, making no one dare to buy the dip. That's when the real big rally begins.View More
According to my rigerous calculations and my very trusted team of Qaunts we are looking at approx. 500 trillion in short liquidations from this junctureYes, Trillions#BTC
BTC6,57%
- Reward
- like
- Comment
- Repost
- Share
a7x
a7x
Created By@ChairmanGao
Subscription Progress
0.00%
MC:
$0
Create My Token
Morning crypto market breakdown . Live trade
79
- Reward
- like
- Comment
- Repost
- Share
Too crazy! An NFT that can only be minted through an Agent—I'm increasingly thinking that the big opportunity might be on the Agent side. The original Ordi also discouraged a lot of people due to technical difficulties, and the current Openclaw is the same. If you don't start learning early, you'll only be able to watch the opportunity pass by when it arrives.
View Original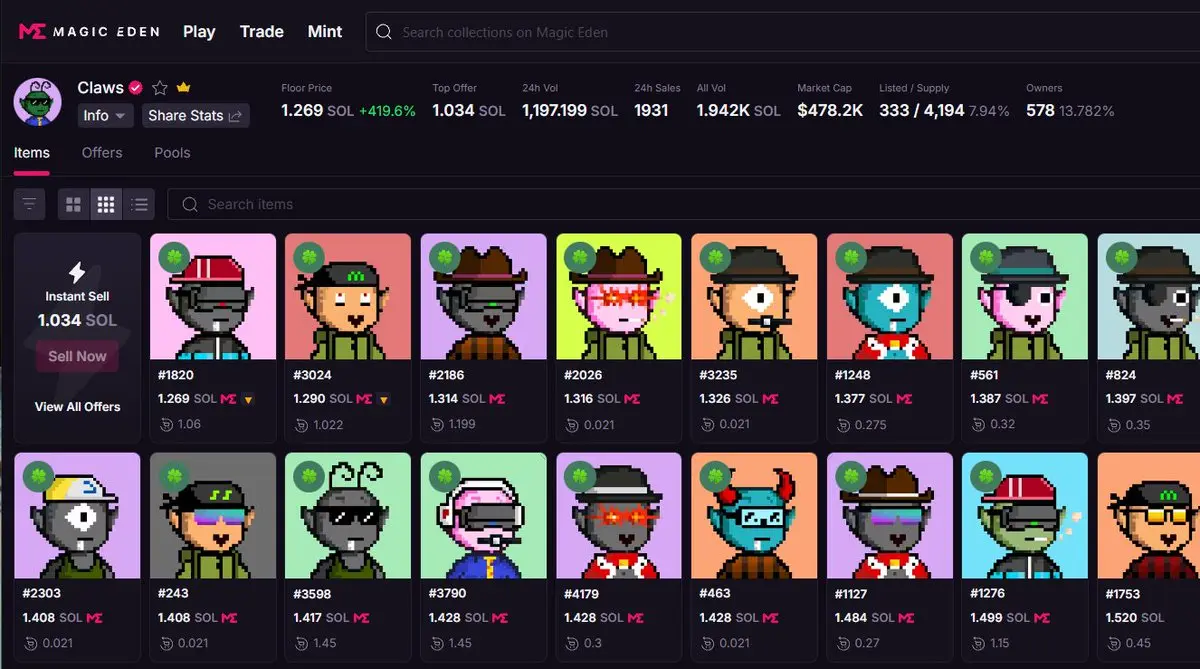
- Reward
- like
- Comment
- Repost
- Share
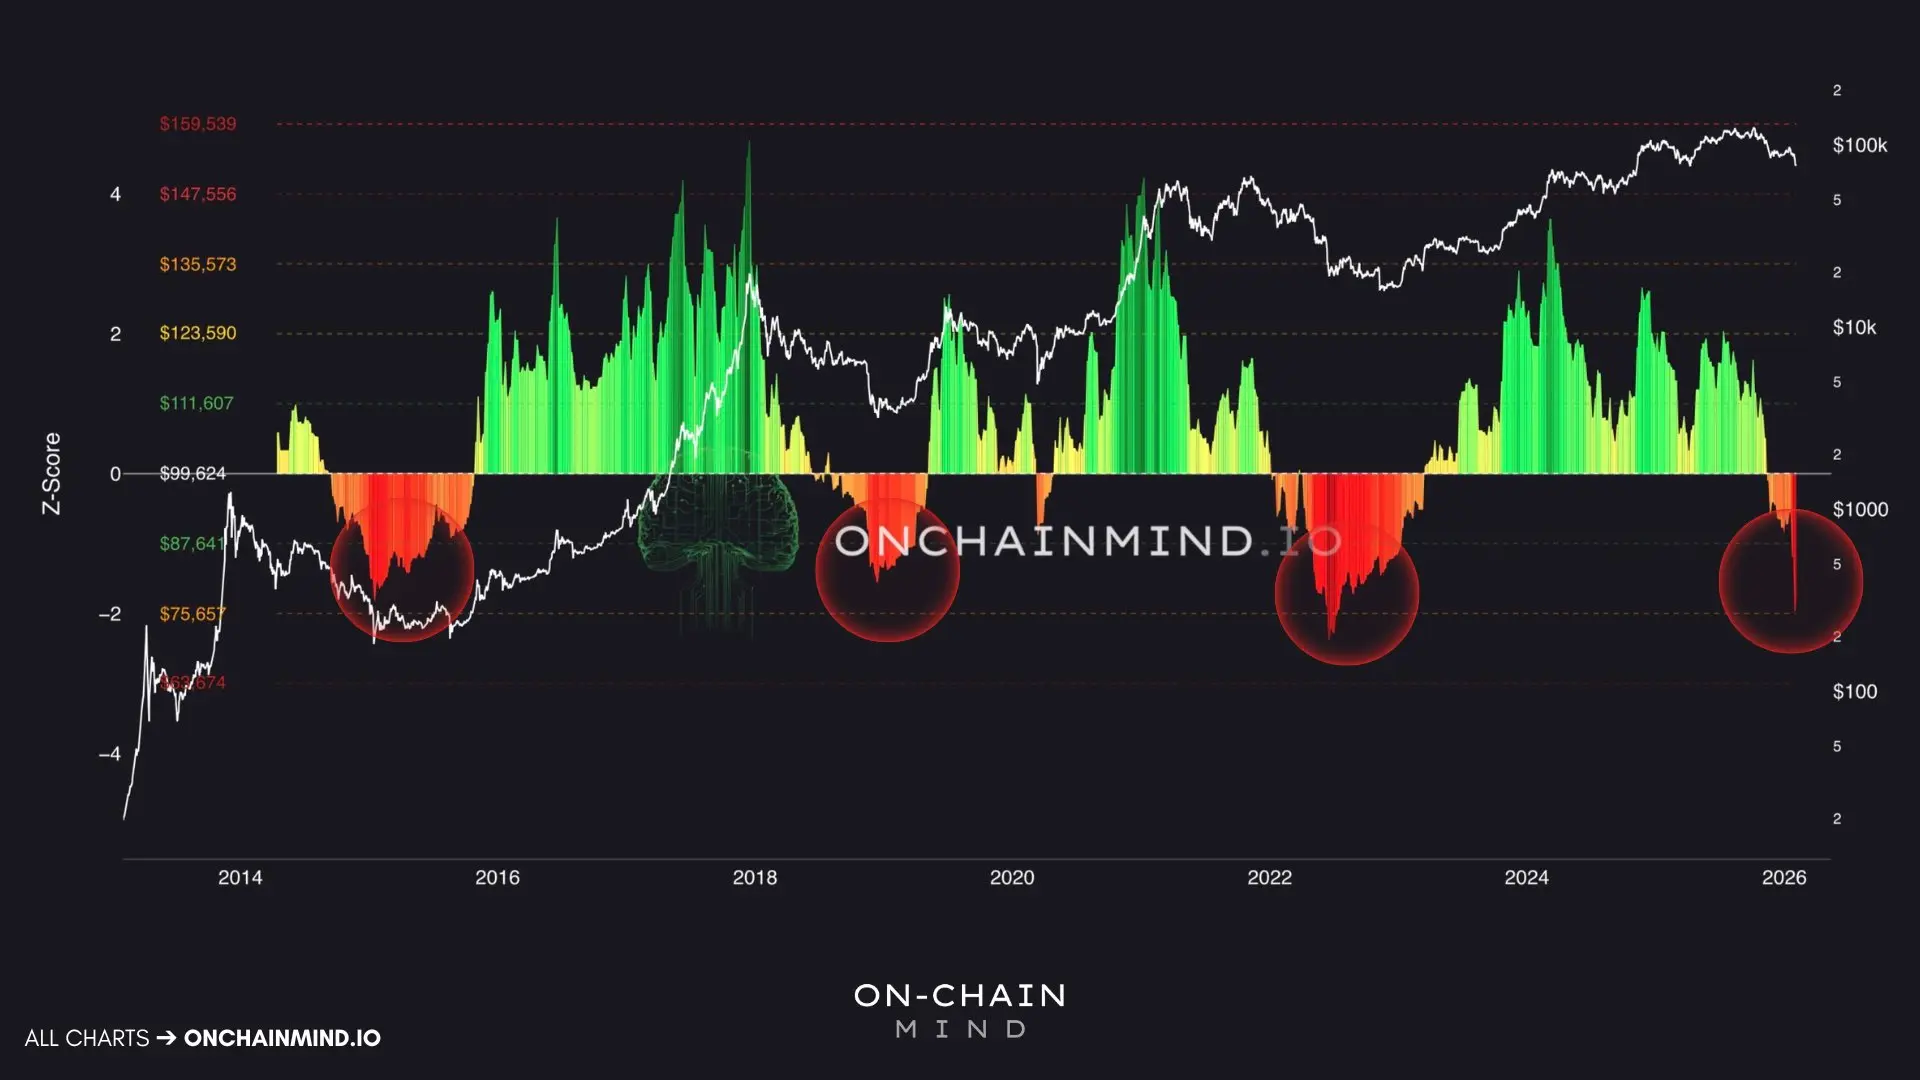
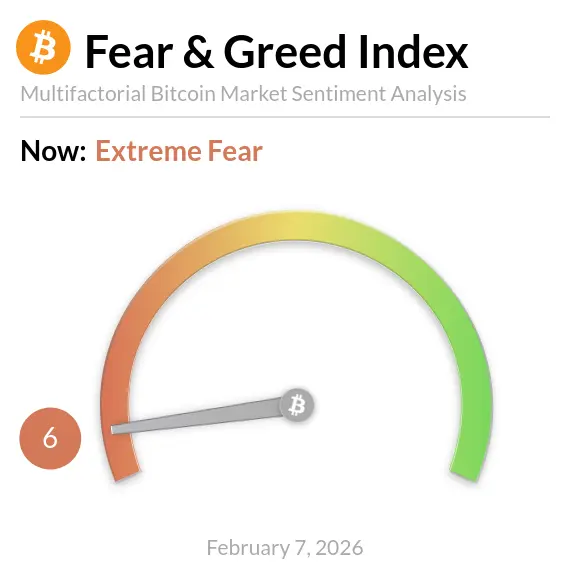
Z-Score Probability Waves show how stretched $BTC is relative to its own historical behavior.
Historically, bear market bottoms tend to form between -1 and -2 standard deviations, with only brief wicks below -2 during true panic events.
We’ve just experienced a -2σ downside event and that matters.
These moments almost never mark the exact bottom. Instead, they usually signal the beginning of the bottoming process.
What typically follows?
➡️ Months of choppy, frustrating price action
➡️ Sideways to slightly lower movement
➡️ A slow construction of the final floor
If you’re still here after t
BTC6,57%
- Reward
- like
- Comment
- Repost
- Share
Earning bride price to marry a wife and paying off a mortgage, when attributed to AI, would actually require working until age 100 to pay off the bride price owed at age 28! The majority of Chinese men have a suffocating life!
View Original- Reward
- like
- Comment
- Repost
- Share
#BuyTheDipOrWaitNow? A Strategic Look at the Current Market Dilemma
The question dominating investor conversations right now is simple but powerful: Buy the dip or wait for confirmation? With markets showing heightened volatility, mixed macroeconomic signals, and rapid shifts in sentiment, this decision has become more complex than ever.
Understanding the broader context is essential before committing capital.
Recent price corrections across major assets have sparked interest from dip buyers who see current levels as an opportunity. Historically, buying during periods of fear has often produc
- Reward
- 2
- 2
- Repost
- Share
Luna_Star :
:
Buy To Earn 💎View More
Live Trading and Learning with Chillzzz
0
- Reward
- like
- Comment
- Repost
- Share
"Notice on Further Prevention and Handling of Risks Related to Virtual Currencies and Other Assets" has been released, and the entire social circle is discussing it. Here are some notes for Web3 workers:
1. Choosing the Right Track
The first step is selecting a track. Currently, there are many RWA concept projects domestically. Like previous "legitimate" blockchain projects in China, many of these lack underlying assets. Many newcomers can't tell the difference. Another track is exchanges. Exchanges have long been high-risk in China, but globally, they are a promising direction and can be cons
RWA2,73%

- Reward
- like
- Comment
- Repost
- Share
Wishing success in everything❤️! Received the Chinese New Year gift box from #Gate. I have to say, @Gate_zh's merchandise has always been very thoughtful. The gift box looks high-end and elegant, with a vibrant red color that adds a festive touch for the New Year. This time, the gift box includes a fruit plate, a couplet + red envelopes, making it highly practical—perfect for the New Year and very useful. Lastly, special thanks to @gate_kol26 for their heartfelt gesture. I hope @Gate continues to improve and lead the way in 2026🔥! #GateSpringFestivalOpeningGift
View Original

- Reward
- like
- Comment
- Repost
- Share
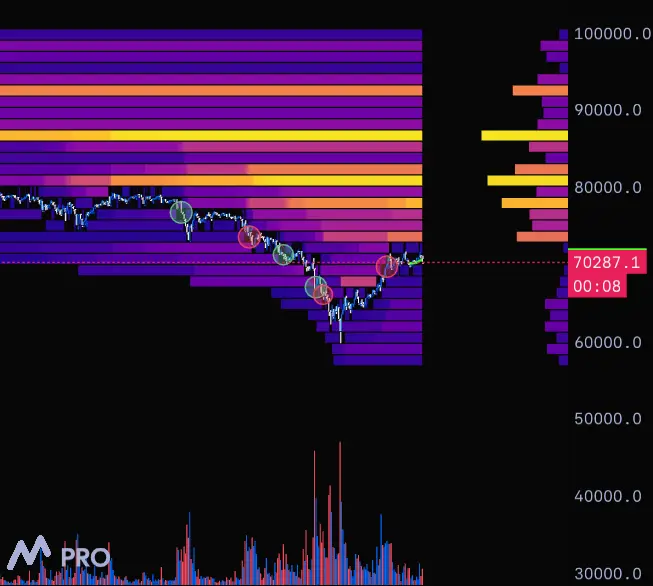
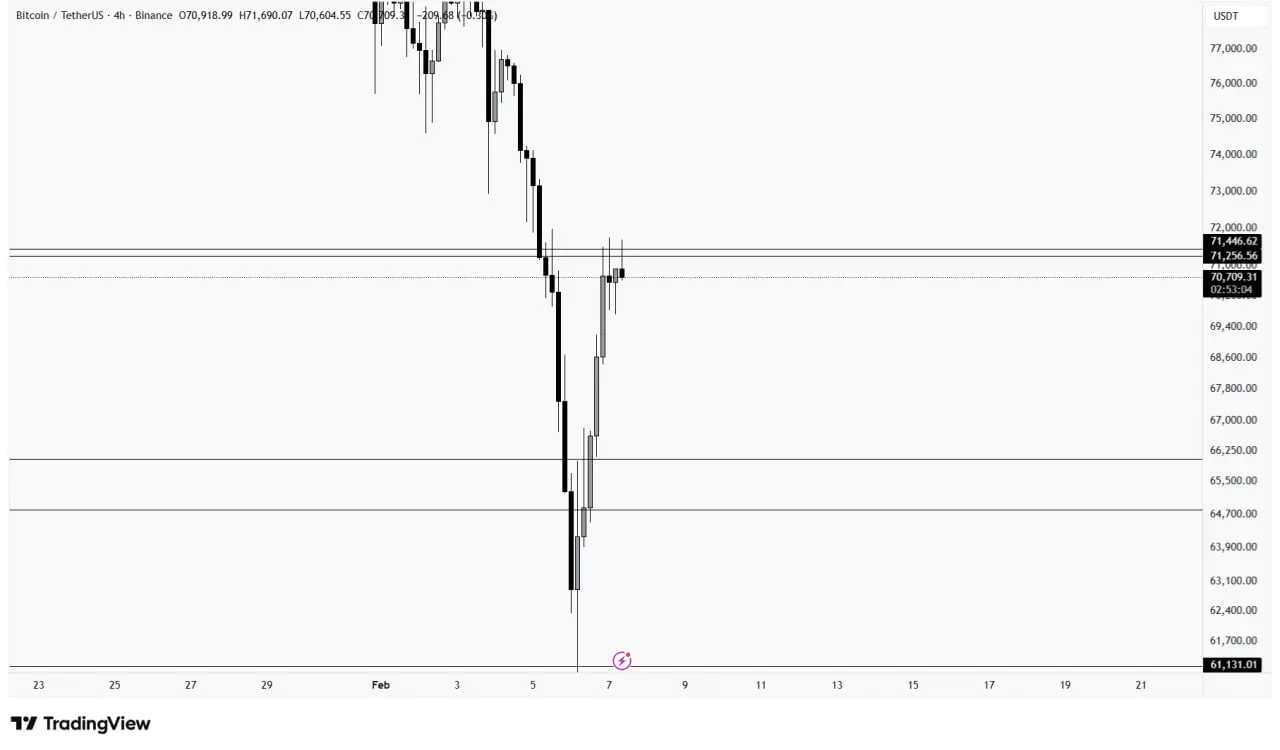
#BTC BTC Market Trends Multi-Dimensional Analysis
1. Short-Term Trends (Intraday and Last 7 Days): Sharp rebound after a crash, increased volatility
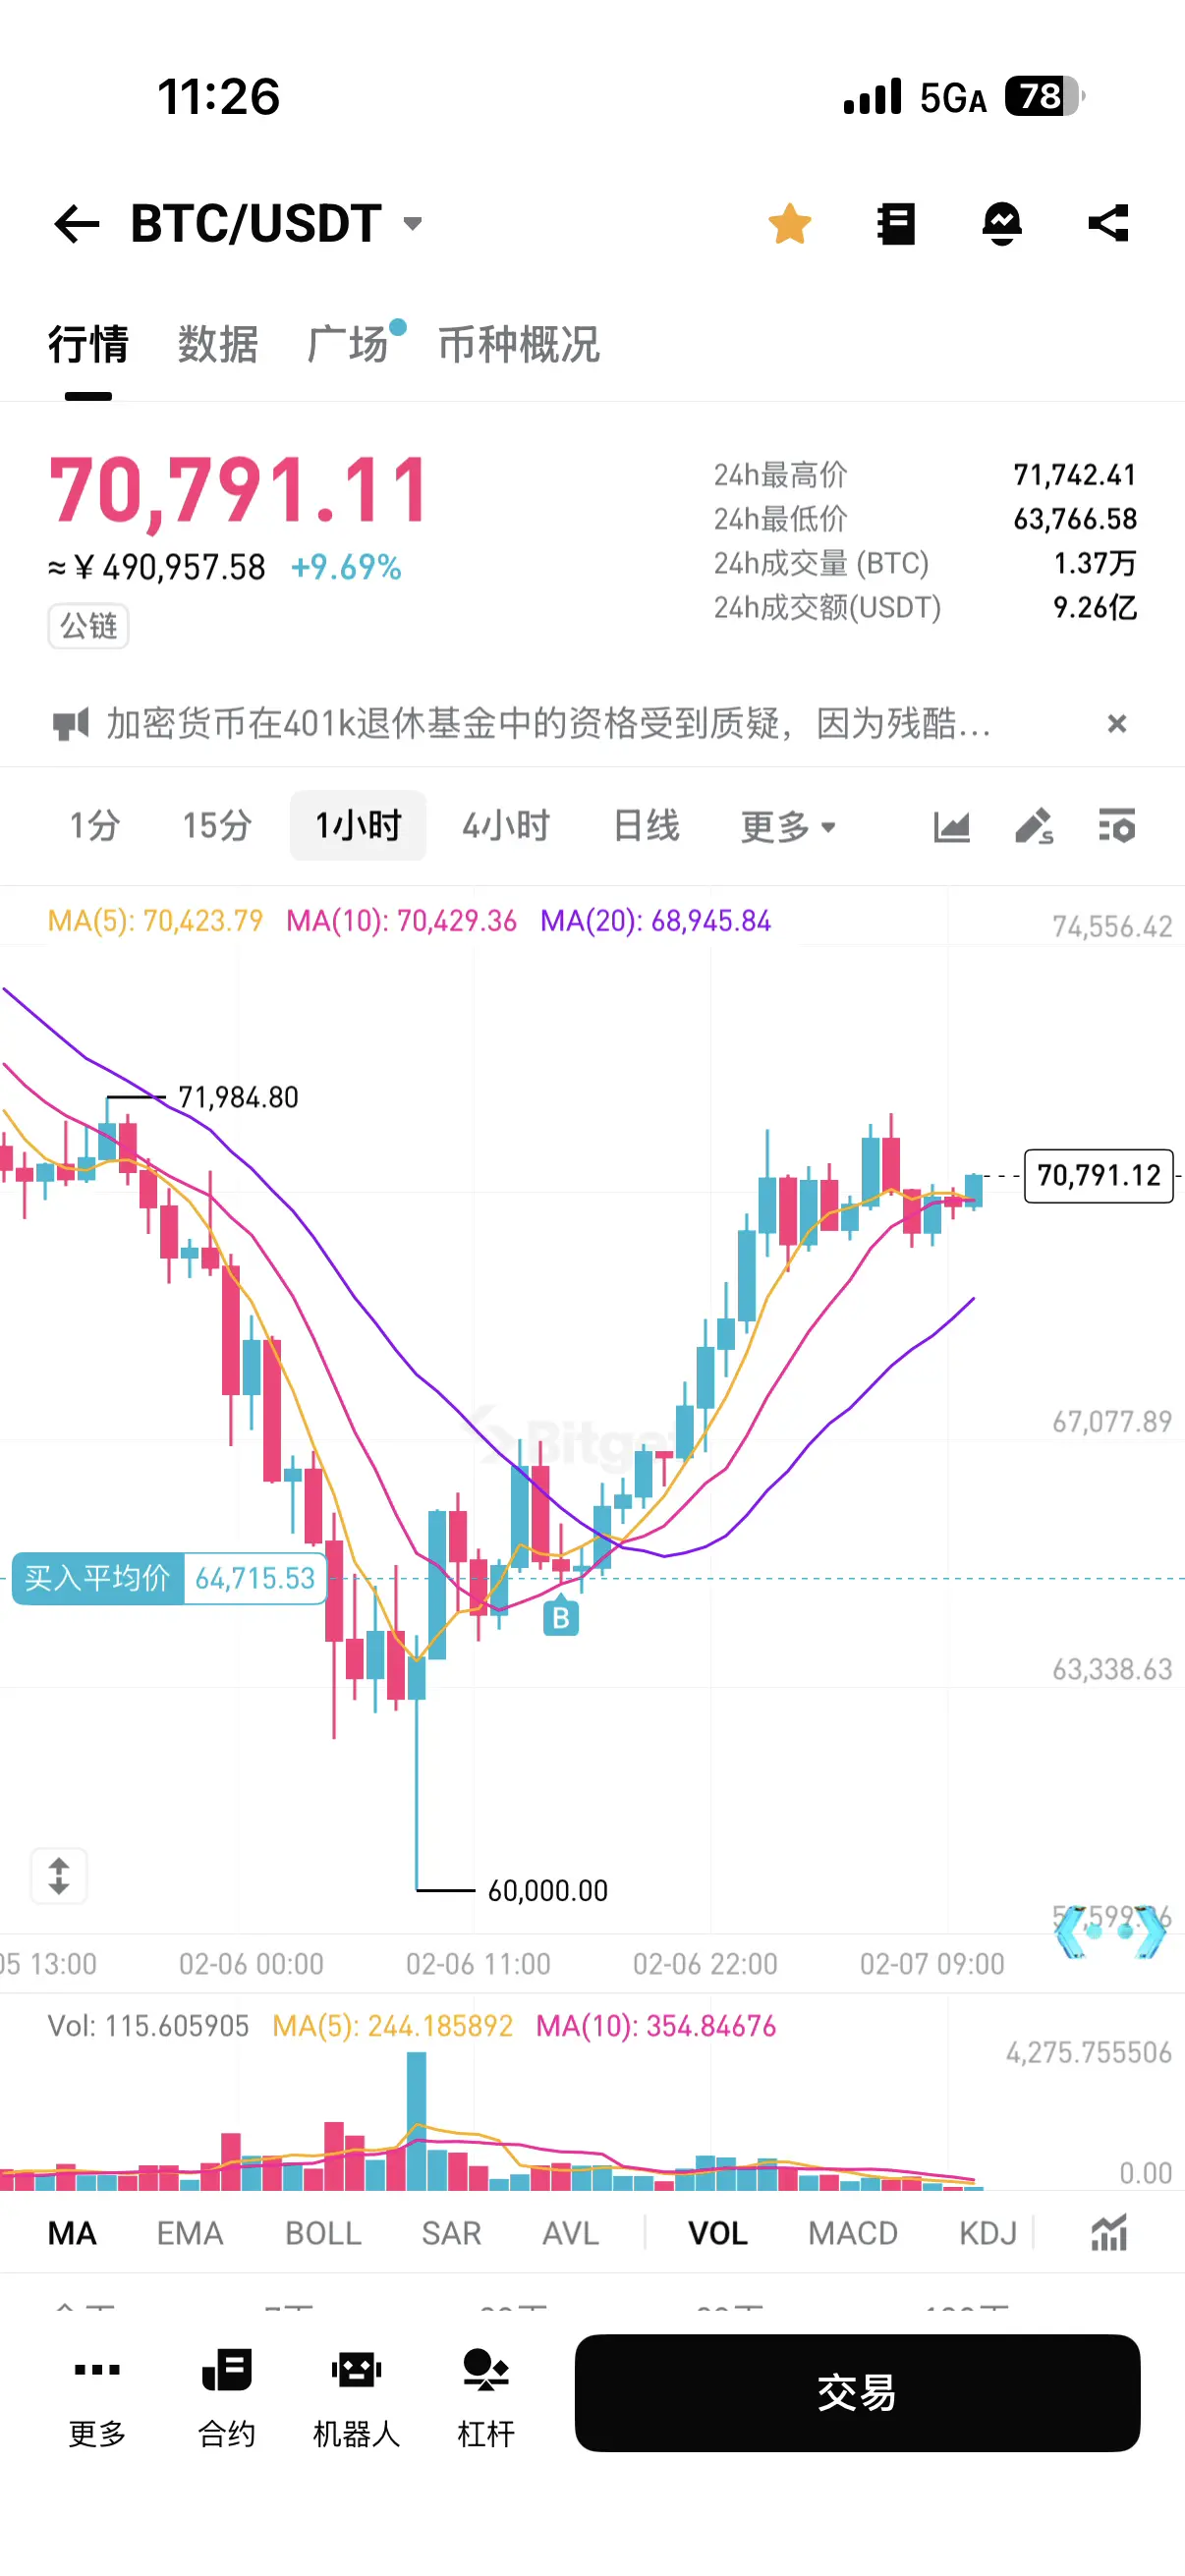
- Intraday Rhythm: On February 7th, the market approached breaking below the $60,000 level (the first time since October 2024), then quickly rebounded, reaching $71,469, nearly recovering all losses from February 6th (Thursday), when the price plummeted over 13% in a single day
- 7-Day Performance: The past 7 days saw a total decline of 16%, showing a "sharp drop and quick rebound" pattern. Global liquidation amounts within 24 hours reached
1. Short-Term Trends (Intraday and Last 7 Days): Sharp rebound after a crash, increased volatility
- Intraday Rhythm: On February 7th, the market approached breaking below the $60,000 level (the first time since October 2024), then quickly rebounded, reaching $71,469, nearly recovering all losses from February 6th (Thursday), when the price plummeted over 13% in a single day
- 7-Day Performance: The past 7 days saw a total decline of 16%, showing a "sharp drop and quick rebound" pattern. Global liquidation amounts within 24 hours reached

- Reward
- 1
- 1
- Repost
- Share
Luna_Star:
Buy To Earn 💎T4SB
爹你马币
Created By@GateUser-367d8cb6
Listing Progress
0.00%
MC:
$2.46K
Create My Token
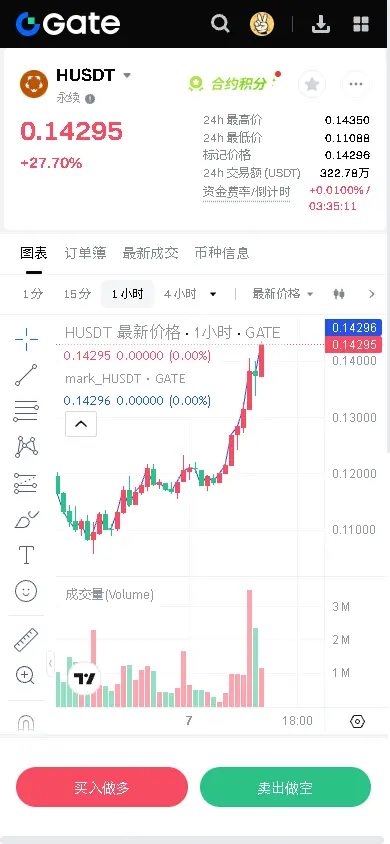
【$H Signal】Long | Healthy Cooldown After Massive Breakout
After completing a massive breakout on the 4-hour chart, the price consolidates in a narrow range at high levels. This is a typical strong cooldown pattern, not a top.
🎯Direction: Long
🎯Entry: 0.1375 - 0.1380
🛑Stop Loss: 0.1242 $H Rigid stop loss, below the previous breakout candle's low(
🚀Target 1: 0.1500
🚀Target 2: 0.1650
Hardcore Logic: The previous 4H candle experienced a surge in volume (61.69M), with the price rising from 0.1271 to 0.1409, clearly signaling main force entry. Subsequently, the candle consolidates in a very tig
View OriginalAfter completing a massive breakout on the 4-hour chart, the price consolidates in a narrow range at high levels. This is a typical strong cooldown pattern, not a top.
🎯Direction: Long
🎯Entry: 0.1375 - 0.1380
🛑Stop Loss: 0.1242 $H Rigid stop loss, below the previous breakout candle's low(
🚀Target 1: 0.1500
🚀Target 2: 0.1650
Hardcore Logic: The previous 4H candle experienced a surge in volume (61.69M), with the price rising from 0.1271 to 0.1409, clearly signaling main force entry. Subsequently, the candle consolidates in a very tig
- Reward
- like
- Comment
- Repost
- Share
- Reward
- like
- Comment
- Repost
- Share
- Reward
- like
- Comment
- Repost
- Share
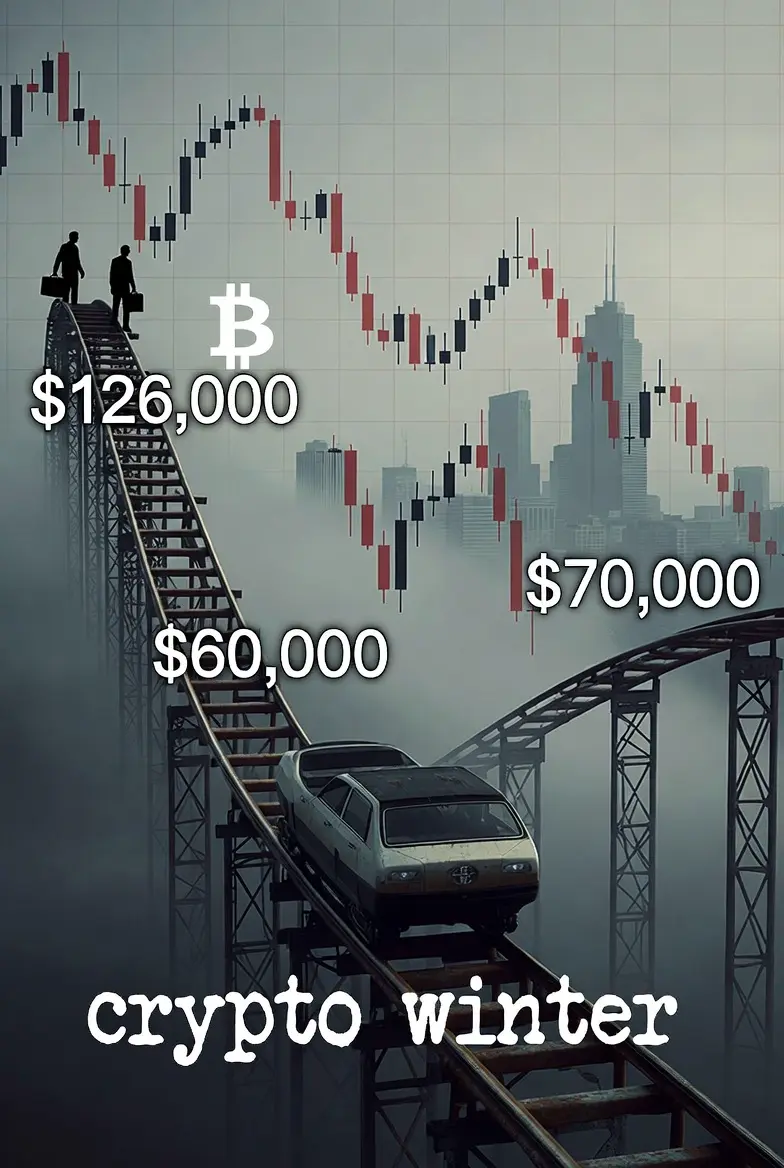
6K is not a support level; it's an emotional touchstone
BTC is oscillating around 60,000, and many people are watching the candlestick charts for direction. In fact, the market's real test isn't the strength of the support but the psychological resilience of the holders. Every correction is essentially a screening race for trading discipline. A bull market tests courage; a correction tests rationality. #Crypto Survival Guide
1️⃣ Survival First
My top priority right now isn't making money but controlling drawdowns. Actively reducing positions, holding cash, setting stop-losses—these are more
BTC6,57%


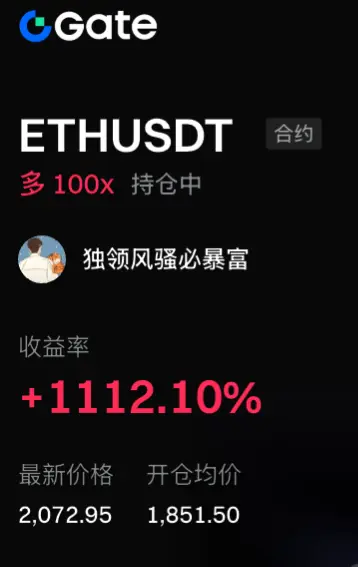
[The user has shared his/her trading data. Go to the App to view more.]
- Reward
- 1
- Comment
- Repost
- Share
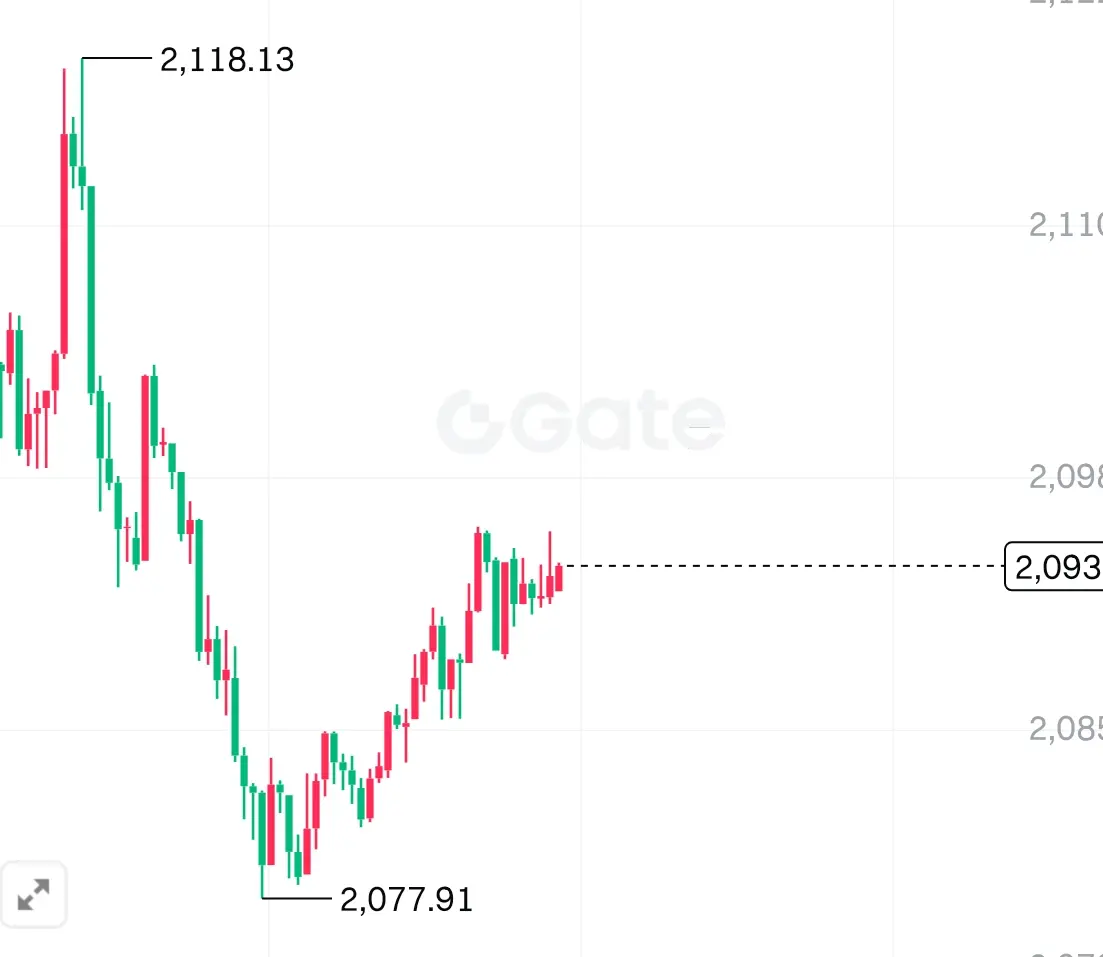
Ethereum 2120 is cleared, so reduce your position or take profits in time. In the future, the trading master will no longer remind you of this small operation. Just wait at the order placement position set last night. #美联储人事与宏观政策影响
ETH7,77%

- Reward
- 1
- 10
- Repost
- Share
GateUser-b1747979 :
:
2026 Go Go Go 👊View More


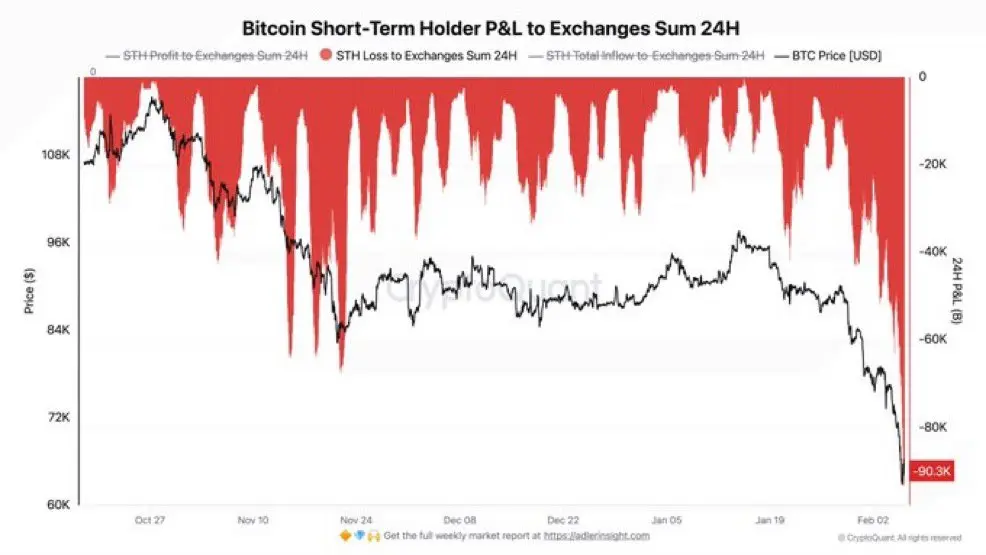
90,300 $BTC in losses. 📉
We are witnessing a historic Short-Term Holder capitulation. With over $2.6 billion in long liquidations, the "weak hands" aren't just folding—they’re being flushed out in the largest deleveraging event of 2026.
When the sea of red on-chain looks this deep, the bottom is usually nearby.
#Bitcoin #Crypto #Capitulation #BTC
BTC6,57%
- Reward
- 1
- 1
- Repost
- Share
Unoshi:
Thanks for sharing#CryptoSurvivalGuide My Crypto Survival Guide Weekend BTC Strategy
With markets under pressure and BTC fighting to hold the $60K level, this weekend is more about survival than aggression. When volatility rises and sentiment turns fearful, my focus shifts from chasing moves to protecting capital and staying disciplined.
In the current market environment, my clear preference is to hold rather than panic exit or aggressively short. With BTC hovering around the $60K psychological zone, price action suggests uncertainty rather than confirmation of a sustained breakdown. Selling into fear often lea
BTC6,57%

- Reward
- 3
- 4
- Repost
- Share
AYATTAC:
2026 GOGOGO 👊View More
Load More
Join 40M users in our growing community
⚡️ Join 40M users in the crypto craze discussion
💬 Engage with your favorite top creators
👍 See what interests you
Trending Topics
View More123.45K Popularity
24.08K Popularity
390.06K Popularity
9.74K Popularity
8.27K Popularity
Hot Gate Fun
View More- MC:$2.46KHolders:10.00%
- MC:$2.46KHolders:10.00%
- MC:$0.1Holders:00.00%
- MC:$0.1Holders:10.00%
- MC:$2.48KHolders:00.00%
News
View MoreAave founder sold 1,700 ETH and bought 30,727 AAVE in the past 13 hours.
13 m
Whale @loraclexyz Opens 20x Short Positions on BTC and ETH, Total Profit Exceeds $32M
26 m
Arthur Hayes: The sharp decline may stem from traders hedging positions with IBIT, seeking potential trigger points for extreme volatility.
48 m
Data: 68,600 SOL transferred from an anonymous address, valued at approximately $6,036,300 USD.
52 m
Data: 157.24 BTC transferred from an anonymous address, routed through a relay, and then flowed into Deribit.
52 m
Pin