


Mining_sLittleSheep

暗号資産の世界の百倍コインがたくさんあるように見えても、十倍を得られるのはごく少数です。理解していないと持ち続けられず、理解しても持ち続けられません。だから、あまり神話を聞かない方がいいです。本当に、一つのコインで十倍の利益が出たら満足すべきです。物語は聞くだけでいいです。フォローしてください。ここでは暗号資産の世界だけでなく、他にももっと面白いことがたくさんあります!!
Mining_sLittleSheep
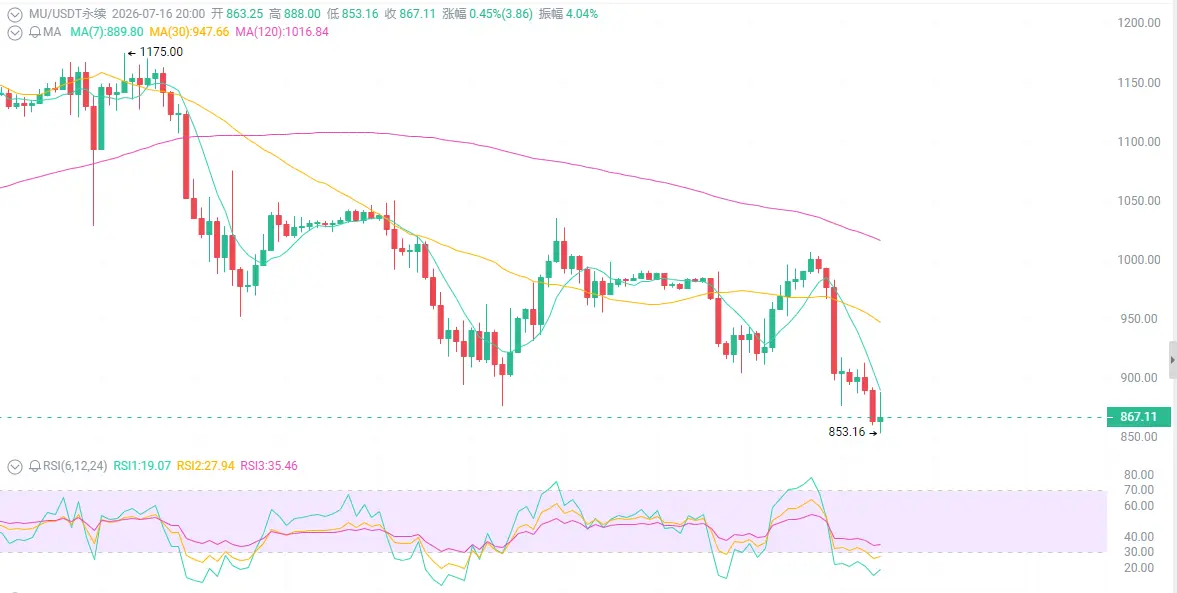
867ドルのMU、あなたは思い切って下値追いするのか?
まず表面から:悪材料が大砲のように連打され、恐慌の踏み倒し。
6月の過去最高値1255から30%急落して852に。さらに当日も4〜5%下落し、5日で10%以上下落、1カ月で20%以上の下げ。出来高が明らかに増加し、ロングは血の海。チャートが告げるのはこうだ:850は50日移動平均のサポート+ダブルボトムの芽。RSIは過熱(買われすぎ)から中立まで戻し、恐怖は極限。リバウンドはもうすぐだ。
第一のこと:韓国勢が注文を奪ってる?それ、あなたがリズムに乗せられているだけかもしれない。
中国CXMTの競争、SKハイニックスのIPOによる資金吸い上げ——メディアが悪材料を全部あなたの顔に投げつけて、「マイクロンは終わりだ」と思わせる。
でもよく見て——マイクロンは高通、デンソー、現代モービスと、長年のAIメモリ供給契約を結んだばかり。大口顧客が長期契約を結ぶ、これは何を意味する? 生産能力はすでに押さえられているということだ。
同じニュースでも、1回目は投げ売り、2回目は市場がそのまま無視。これが「過度な恐慌」ってやつだ。個人投資家がまだ狂ったように損切りしている一方で、KeyBancは目標株価を1750に引き上げた。
第二のこと:HBMはAIの「チップボトルネック」、マイクロンは唯一の米国勢。
AIチップがどれだけ強くても、HBMの高
原文表示まず表面から:悪材料が大砲のように連打され、恐慌の踏み倒し。
6月の過去最高値1255から30%急落して852に。さらに当日も4〜5%下落し、5日で10%以上下落、1カ月で20%以上の下げ。出来高が明らかに増加し、ロングは血の海。チャートが告げるのはこうだ:850は50日移動平均のサポート+ダブルボトムの芽。RSIは過熱(買われすぎ)から中立まで戻し、恐怖は極限。リバウンドはもうすぐだ。
第一のこと:韓国勢が注文を奪ってる?それ、あなたがリズムに乗せられているだけかもしれない。
中国CXMTの競争、SKハイニックスのIPOによる資金吸い上げ——メディアが悪材料を全部あなたの顔に投げつけて、「マイクロンは終わりだ」と思わせる。
でもよく見て——マイクロンは高通、デンソー、現代モービスと、長年のAIメモリ供給契約を結んだばかり。大口顧客が長期契約を結ぶ、これは何を意味する? 生産能力はすでに押さえられているということだ。
同じニュースでも、1回目は投げ売り、2回目は市場がそのまま無視。これが「過度な恐慌」ってやつだ。個人投資家がまだ狂ったように損切りしている一方で、KeyBancは目標株価を1750に引き上げた。
第二のこと:HBMはAIの「チップボトルネック」、マイクロンは唯一の米国勢。
AIチップがどれだけ強くても、HBMの高
- 報酬
- いいね
- コメント
- リポスト
- 共有
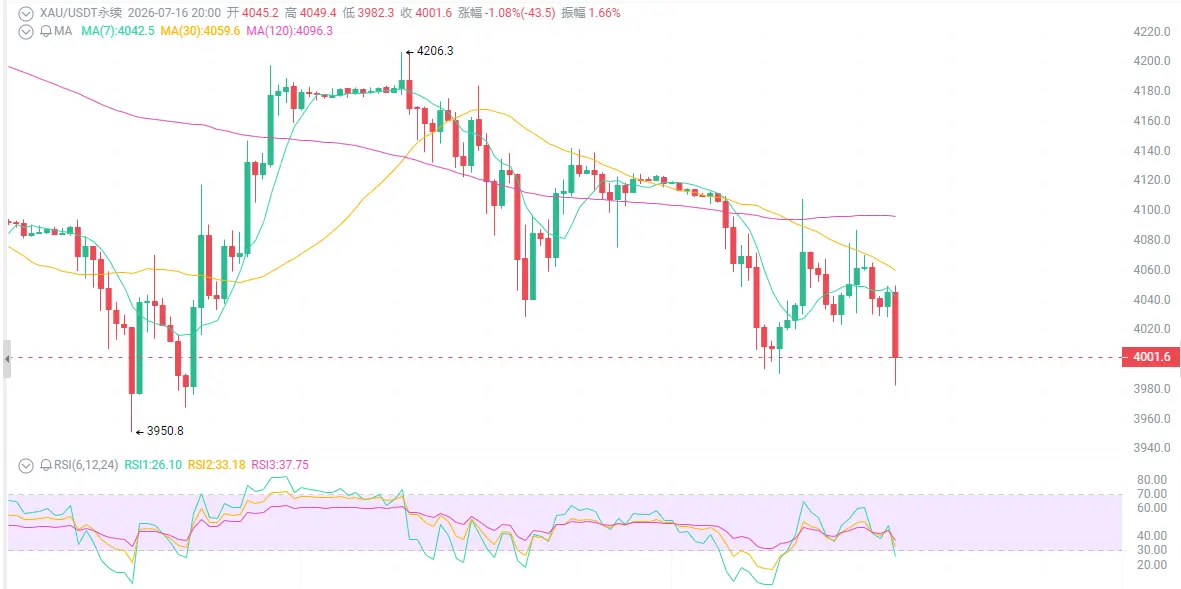
3995ドルの金は、買い増し(底値で掴む)しますか?
まず表面だけ見ると:材料は出た。でも価格は上がらず、むしろ下落している。
7月14日の米国CPIは予想を大きく下回り、前年比は4.2%から3.5%へ。市場は即座に利上げ確率を引き下げ、金は瞬間的に1〜2%急騰。結果は?今日、1本の実体の大陰線で、4060から3973まで急落し、あらゆる反発分の上げを飲み込んだ。4120〜4130のレジスタンスは3回突破できず、今日の出来高を伴う下落でブレイクは偽突破と確認。4000の生死判断を待つ。
第一に:CPIがこんなに良いのに、なぜ金は上がらないのか?
6月CPIは前月比-0.4%、予想は-0.1%。コアCPIは前年比で2.6%まで低下。インフレ冷却のスピードは、誰の予想も超えた。つまりインフレが下がって、利上げが止まるなら、金はそのまま急上昇して当然のはず。
しかし市場は理屈を聞かない。これが「(上がる前の)期待を買って、(出た後の)事実を売る」。
CPIが出る前に、金はすでに5000+からずっと下げて、好材料を先回りで織り込んでいた。データが出た瞬間、短期資金は即座に利益確定――今日の大陰線がその証拠。
第二に:金のファンダメンタルズは、あなたが思うよりずっと強い。
インフレ冷却 ≠ 金の終わり。むしろ逆だ。本当のゴールド・ブル相場は、いつだって「インフレが後退+利下げ期待が高まる」段
原文表示まず表面だけ見ると:材料は出た。でも価格は上がらず、むしろ下落している。
7月14日の米国CPIは予想を大きく下回り、前年比は4.2%から3.5%へ。市場は即座に利上げ確率を引き下げ、金は瞬間的に1〜2%急騰。結果は?今日、1本の実体の大陰線で、4060から3973まで急落し、あらゆる反発分の上げを飲み込んだ。4120〜4130のレジスタンスは3回突破できず、今日の出来高を伴う下落でブレイクは偽突破と確認。4000の生死判断を待つ。
第一に:CPIがこんなに良いのに、なぜ金は上がらないのか?
6月CPIは前月比-0.4%、予想は-0.1%。コアCPIは前年比で2.6%まで低下。インフレ冷却のスピードは、誰の予想も超えた。つまりインフレが下がって、利上げが止まるなら、金はそのまま急上昇して当然のはず。
しかし市場は理屈を聞かない。これが「(上がる前の)期待を買って、(出た後の)事実を売る」。
CPIが出る前に、金はすでに5000+からずっと下げて、好材料を先回りで織り込んでいた。データが出た瞬間、短期資金は即座に利益確定――今日の大陰線がその証拠。
第二に:金のファンダメンタルズは、あなたが思うよりずっと強い。
インフレ冷却 ≠ 金の終わり。むしろ逆だ。本当のゴールド・ブル相場は、いつだって「インフレが後退+利下げ期待が高まる」段
- 報酬
- いいね
- コメント
- リポスト
- 共有
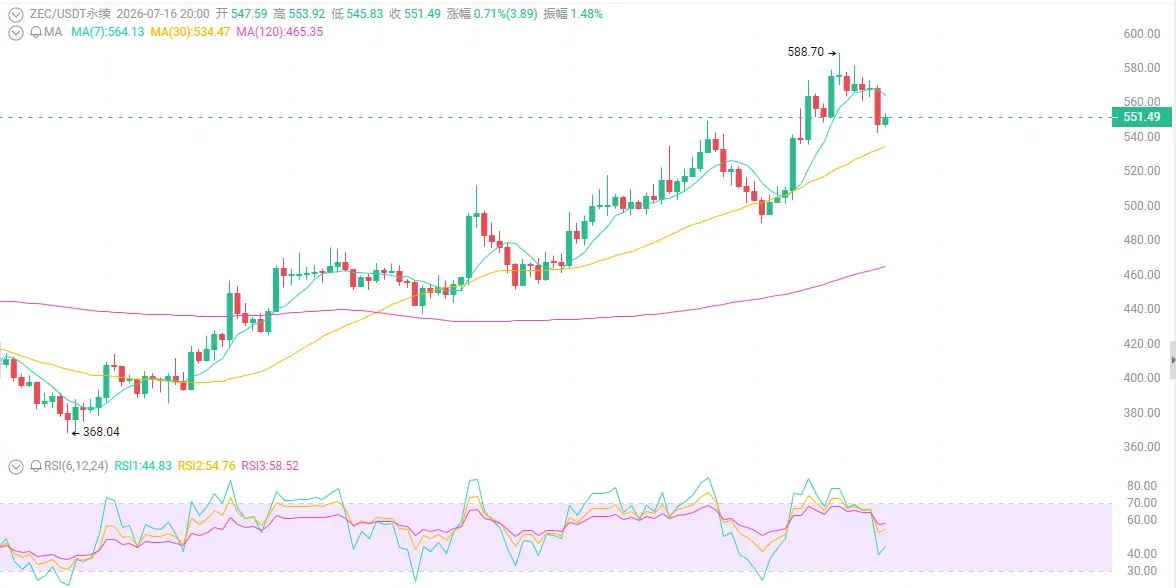
549ドルのZEC、買いますか?それとも見送りますか?
まず表面を見ると:追い風が止まらない。価格の硬さがとんでもない。
過去7日で約20%上昇し、6月末の安値から反発して56%超。現在は549-570のレンジで推移しており、時価総額は約95億ドル、24時間の出来高は5-6億ドル。ローソク足が告げるのはこれ:ZECはすべての主要移動平均線を取り戻している――26日、50日、100日、200日EMAすべてが上抜け。RSIが強まっており、出来高が拡大。強気の局面が確認され、トレンドはあなたの味方だ。
最初のポイント:アップグレードの前夜、旧プールの脆弱性こそ最大の“爆弾”であり最大の“チャンス”
7月28日、ZcashはIronwoodネットワークのアップグレード(NU6.3)を有効化。ブロック高は3,428,143。
今回のアップグレードで解決されたのは致命的な問題――5月に発見されたOrchardプライバシープールの“無限”脆弱性。簡単に言うと、旧プールの中で誰かがZECを空から生成していた。これこそがZcash最大の信頼危機。
2つ目のポイント:ETFはもうすぐ。機関投資家がこの“おいしい餌”を見ている
Grayscaleは、最初のプライバシーコイン現物ETF申請を提出済み。コードはZCSH。NYSE Arcaへの上場を計画している。史上初めて、資産運用会社がプライバシーコインの
原文表示まず表面を見ると:追い風が止まらない。価格の硬さがとんでもない。
過去7日で約20%上昇し、6月末の安値から反発して56%超。現在は549-570のレンジで推移しており、時価総額は約95億ドル、24時間の出来高は5-6億ドル。ローソク足が告げるのはこれ:ZECはすべての主要移動平均線を取り戻している――26日、50日、100日、200日EMAすべてが上抜け。RSIが強まっており、出来高が拡大。強気の局面が確認され、トレンドはあなたの味方だ。
最初のポイント:アップグレードの前夜、旧プールの脆弱性こそ最大の“爆弾”であり最大の“チャンス”
7月28日、ZcashはIronwoodネットワークのアップグレード(NU6.3)を有効化。ブロック高は3,428,143。
今回のアップグレードで解決されたのは致命的な問題――5月に発見されたOrchardプライバシープールの“無限”脆弱性。簡単に言うと、旧プールの中で誰かがZECを空から生成していた。これこそがZcash最大の信頼危機。
2つ目のポイント:ETFはもうすぐ。機関投資家がこの“おいしい餌”を見ている
Grayscaleは、最初のプライバシーコイン現物ETF申請を提出済み。コードはZCSH。NYSE Arcaへの上場を計画している。史上初めて、資産運用会社がプライバシーコインの
- 報酬
- いいね
- コメント
- リポスト
- 共有
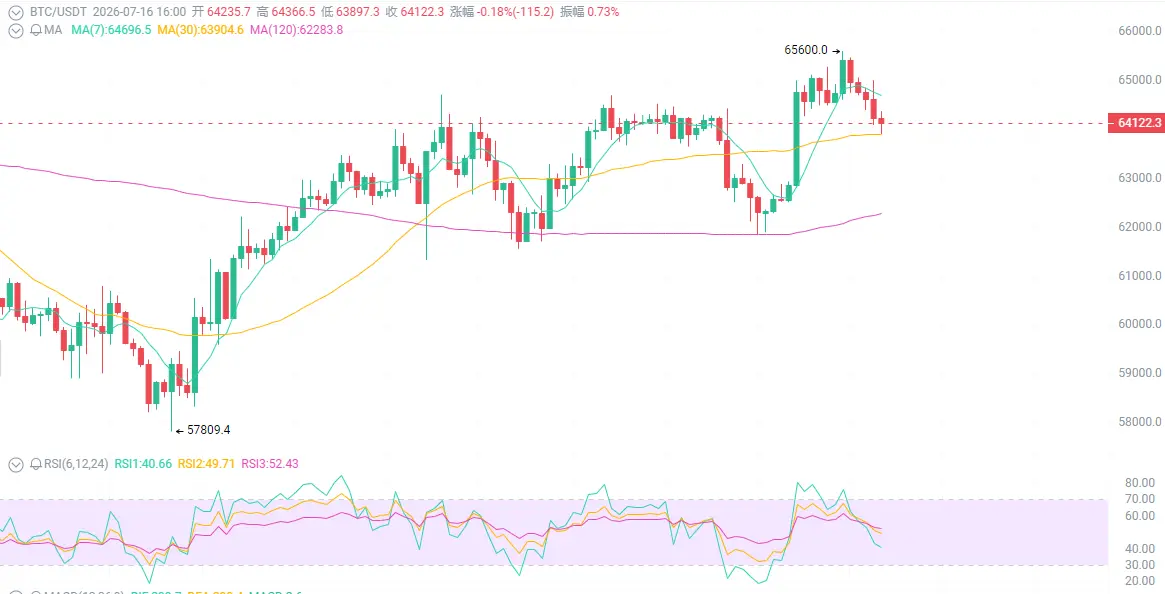
64,200ドルのBTC、まだ6万ドル割れを待ってるの?
まず表面から:下落が止まらず、個人投資家は絶望。
年初からの下落は26.71%。ATH 126,198から約50%下げた。24時間の値動きは約1,700ドルで、65.5kから地政学ニュースで64kへ叩き戻された。チャートが告げるのは:価格は50日EMA付近を推移中、RSIとMACDは中立、テクニカル評価は「強い売り」から「中立」へ——買い手と売り手の均衡で、転換は目前。
第一のこと:地政学が売り叩きしたけど、誰が売ってるのを見極めた?
イランが米軍基地を攻撃、BTCは65.5kから瞬時に急落。個人投資家は怖くなって損切り、全ネットのロングが強制決済された。
機関投資家は、イランがミサイルを数発撃っただけで3年の運用計画を変えない。変えるのは個人投資家だけ。
同じニュースでも、1回目は3%下げ、2回目は1%下げ、3回目は市場が直接無視した。これを「悪材料の鈍化」という。個人投資家はいまだに「第三次世界大戦」の恐怖でパニックに陥っているが、グレイスケールやブラックロックの買いが64k以下の指値をすでに食い尽くした。
第二のこと:インフレの追い風が「売りのニュース」によって隠されたが、あなたは騙されてる。
米インフレ指標が予想より弱く、BTCは65kへ上昇したのに、その後「売りのニュース」で64kへ叩き戻された。
追い風が出たら、
原文表示まず表面から:下落が止まらず、個人投資家は絶望。
年初からの下落は26.71%。ATH 126,198から約50%下げた。24時間の値動きは約1,700ドルで、65.5kから地政学ニュースで64kへ叩き戻された。チャートが告げるのは:価格は50日EMA付近を推移中、RSIとMACDは中立、テクニカル評価は「強い売り」から「中立」へ——買い手と売り手の均衡で、転換は目前。
第一のこと:地政学が売り叩きしたけど、誰が売ってるのを見極めた?
イランが米軍基地を攻撃、BTCは65.5kから瞬時に急落。個人投資家は怖くなって損切り、全ネットのロングが強制決済された。
機関投資家は、イランがミサイルを数発撃っただけで3年の運用計画を変えない。変えるのは個人投資家だけ。
同じニュースでも、1回目は3%下げ、2回目は1%下げ、3回目は市場が直接無視した。これを「悪材料の鈍化」という。個人投資家はいまだに「第三次世界大戦」の恐怖でパニックに陥っているが、グレイスケールやブラックロックの買いが64k以下の指値をすでに食い尽くした。
第二のこと:インフレの追い風が「売りのニュース」によって隠されたが、あなたは騙されてる。
米インフレ指標が予想より弱く、BTCは65kへ上昇したのに、その後「売りのニュース」で64kへ叩き戻された。
追い風が出たら、
- 報酬
- いいね
- コメント
- リポスト
- 共有
取引所のETHがまもなく出し抜かれるように持ち出され尽くされるのに、あなたはまだ気づいてないの?
まず表面を見る:ぬるい値動き、個人投資家はぼんやりして眠そう。
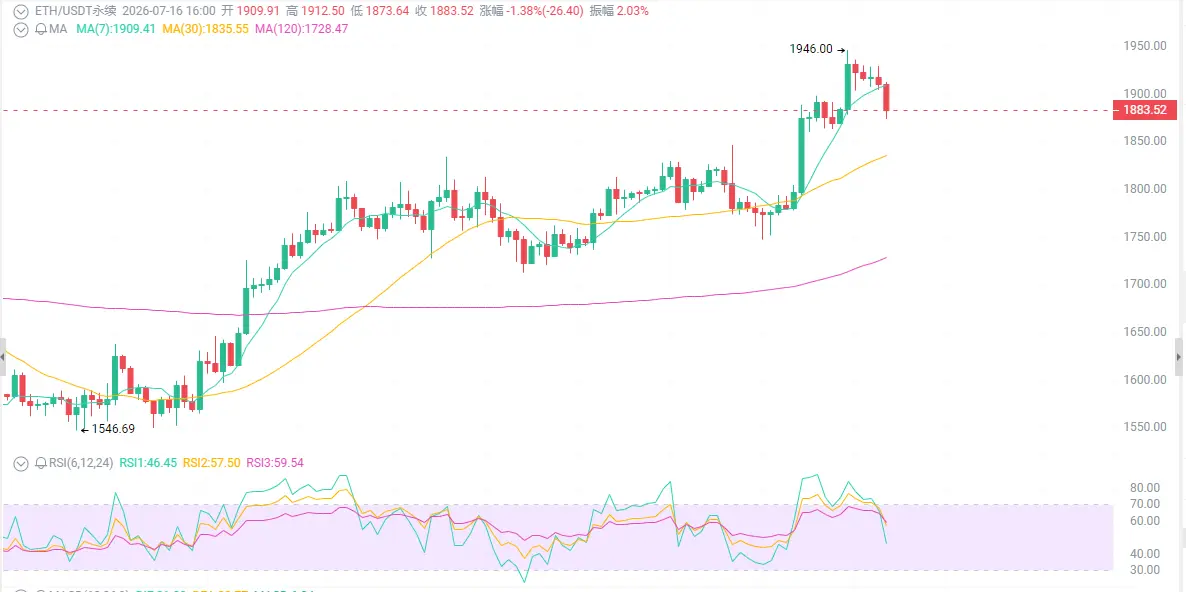
過去24時間の変動は2%未満、7日で+8%、30日で+5%。価格は1880〜1920ドルの狭いレンジで上下している。上にも下にも行かず、ぬるいまま、まるで死んだ魚みたいだ。
あなたは「ETH終わった、2000すら上がらないじゃん」と思っているかもしれない。
まず1つ目:取引所のETHが、急速に持ち出されている。
データによると、取引所のETH保有残高は2016年以来の最低水準まで下がっている。同時に、3300万〜3700万枚のETHがステーキングでロックされ、流通供給の30%以上を占めている。
取引所にあるコインが少ないほど、売り崩しに使える量も少なくなる
ステーキングでロックされているコインが多いほど、市場で買える流通量が減る
需給が引き締まれば、価格の方向性は1つ――上がる
2つ目:賢い資金が戻ってきた。
Morgan Stanleyがイーサリアム関連ETFの改訂書類を提出――機関投資家が追加で踏み込んでいる
Arthur Hayesが安値でETHを買い戻し――最も牛熊をわかっている人が動いた
Robinhoodが自社のL2ブロックチェーンをリリース――伝統的な金融までがイーサリアムのエコシステムを利用しに来て
原文表示まず表面を見る:ぬるい値動き、個人投資家はぼんやりして眠そう。
過去24時間の変動は2%未満、7日で+8%、30日で+5%。価格は1880〜1920ドルの狭いレンジで上下している。上にも下にも行かず、ぬるいまま、まるで死んだ魚みたいだ。
あなたは「ETH終わった、2000すら上がらないじゃん」と思っているかもしれない。
まず1つ目:取引所のETHが、急速に持ち出されている。
データによると、取引所のETH保有残高は2016年以来の最低水準まで下がっている。同時に、3300万〜3700万枚のETHがステーキングでロックされ、流通供給の30%以上を占めている。
取引所にあるコインが少ないほど、売り崩しに使える量も少なくなる
ステーキングでロックされているコインが多いほど、市場で買える流通量が減る
需給が引き締まれば、価格の方向性は1つ――上がる
2つ目:賢い資金が戻ってきた。
Morgan Stanleyがイーサリアム関連ETFの改訂書類を提出――機関投資家が追加で踏み込んでいる
Arthur Hayesが安値でETHを買い戻し――最も牛熊をわかっている人が動いた
Robinhoodが自社のL2ブロックチェーンをリリース――伝統的な金融までがイーサリアムのエコシステムを利用しに来て
- 報酬
- 1
- コメント
- 1
- 共有
66米美元的HYPE、あなたは怖いのか、それとも興奮してる?
まず表面を見ると:高いところでのレンジ相場、多空ともに迷い。
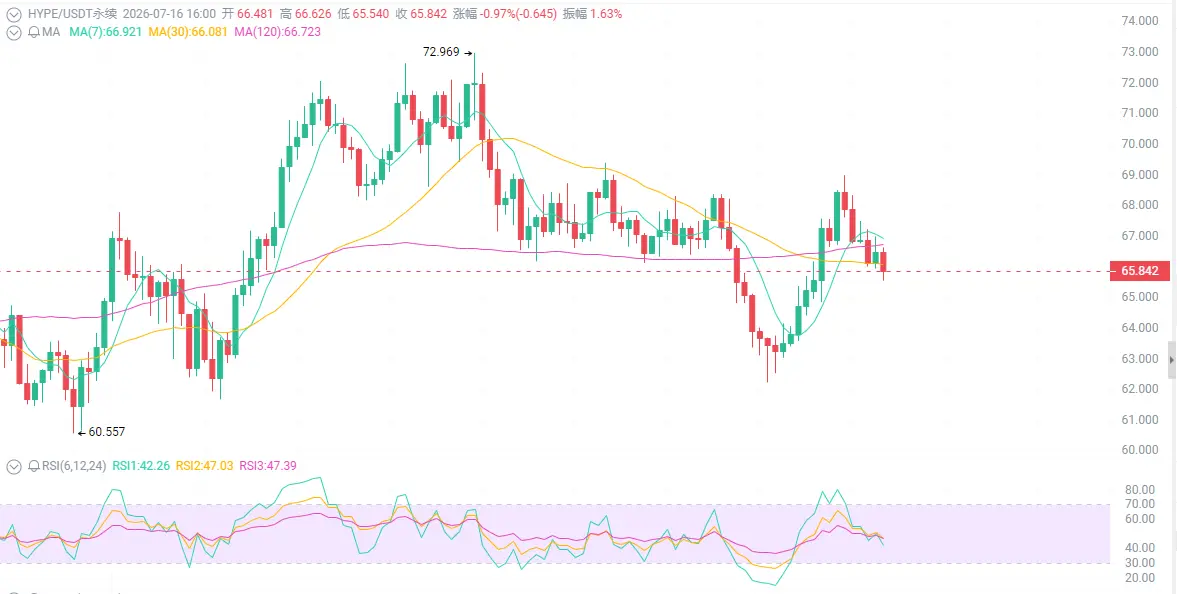
過去1か月で6.5%上昇したが、ATH 76.85から14%下落して66付近で横ばい。24時間は微減1%、7日で-1.6%。上でも下でもなく、ジリジリして気が滅入る。ローソク足が教えてるのは:4時間足の200 EMAがしっかり支えていて、日足では看張り三角フラッグが形成される可能性。RSI/MACDは中立寄りで強気、溜め込みは終盤に達しており、転換は間もなく。
最初のこと:1.16億ドルのリパーチェス(買い戻し)を行うのに、あなたはローソク足を見て無駄にパニックになってる。
あなたがHYPEで1回取引するたびに、お金はHYPEを買うために使われる
すでに累計で1.16億ドルを買い戻している——これは絵空事じゃなくて、実弾だ
取引所の取引量が高いほど、買い戻しの強度も大きくなり、価格には下支えが効く
個人はまだ戸口の絵を描いて、ローソク足を見て、天井底を当てようとしてるけど、賢い資金はすでに計算済み:Hyperliquidの取引量が高水準を維持する限り、HYPEには途切れない買い注文が入ってくる。
2つ目のこと:コンプライアンス+エコシステムの実装、機関がこっそり布陣中。
HYPEがSECのデリバティブ政策に関する会議に参加。アフリカの大手取引所がHyperli
原文表示まず表面を見ると:高いところでのレンジ相場、多空ともに迷い。
過去1か月で6.5%上昇したが、ATH 76.85から14%下落して66付近で横ばい。24時間は微減1%、7日で-1.6%。上でも下でもなく、ジリジリして気が滅入る。ローソク足が教えてるのは:4時間足の200 EMAがしっかり支えていて、日足では看張り三角フラッグが形成される可能性。RSI/MACDは中立寄りで強気、溜め込みは終盤に達しており、転換は間もなく。
最初のこと:1.16億ドルのリパーチェス(買い戻し)を行うのに、あなたはローソク足を見て無駄にパニックになってる。
あなたがHYPEで1回取引するたびに、お金はHYPEを買うために使われる
すでに累計で1.16億ドルを買い戻している——これは絵空事じゃなくて、実弾だ
取引所の取引量が高いほど、買い戻しの強度も大きくなり、価格には下支えが効く
個人はまだ戸口の絵を描いて、ローソク足を見て、天井底を当てようとしてるけど、賢い資金はすでに計算済み:Hyperliquidの取引量が高水準を維持する限り、HYPEには途切れない買い注文が入ってくる。
2つ目のこと:コンプライアンス+エコシステムの実装、機関がこっそり布陣中。
HYPEがSECのデリバティブ政策に関する会議に参加。アフリカの大手取引所がHyperli
- 報酬
- いいね
- コメント
- リポスト
- 共有
CPIが4年ぶりの最大下げ幅、ウォッシュは「不満だ」と言う
昨日、暗号資産界全体がシャンパンを開けていた。
米国の6月CPIは前月比で0.4%下落し、2020年4月以来の最大の単月下げ幅となった。コアCPIは前年比2.6%で、予想の2.8%を下回った。続いてPPIも予想外に冷え込み、前年比5.5%で、予想の6.2%を大きく下回った。
データが出ると、ビットコインは63,000ドルからそのまま65,000ドル付近まで引き戻された。NASDAQは約1ポイント上昇した。市場は叫ぶ――「インフレが反転した!利上げが消えた!ブル相場が戻ってきた!」
そしてウォッシュが登壇した。
この新任のFRB議長は、全米の前でこう言った。
「私は、どのインフレ指標にも満足していない。」
満足していない。
CPIは4年ぶりの最大下げ幅だ。あなたは不満だ。コアCPIが2.6%まで下がった。あなたは不満だ。PPIが全面的に予想を下回った。それでもあなたは不満だ。
いったい、データが見えていないのか、それともそもそも見たくないのか?
ウォッシュの原文はこうだ。「足元のインフレデータは、潜在的なインフレの状況を完璧に反映しているわけではない」。さらにこう付け加えた――FRBはすでに63か月連続で2%のインフレ目標を達成できていない。
63か月。5年超だ。
一回だけ合格点を取っただけで、過去5年ずっと全部不合格なのに
原文表示昨日、暗号資産界全体がシャンパンを開けていた。
米国の6月CPIは前月比で0.4%下落し、2020年4月以来の最大の単月下げ幅となった。コアCPIは前年比2.6%で、予想の2.8%を下回った。続いてPPIも予想外に冷え込み、前年比5.5%で、予想の6.2%を大きく下回った。
データが出ると、ビットコインは63,000ドルからそのまま65,000ドル付近まで引き戻された。NASDAQは約1ポイント上昇した。市場は叫ぶ――「インフレが反転した!利上げが消えた!ブル相場が戻ってきた!」
そしてウォッシュが登壇した。
この新任のFRB議長は、全米の前でこう言った。
「私は、どのインフレ指標にも満足していない。」
満足していない。
CPIは4年ぶりの最大下げ幅だ。あなたは不満だ。コアCPIが2.6%まで下がった。あなたは不満だ。PPIが全面的に予想を下回った。それでもあなたは不満だ。
いったい、データが見えていないのか、それともそもそも見たくないのか?
ウォッシュの原文はこうだ。「足元のインフレデータは、潜在的なインフレの状況を完璧に反映しているわけではない」。さらにこう付け加えた――FRBはすでに63か月連続で2%のインフレ目標を達成できていない。
63か月。5年超だ。
一回だけ合格点を取っただけで、過去5年ずっと全部不合格なのに
- 報酬
- いいね
- コメント
- リポスト
- 共有
韓国の利上げで貫き抜かれるのはKOSPIだけではなく、アルトコインの「流動性ポンプ」でもある
K線チャートだけを見ていないで。隣の韓国で何が起きているか見てみよう――これは市場をまたいで伝播している、流動性大脱走のサバイバルだ。
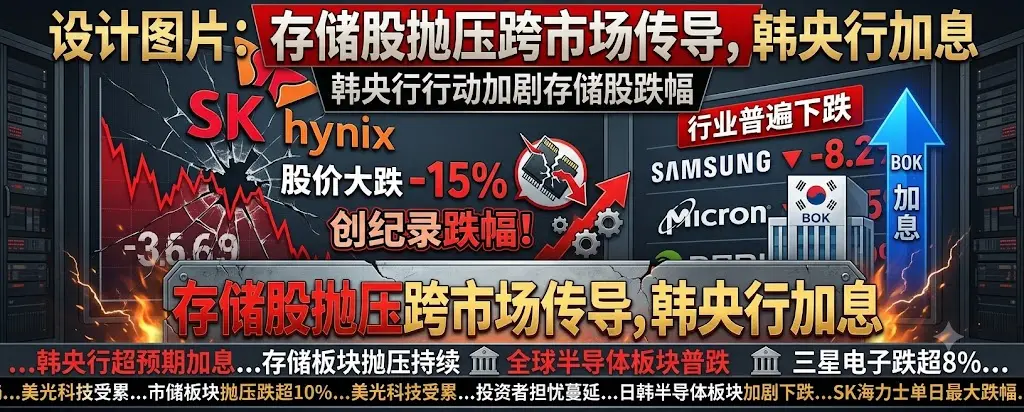
7月16日未明、米国の主要3指数はそろって上昇し、穏やかな空気だった。だが、ストレージ・チップ関連セクターは逆行して急落した:SKハイニックスADRは9%安、サンディスクは8%安、ウエスタン・デジタルは8.7%超安、マイクロンは8%安。
これは半導体の話だけだと思っているの?
同日朝、韓国銀行は利上げを25ベーシスポイント、2.75%まで行うと発表。3年半以来、初の利上げだ。インフレはもう抑えきれない――韓国の6月CPIは前年比で3.2%上昇し、4カ月連続で中央銀行の2%目標を上回っている。
利上げの知らせが出ると、KOSPI指数は日中に6.72%急落し、6800ポイントを割り込んだ。韓国取引所は直ちに臨時停止(サーキットブレーカー)メカニズムを発動し、プログラム取引を停止した。
SKハイニックスは日中に11%超安、サムスン電子は9%安。日経も崩れ、エレクトロニクス(Lite-On / キオクシア?)ではなく、日本株の「ケイパス」……いや、ここは原文の企業名のままでよいはずだが、原文は「铠侠」なので――(※原文のまま)キオクシアは15%超の急落。これは韓国
原文表示K線チャートだけを見ていないで。隣の韓国で何が起きているか見てみよう――これは市場をまたいで伝播している、流動性大脱走のサバイバルだ。
7月16日未明、米国の主要3指数はそろって上昇し、穏やかな空気だった。だが、ストレージ・チップ関連セクターは逆行して急落した:SKハイニックスADRは9%安、サンディスクは8%安、ウエスタン・デジタルは8.7%超安、マイクロンは8%安。
これは半導体の話だけだと思っているの?
同日朝、韓国銀行は利上げを25ベーシスポイント、2.75%まで行うと発表。3年半以来、初の利上げだ。インフレはもう抑えきれない――韓国の6月CPIは前年比で3.2%上昇し、4カ月連続で中央銀行の2%目標を上回っている。
利上げの知らせが出ると、KOSPI指数は日中に6.72%急落し、6800ポイントを割り込んだ。韓国取引所は直ちに臨時停止(サーキットブレーカー)メカニズムを発動し、プログラム取引を停止した。
SKハイニックスは日中に11%超安、サムスン電子は9%安。日経も崩れ、エレクトロニクス(Lite-On / キオクシア?)ではなく、日本株の「ケイパス」……いや、ここは原文の企業名のままでよいはずだが、原文は「铠侠」なので――(※原文のまま)キオクシアは15%超の急落。これは韓国
- 報酬
- いいね
- コメント
- リポスト
- 共有
CPIがマイナス成長+PPIが崩壊、美聯準備制度(FRB)もまだ強がっている——
この「データが言質を取る」芝居で、BTCが勝ちまくっている
7月14日、CPIが6年ぶりに前月比マイナス成長。
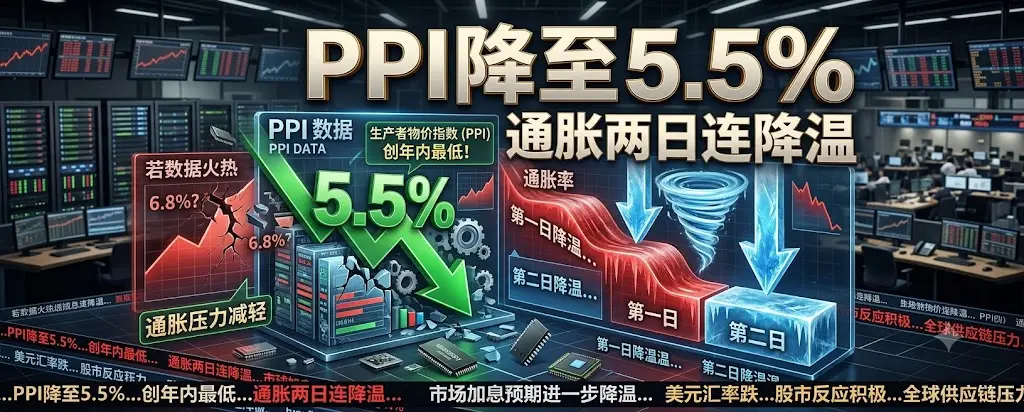
7月15日、PPIは前年比5.5%で、予想6.2%――そのまま全てのアナリストの顔を吹き飛ばした。前月比は-0.3%、2020年4月以来の最大の月間下げ幅。
2日間で、2つの指標。ビンタがビンタの連打。
で、次にFRBが何を言ったと思う?
ウォッシュ:「人によっては“ミッション完了”と言うかもしれないが、私はそうは見ていない。」
ウォーラーはさらに強硬:インフレが長く改善しないなら、利上げを検討すべきだ。
CPIのマイナス成長を認めない、PPIの崩壊を認めない。
まずデータを見て。
6月のCPIは前月比-0.4%、予想は-0.1%にすぎなかった。実際の下げ幅は予想の4倍。コアCPIは前年比2.6%で、予想2.8%。エネルギー価格は前月比で5.7%急落し、インフレを地面に押し付ける形になった。
PPIはさらに過激――前月比-0.3%で、予想は横ばい。コアPPIは前年比4.7%で、予想5.2%。
細かい点:4つのグループの直近の数値がすべて下方修正された。これは、過去数か月のデータが本来から上振れしていたこと、そして今の減速は想像以上に急だということを示している。
市場はそのまま発狂した。7月の
原文表示この「データが言質を取る」芝居で、BTCが勝ちまくっている
7月14日、CPIが6年ぶりに前月比マイナス成長。
7月15日、PPIは前年比5.5%で、予想6.2%――そのまま全てのアナリストの顔を吹き飛ばした。前月比は-0.3%、2020年4月以来の最大の月間下げ幅。
2日間で、2つの指標。ビンタがビンタの連打。
で、次にFRBが何を言ったと思う?
ウォッシュ:「人によっては“ミッション完了”と言うかもしれないが、私はそうは見ていない。」
ウォーラーはさらに強硬:インフレが長く改善しないなら、利上げを検討すべきだ。
CPIのマイナス成長を認めない、PPIの崩壊を認めない。
まずデータを見て。
6月のCPIは前月比-0.4%、予想は-0.1%にすぎなかった。実際の下げ幅は予想の4倍。コアCPIは前年比2.6%で、予想2.8%。エネルギー価格は前月比で5.7%急落し、インフレを地面に押し付ける形になった。
PPIはさらに過激――前月比-0.3%で、予想は横ばい。コアPPIは前年比4.7%で、予想5.2%。
細かい点:4つのグループの直近の数値がすべて下方修正された。これは、過去数か月のデータが本来から上振れしていたこと、そして今の減速は想像以上に急だということを示している。
市場はそのまま発狂した。7月の
- 報酬
- いいね
- コメント
- リポスト
- 共有
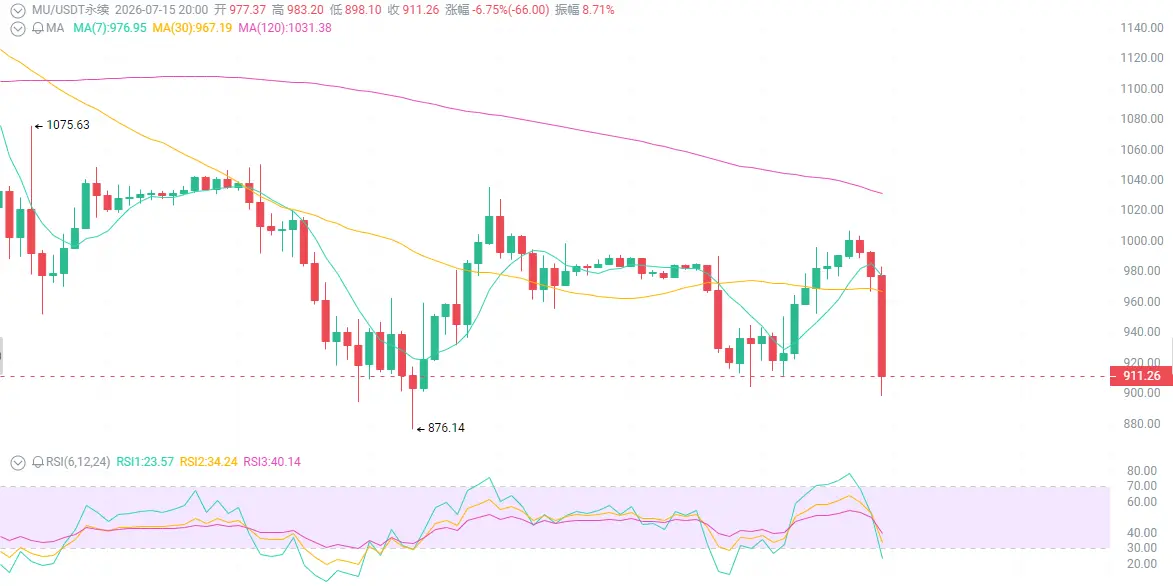
909米美元のMU、慌ててる?
まず表面だけ見ると:パニック売りの踏み上げ、個人投資家の絶望。
今日は単日で-7-8%、寄り付き975から900付近まで直撃で投げられた。52週高値1255からの下落はすでに-28%。日足は大きな陰線、短期MACDはデッドクロス、極度の恐慌。けれども基本面は一切変わっていない。
第一のこと:あなたはSKハイニックスを怖がっているけど、向こうもマイクロンを怖がっている。
今日下がった理由は何?SKハイニックスの増産のための資金調達+中国勢の競争への懸念。メモリ株が一斉に押し戻された。
MUのHBMの生産能力は、2026年にはすでに全部売り切れている。長期の戦略顧客との契約で価格決定権を固定、粗利率84%、売上は前年同期比で4倍。
顧客たちは我先にマイクロンへ送金している。送っても2026年末まで順番待ちにすら入れない。
それでもあなたは「競争が激化する」を心配しているの?ウォール街はもう計算している:HBMの需給ギャップは少なくとも2028年までは続く。SKハイニックスが増産?それは“ケーキ全体が大きくなる”のであって、マイクロンの取り分を奪いにいく話ではない。
第二のこと:決算が教えるのは、“お金を刷る機械”が何か。
6月24日Q3決算:売上は前年同期比で4倍+、粗利率は84%超、EPSは約44米ドル、PERは20倍のみ。
年間で40数米ドル/株を稼
原文表示まず表面だけ見ると:パニック売りの踏み上げ、個人投資家の絶望。
今日は単日で-7-8%、寄り付き975から900付近まで直撃で投げられた。52週高値1255からの下落はすでに-28%。日足は大きな陰線、短期MACDはデッドクロス、極度の恐慌。けれども基本面は一切変わっていない。
第一のこと:あなたはSKハイニックスを怖がっているけど、向こうもマイクロンを怖がっている。
今日下がった理由は何?SKハイニックスの増産のための資金調達+中国勢の競争への懸念。メモリ株が一斉に押し戻された。
MUのHBMの生産能力は、2026年にはすでに全部売り切れている。長期の戦略顧客との契約で価格決定権を固定、粗利率84%、売上は前年同期比で4倍。
顧客たちは我先にマイクロンへ送金している。送っても2026年末まで順番待ちにすら入れない。
それでもあなたは「競争が激化する」を心配しているの?ウォール街はもう計算している:HBMの需給ギャップは少なくとも2028年までは続く。SKハイニックスが増産?それは“ケーキ全体が大きくなる”のであって、マイクロンの取り分を奪いにいく話ではない。
第二のこと:決算が教えるのは、“お金を刷る機械”が何か。
6月24日Q3決算:売上は前年同期比で4倍+、粗利率は84%超、EPSは約44米ドル、PERは20倍のみ。
年間で40数米ドル/株を稼
- 報酬
- いいね
- コメント
- リポスト
- 共有
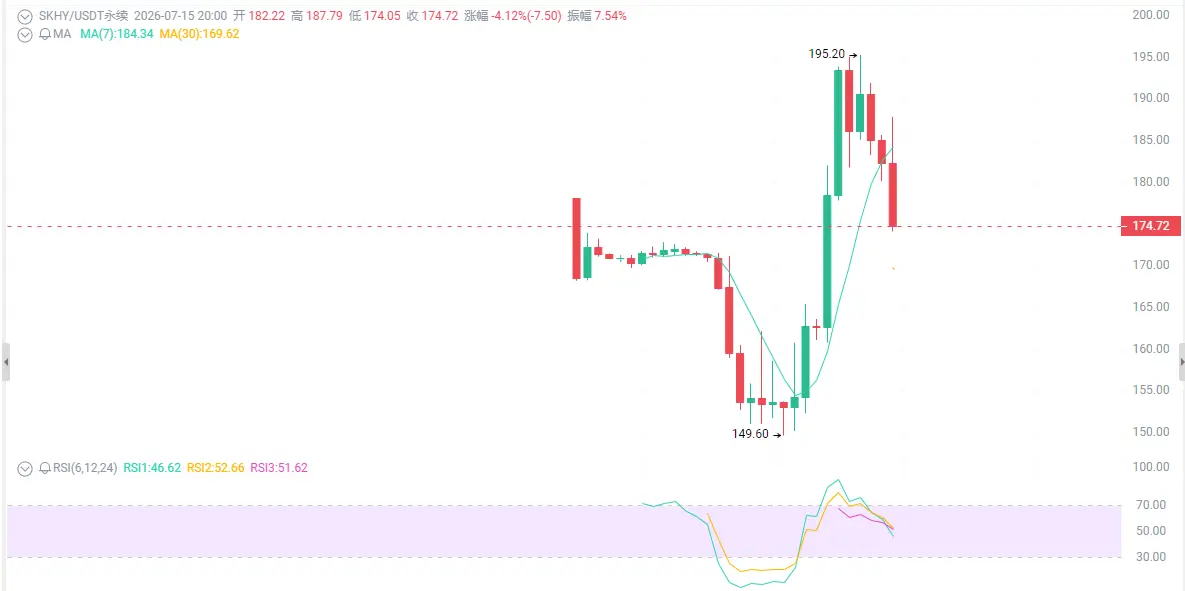
178ドルのSKHY、あなたは乗りますか?
まずは表面だけ見る:新株が暴騰したあとに下落し、個人投資家は慌てている人が大量。
7月10日のNASDAQ初登場で資金調達は265億ドル、上回る応募は7倍。価格は149ドルで始まり、190+まで一直線に上昇したあと、現在は178ドル近辺まで調整。上場からわずか5日で値動きが激しい。ローソク足が教える:上げでは出来高増、下げでは出来高減。RSIは買われ過ぎ水準から落ち着き、健康的に調整しており、強気トレンドは崩れていない。
第一に:51%のプレミアム、あなたは驚いて固まるかも。
ADRは韓国国内株価に対して、一度はプレミアムが最大51%までついた。メディアが総攻撃で言う:「バブル! プレミアムは収束しなきゃ、早く逃げろ!」
怖く聞こえる?でもよく見て——プレミアムは転換制限の影響で、7月29日まで裁定取引できない。いま178ドルで、プレミアムはすでに大幅に縮小しており、リスクが先に放出された。
第二に:HBMの市場シェアは50%超、AI時代の最強の“売り水”役。
SK Hynixは世界のHBM(高速・大容量メモリ)の絶対的リーダーで、NVIDIAと深く結びついている。AIデータセンターに対するHBM需要は、いま供給が追いつかない状況で、2025-2026年もなおゴールデン・サイクル。
NVIDIAのAIチップを1枚売るたびに、SK Hyni
原文表示まずは表面だけ見る:新株が暴騰したあとに下落し、個人投資家は慌てている人が大量。
7月10日のNASDAQ初登場で資金調達は265億ドル、上回る応募は7倍。価格は149ドルで始まり、190+まで一直線に上昇したあと、現在は178ドル近辺まで調整。上場からわずか5日で値動きが激しい。ローソク足が教える:上げでは出来高増、下げでは出来高減。RSIは買われ過ぎ水準から落ち着き、健康的に調整しており、強気トレンドは崩れていない。
第一に:51%のプレミアム、あなたは驚いて固まるかも。
ADRは韓国国内株価に対して、一度はプレミアムが最大51%までついた。メディアが総攻撃で言う:「バブル! プレミアムは収束しなきゃ、早く逃げろ!」
怖く聞こえる?でもよく見て——プレミアムは転換制限の影響で、7月29日まで裁定取引できない。いま178ドルで、プレミアムはすでに大幅に縮小しており、リスクが先に放出された。
第二に:HBMの市場シェアは50%超、AI時代の最強の“売り水”役。
SK Hynixは世界のHBM(高速・大容量メモリ)の絶対的リーダーで、NVIDIAと深く結びついている。AIデータセンターに対するHBM需要は、いま供給が追いつかない状況で、2025-2026年もなおゴールデン・サイクル。
NVIDIAのAIチップを1枚売るたびに、SK Hyni
- 報酬
- いいね
- コメント
- リポスト
- 共有
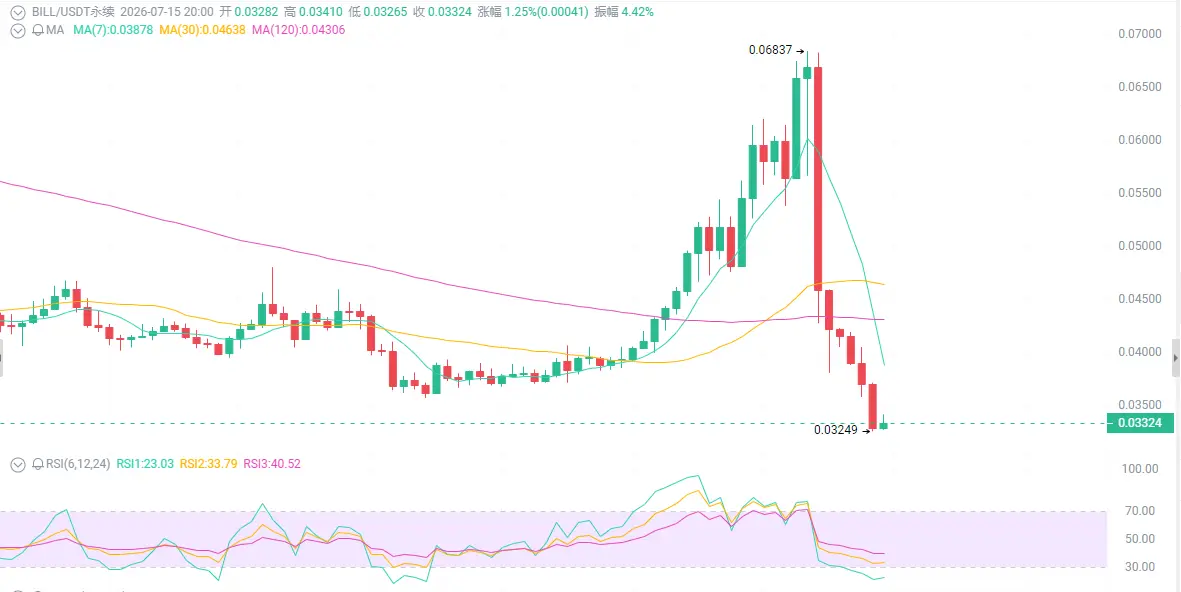
0.033ドルのBILL、底で買い増すのか、それとも損切りするのか?
まず表面だけ見てみよう:惨烈な急落、パニックの踏み逃げ。
24時間で38%下落し、0.055から直接0.033まで投げ売り。一本の大陰線が、過去1週間の上昇分をすべて飲み込んだ。時価8200万、出来高1.37億——売買回転率が爆発している。これは典型的な恐怖の板(パニック勢)による殺到した逃げ。ローソク足が告げる:RSIは売られ過ぎ圏に入ったが、MACDは直後にデッドクロスで出来高を伴っている。暴力的なリバウンドか、さらに陰に沈むかの二択。
第一に:プロジェクトのファンダメンタルは恐ろしいほど良いのに、価格の下げ方があまりにもおかしい。
BILLがやっているのは“ただの空気コイン”ではなく、AIの本人確認。ゼロ知識証明で、プライバシーを晒さずに「あなたは本当に人間」なのか「AI Agent」なのかを証明する。
パートナーは誰? HSBC、TikTok、欧州委員会。 すでに9000以上のプロジェクトに組み込まれている。創設者はPolygon/Hermezの中核チーム出身。
こんなプロジェクトが0.033の価値しかないのか?
第二に:今日の急落は、あなたが想像している理由とは違う可能性が高い。
ネガティブニュースなし。プロジェクト側の逃亡なし。規制による圧力もなし。あるのはただ一つ——利確組の量が多すぎて、洗い(仕込
原文表示まず表面だけ見てみよう:惨烈な急落、パニックの踏み逃げ。
24時間で38%下落し、0.055から直接0.033まで投げ売り。一本の大陰線が、過去1週間の上昇分をすべて飲み込んだ。時価8200万、出来高1.37億——売買回転率が爆発している。これは典型的な恐怖の板(パニック勢)による殺到した逃げ。ローソク足が告げる:RSIは売られ過ぎ圏に入ったが、MACDは直後にデッドクロスで出来高を伴っている。暴力的なリバウンドか、さらに陰に沈むかの二択。
第一に:プロジェクトのファンダメンタルは恐ろしいほど良いのに、価格の下げ方があまりにもおかしい。
BILLがやっているのは“ただの空気コイン”ではなく、AIの本人確認。ゼロ知識証明で、プライバシーを晒さずに「あなたは本当に人間」なのか「AI Agent」なのかを証明する。
パートナーは誰? HSBC、TikTok、欧州委員会。 すでに9000以上のプロジェクトに組み込まれている。創設者はPolygon/Hermezの中核チーム出身。
こんなプロジェクトが0.033の価値しかないのか?
第二に:今日の急落は、あなたが想像している理由とは違う可能性が高い。
ネガティブニュースなし。プロジェクト側の逃亡なし。規制による圧力もなし。あるのはただ一つ——利確組の量が多すぎて、洗い(仕込
- 報酬
- いいね
- コメント
- リポスト
- 共有
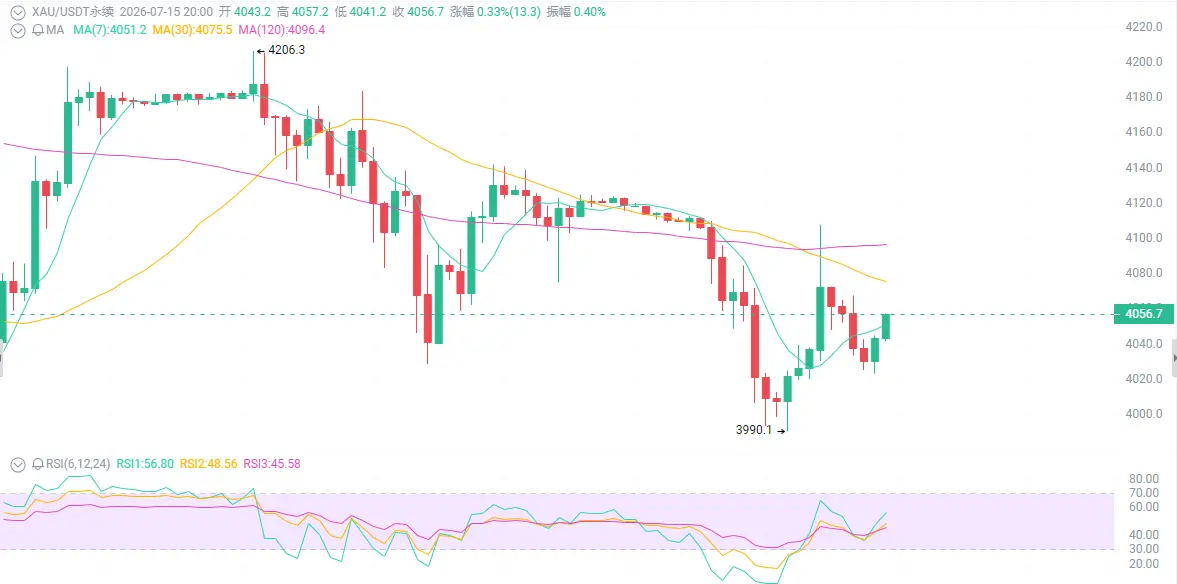
4044ドルの金、底値で買い増しするの?
まず表面を見ると:売りと買いの攻防が混沌としていて、ロジックがぐちゃぐちゃ。
昨日のCPIは予想を下回って冷え、金価格は1日で2%+爆騰。3983から4100まで一気に跳ねました。今日も米イランの衝突が激化したのに、金はむしろ上がらず4030の下に割り込み。過去24時間で4100から4028へ急落し、値幅は70ドル超。1月の歴史的高値5602から計算すると、すでに28%下落。伝統的な「避難資産」ロジックが完全に崩れ、市場は再評価を始めています。
第一のポイント:大砲が鳴れば金は万両? 今回は機能しませんでした。
米イラン衝突が急にエスカレートし、米国はイランの80以上の目標に軍事攻撃を実施。原油価格は1週間で9%以上急騰。通常なら、金は爆上げするはず。
でも現実は——2月の衝突勃発から7月13日まで、金価格は逆に24.2%下落。7月13日当日は、金が1日で58ドル急落。
原油高がインフレ期待を押し上げ、市場は「米連邦準備制度が(止むを得ず)利上げする」と見始めたからです。
金は無利息資産で、実質金利の上昇は致命的な打撃。
第二のポイント:CPIが金に強い追い風をくれた。でも続くの?
昨日の米国6月CPIは爆弾級だった——前年比+3.5%(予想+3.8%、前回+4.2%);前月比-0.4%(6年ぶりのマイナス)。コアCPIは前年比+2.6
原文表示まず表面を見ると:売りと買いの攻防が混沌としていて、ロジックがぐちゃぐちゃ。
昨日のCPIは予想を下回って冷え、金価格は1日で2%+爆騰。3983から4100まで一気に跳ねました。今日も米イランの衝突が激化したのに、金はむしろ上がらず4030の下に割り込み。過去24時間で4100から4028へ急落し、値幅は70ドル超。1月の歴史的高値5602から計算すると、すでに28%下落。伝統的な「避難資産」ロジックが完全に崩れ、市場は再評価を始めています。
第一のポイント:大砲が鳴れば金は万両? 今回は機能しませんでした。
米イラン衝突が急にエスカレートし、米国はイランの80以上の目標に軍事攻撃を実施。原油価格は1週間で9%以上急騰。通常なら、金は爆上げするはず。
でも現実は——2月の衝突勃発から7月13日まで、金価格は逆に24.2%下落。7月13日当日は、金が1日で58ドル急落。
原油高がインフレ期待を押し上げ、市場は「米連邦準備制度が(止むを得ず)利上げする」と見始めたからです。
金は無利息資産で、実質金利の上昇は致命的な打撃。
第二のポイント:CPIが金に強い追い風をくれた。でも続くの?
昨日の米国6月CPIは爆弾級だった——前年比+3.5%(予想+3.8%、前回+4.2%);前月比-0.4%(6年ぶりのマイナス)。コアCPIは前年比+2.6
- 報酬
- いいね
- コメント
- リポスト
- 共有
570ドルのZEC、まだリバウンド待ち?
まず表面を見ると:恐怖からFOMOまで、たった2週間。
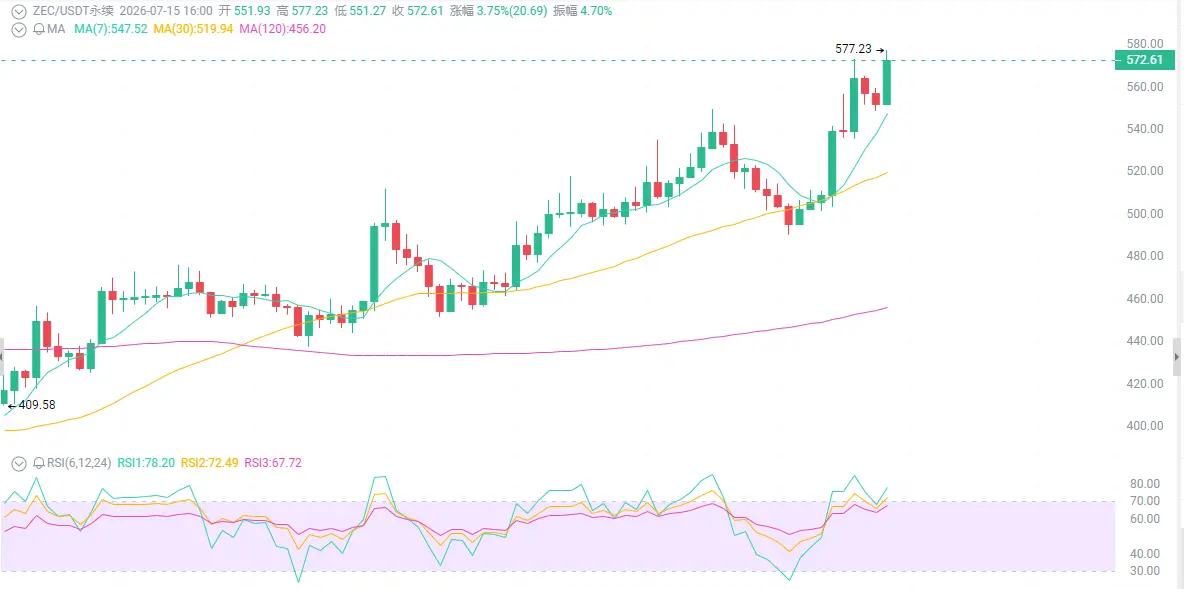
7月15日、ZECが550 USDTを突破し、24時間の上昇率は11.39%で、現在は570ドル。月内は401ドルから始まり累計で37.8%超上昇。週足では16%超、1年の上昇率は1190%超。時価総額は95億のインパクトで、順位は前11-14位を安定維持。
チャートが教える:9日線が21日線を上抜け、ゴールデンクロスが出現。同じシグナルは4月にも1回出て、その後ZECは240ドルから684ドルまで一気に引き上げられた。
最初の出来事:脆弱性が暴露された時、あなたが恐慌で損切りする一方、クジラが狂ったように買い増し。
6月初旬、ZECのOrchardプライバシープールに「重要な脆弱性」があると暴露され、ZECの偽造が可能になる可能性があり、しかも4年間誰にも発見されなかった。Arthur Hayesは即座に全て清算、個人投資家が恐慌で殺到し、価格は362ドルまで叩き落とされた。
チームがハッカーの悪用がないことを確認した後、Multicoin Capitalは逆に大幅に買い増し。7月2日、クジラがHyperLiquidで810万ドルのロングポジションを建てた。
次の出来事:AnthropicのAI監査で、ZECに「数学の保険」をかけた。
7月15日、ZECは26%急騰——Anthrop
原文表示まず表面を見ると:恐怖からFOMOまで、たった2週間。
7月15日、ZECが550 USDTを突破し、24時間の上昇率は11.39%で、現在は570ドル。月内は401ドルから始まり累計で37.8%超上昇。週足では16%超、1年の上昇率は1190%超。時価総額は95億のインパクトで、順位は前11-14位を安定維持。
チャートが教える:9日線が21日線を上抜け、ゴールデンクロスが出現。同じシグナルは4月にも1回出て、その後ZECは240ドルから684ドルまで一気に引き上げられた。
最初の出来事:脆弱性が暴露された時、あなたが恐慌で損切りする一方、クジラが狂ったように買い増し。
6月初旬、ZECのOrchardプライバシープールに「重要な脆弱性」があると暴露され、ZECの偽造が可能になる可能性があり、しかも4年間誰にも発見されなかった。Arthur Hayesは即座に全て清算、個人投資家が恐慌で殺到し、価格は362ドルまで叩き落とされた。
チームがハッカーの悪用がないことを確認した後、Multicoin Capitalは逆に大幅に買い増し。7月2日、クジラがHyperLiquidで810万ドルのロングポジションを建てた。
次の出来事:AnthropicのAI監査で、ZECに「数学の保険」をかけた。
7月15日、ZECは26%急騰——Anthrop
- 報酬
- いいね
- コメント
- リポスト
- 共有
CPI暴きつけてショートが撃沈、BTCは65Kに直撃!それでもあなたは空売りするの?
まずは表面だけ見ると:暴力的なリバウンドで勢いは絶好調。
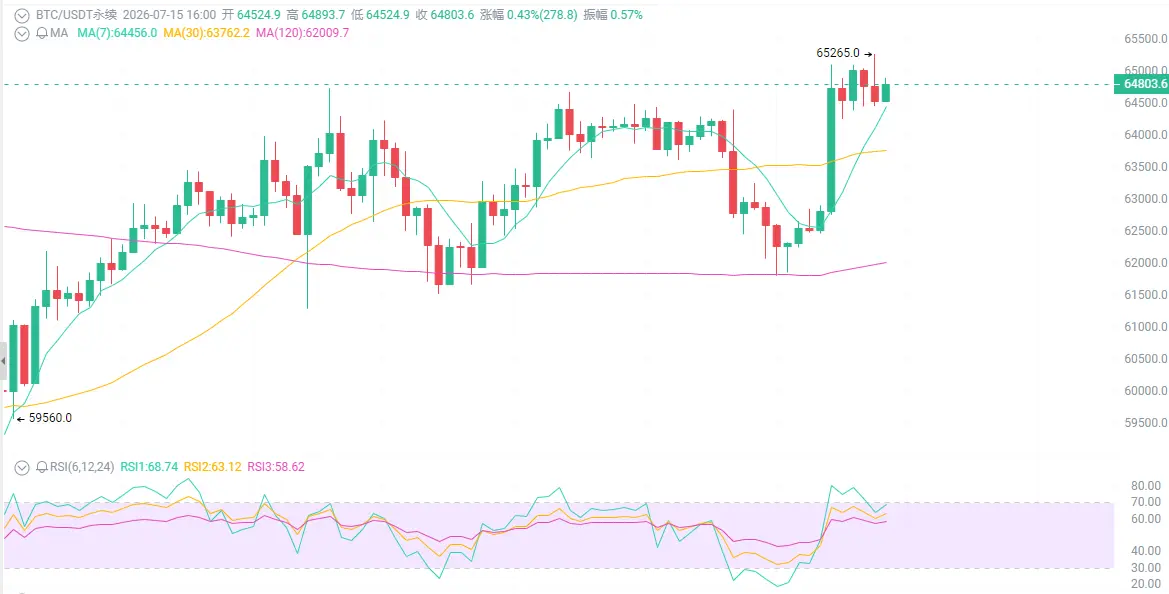
CPIは前年比3.5%、予想3.8%、コアCPIは直接2.6%まで到達。インフレがいちばん急速に冷えた。BTCは24時間で+3.7%急騰し、62.5Kから勢いよく64.8Kを奪還、65Kの心理的節目に接近。ネット全体のショートが一斉に損切り(爆弾決済)で惨烈、ローソク足は出来高を伴う強い陽線を形成。MACDはゴールデンクロス、RSIは55-63に戻り中立〜やや強気。突破すれば相場は強気相場、突破できなければダブルトップ。
第一のポイント:CPIの数字が爆発し、市場は完全に反転した。
1か月前、相場はまだ米連邦準備制度理事会(FRB)の利上げを警戒していた。CPIは前年比3.5%で、月次はマイナス成長、コア・インフレは2.6%まで低下。FRBが最も重視するインフレ指標が、ついに弱気に転じた(認めた)。
利上げ確率は43%から13%へ急落、9月の利下げカジノは直ちに大盛況。ナスダック、S&P、金が一斉に暴れ、BTCはリスク資産の「高ベータのお調子者」そのものとして、62.5Kから65Kへエア・ショットのように跳んだ。
第二のポイント:ETFが回流し始めた、機関投資家が62Kでこっそり買い増し。
それ以前の6〜7月、ETFは週次で16億超が流出し
原文表示まずは表面だけ見ると:暴力的なリバウンドで勢いは絶好調。
CPIは前年比3.5%、予想3.8%、コアCPIは直接2.6%まで到達。インフレがいちばん急速に冷えた。BTCは24時間で+3.7%急騰し、62.5Kから勢いよく64.8Kを奪還、65Kの心理的節目に接近。ネット全体のショートが一斉に損切り(爆弾決済)で惨烈、ローソク足は出来高を伴う強い陽線を形成。MACDはゴールデンクロス、RSIは55-63に戻り中立〜やや強気。突破すれば相場は強気相場、突破できなければダブルトップ。
第一のポイント:CPIの数字が爆発し、市場は完全に反転した。
1か月前、相場はまだ米連邦準備制度理事会(FRB)の利上げを警戒していた。CPIは前年比3.5%で、月次はマイナス成長、コア・インフレは2.6%まで低下。FRBが最も重視するインフレ指標が、ついに弱気に転じた(認めた)。
利上げ確率は43%から13%へ急落、9月の利下げカジノは直ちに大盛況。ナスダック、S&P、金が一斉に暴れ、BTCはリスク資産の「高ベータのお調子者」そのものとして、62.5Kから65Kへエア・ショットのように跳んだ。
第二のポイント:ETFが回流し始めた、機関投資家が62Kでこっそり買い増し。
それ以前の6〜7月、ETFは週次で16億超が流出し
- 報酬
- いいね
- コメント
- リポスト
- 共有
1880ドルのETH、あなたは“洗って車を降ろす”みたいに下ろされちゃった?
まず表面だけ見ると:底はもうできていて、トレンドは反転。
過去24時間は小幅に揺れつつ、週足は6.1%上昇、月足は8.9%上昇。1510のダブルボトムから1900まで一直買い上げて、1842のネックラインを突破成功、値幅目標は2163へ一直線。ローソク足が言ってる:ダブルボトムの形が確定、MACDのゴールデンクロス、移動平均線は強気の並び。押し目は“上車のチャンス”で、置いていかれるな。
第一の出来事:CPIが市場を救ったけど、あなたはまだ迷ってるかもしれない。
米国の6月CPIは前月比-0.4%、前年比3.5%で予想を下回り、コアインフレも鈍化。市場が抱いていたFRBの利上げ懸念が一夜で霧散し、リスク資産が総じて急騰、ETHは1日で5-7%も上げた。
でも自分のポジションを見て—
1600-1700のときにもう切っちゃった?「もっと低い底」をずっと待ってない?
同じシナリオが、2023年10月、2024年8月、2025年3月。CPIが天井を打つたびに、ETHの暴力的な反発の起点になってる。
第二の出来事:ETFに収益が出て、ETHが「利回り付きの株」になった。
BlackRock、Grayscaleのステーキング版ETFがすでに上場し、保有者は直接3-4%の質入れ(ステーキング)収益を受け取れる。これは
原文表示まず表面だけ見ると:底はもうできていて、トレンドは反転。
過去24時間は小幅に揺れつつ、週足は6.1%上昇、月足は8.9%上昇。1510のダブルボトムから1900まで一直買い上げて、1842のネックラインを突破成功、値幅目標は2163へ一直線。ローソク足が言ってる:ダブルボトムの形が確定、MACDのゴールデンクロス、移動平均線は強気の並び。押し目は“上車のチャンス”で、置いていかれるな。
第一の出来事:CPIが市場を救ったけど、あなたはまだ迷ってるかもしれない。
米国の6月CPIは前月比-0.4%、前年比3.5%で予想を下回り、コアインフレも鈍化。市場が抱いていたFRBの利上げ懸念が一夜で霧散し、リスク資産が総じて急騰、ETHは1日で5-7%も上げた。
でも自分のポジションを見て—
1600-1700のときにもう切っちゃった?「もっと低い底」をずっと待ってない?
同じシナリオが、2023年10月、2024年8月、2025年3月。CPIが天井を打つたびに、ETHの暴力的な反発の起点になってる。
第二の出来事:ETFに収益が出て、ETHが「利回り付きの株」になった。
BlackRock、Grayscaleのステーキング版ETFがすでに上場し、保有者は直接3-4%の質入れ(ステーキング)収益を受け取れる。これは
- 報酬
- 1
- コメント
- リポスト
- 共有