Share crypto content and earn up to 60% commissions through content mining.
placeholder
gatefun
Solana: Cm6fNnMk7NfzStP9CZpsQA2v3jjzbcYGAxdJySmHpump
SOL0.57%
View Original
post-image
  • Reward
  • Comment
  • Repost
  • Share
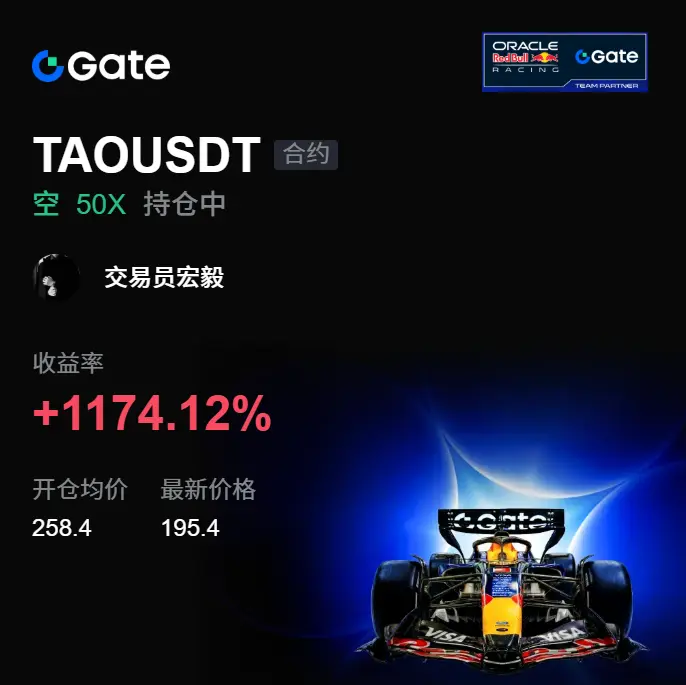
This move is a typical “first sweep sentiment, then give direction.” $TAO Earlier, it was tugging back and forth above; for a moment the short-term price action made people feel like it could still push higher. But what I focused on at the time was the follow-through after the pullback. As it turned out, it was obvious—no one was picking up when it went up, while the pullback became smoother and smoother. This level is crucial.

The easiest place to make mistakes during the session is to see one rebound and think that the direction has reversed. When TAO was around 258.4, what I cared more a
TAO0.56%
BTC1.37%
ETH1.06%
View Original
post-image
  • Reward
  • Comment
  • Repost
  • Share
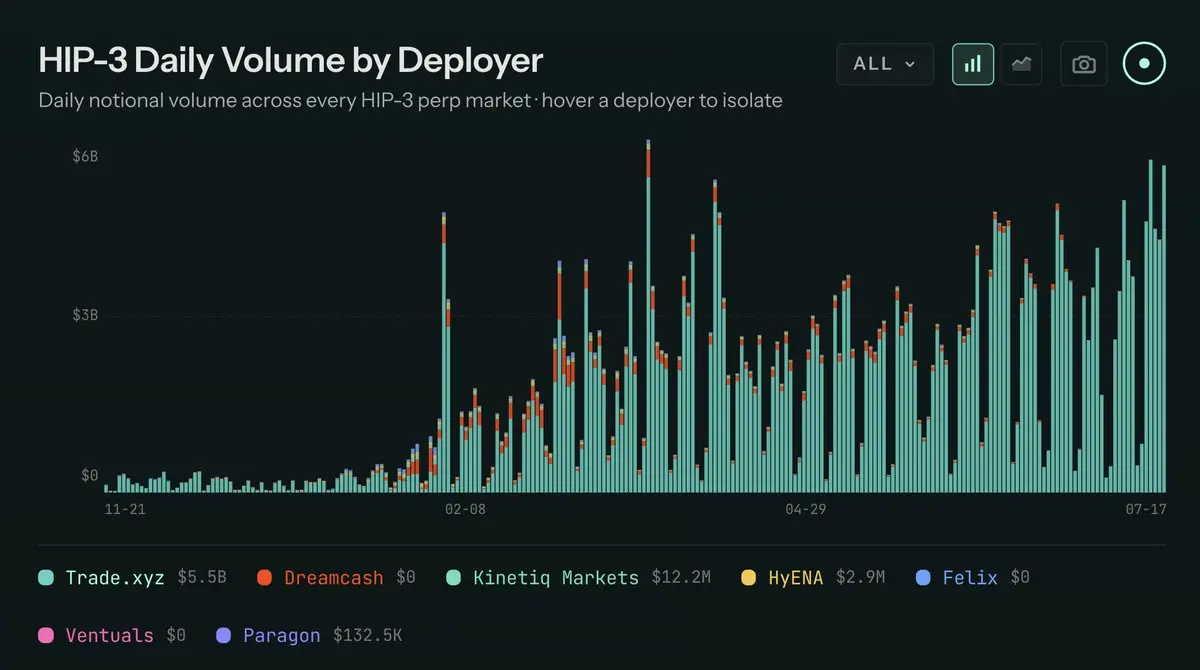
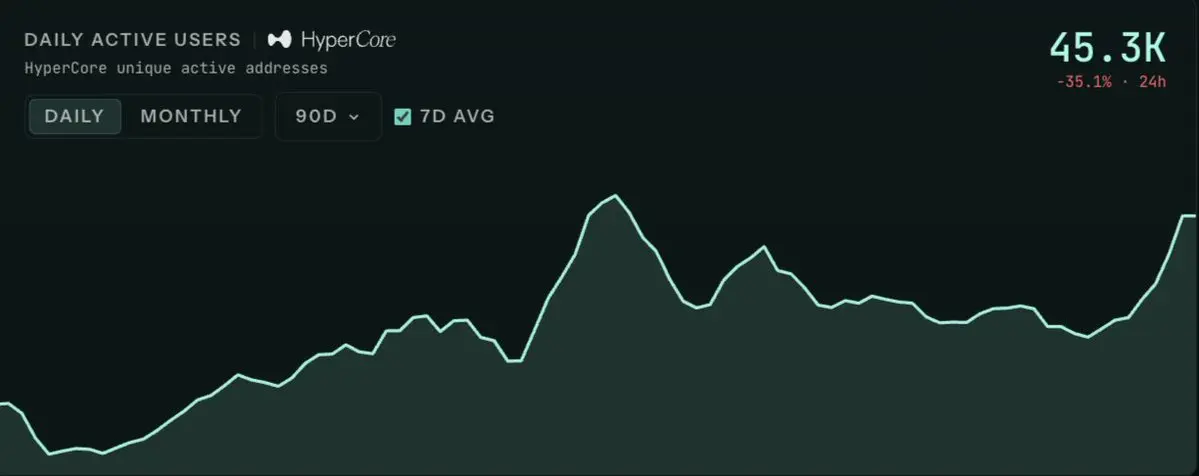
People are saying Hyperliquid metrics aren't great right now.
Really depends where you look.
HIP-3 volume is at ATHs, priority fees are higher than ever and kicking in, and DAUs are nearing ATHs.
Just a matter of perspective. Its still very early in the broader adoption curve for Hyperliquid and $100, $200, $200 per hyperliquid:native is simply a matter of time.
HYPE1.06%
post-image
post-image
  • Reward
  • Comment
  • Repost
  • Share
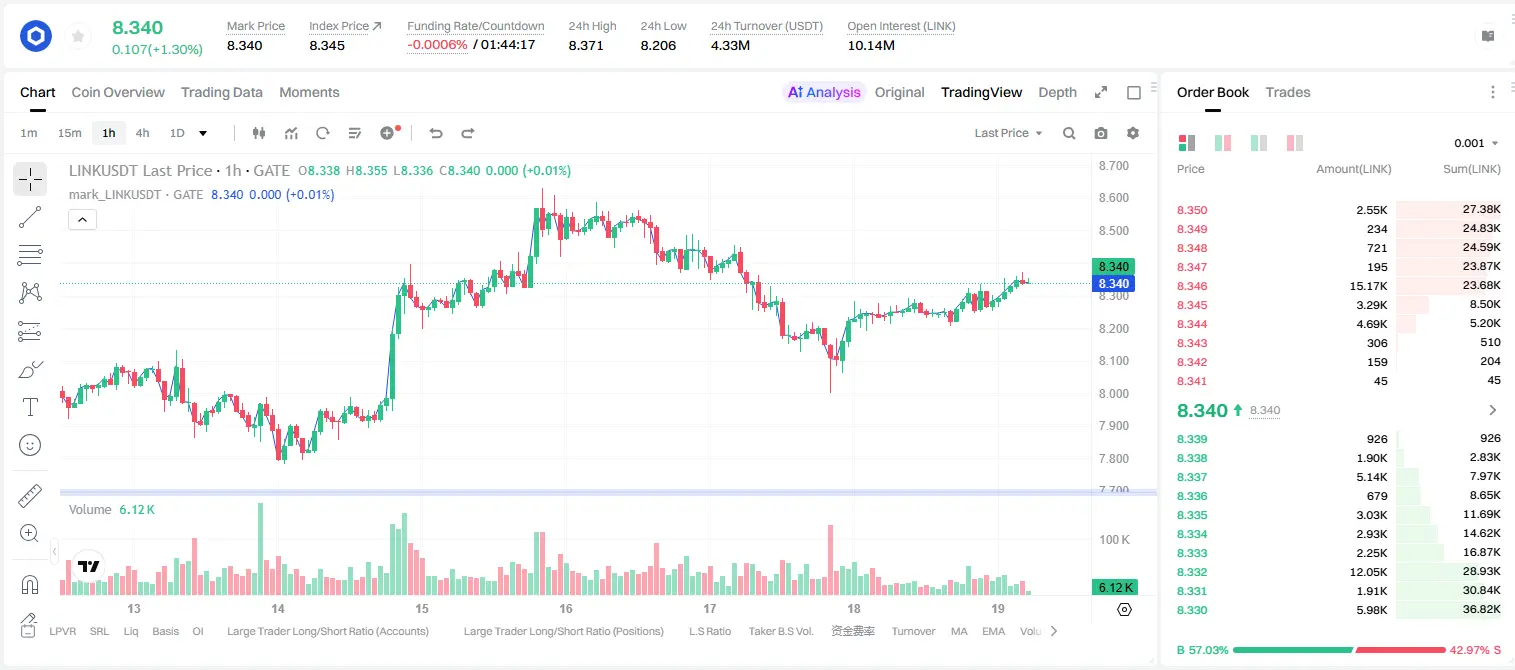
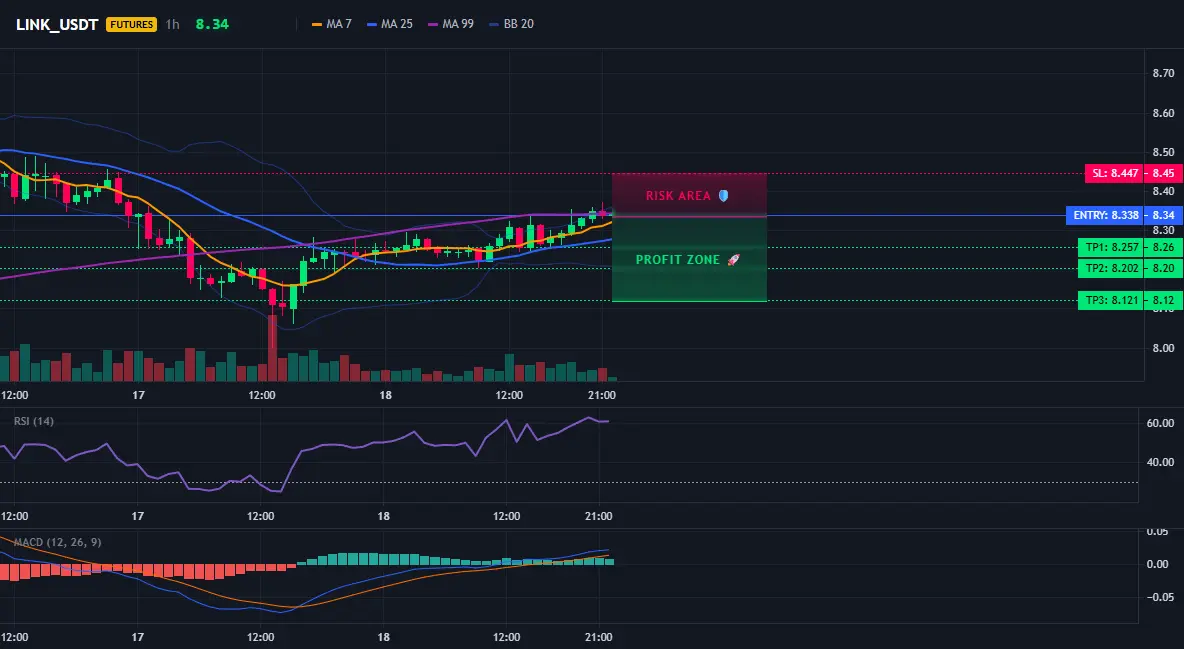
LINK hides danger at the 4-hour level—are you really willing to ignore this bearish signal?

$LINK /USDT - Go SHORT

Trading plan:
Entry: 8.327 – 8.349
SL: 8.447
TP1: 8.257
TP2: 8.202
TP3: 8.121

Why focus on this structure?
- The current price 8.338 is right at the key 4H resistance; RSI on 15M is 58.6 and hasn’t entered overbought—bearish momentum is building
- Why now? The 1D trend is ranging, but the 4H is issuing a SHORT signal; TP1 at 8.257 offers a 2:1 reward-to-risk
- If it breaks below 8.327, shorts accelerate; TP2 points to 8.202, while SL is only 8.447—risk is controllable

Disc
LINK1.05%
View Original
post-image
post-image
  • Reward
  • Comment
  • Repost
  • Share
Tonight’s CPI: Full Coverage · Analysis
gate liveLIVE
3,999
  • Reward
  • 4
  • Repost
  • Share
MSTF30:
2026 GOGOGO 👊
View More
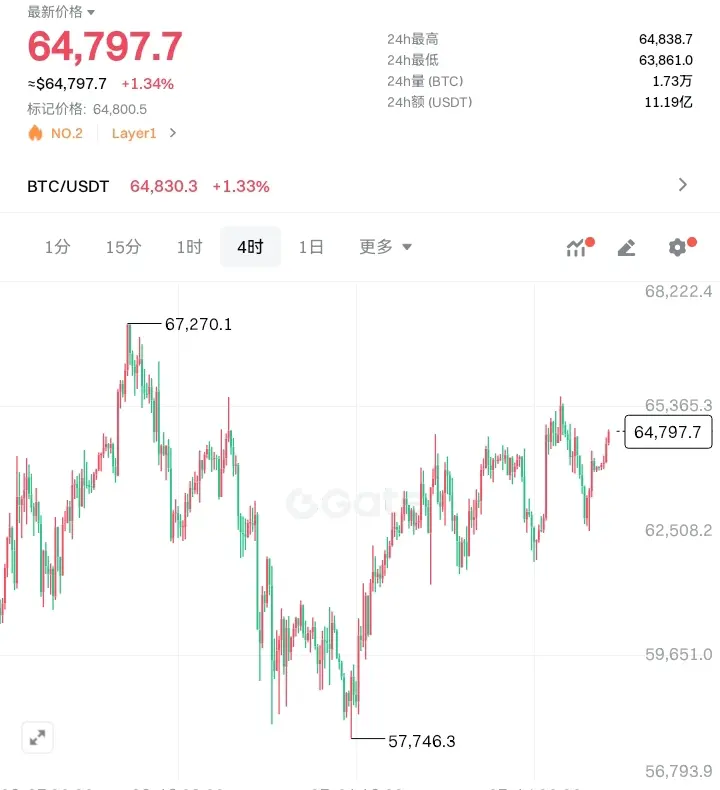
7.19 Morning BTC/ETH Market Analysis — Shiyuan’s View
BTC
On the 4-hour level, after probing the bottom at 62,500, it rebounded strongly. It is currently holding at 64,780, showing a clear bullish trend, and is building up to challenge the previous high at 65,590.
A pullback and stabilization are bullish; the 65,000 level is ahead. As long as it doesn’t break 63,000, go long along the trend—don’t panic.
Recommendations:
Buy near 64,200–64,500 on the pullback, with a target around 65,500.
ETH
After dropping to 1,810, it quickly reclaimed. Current price is 1,861. The chart shows a bullish engulf
BTC1.35%
ETH1.06%
View Original
post-image
  • Reward
  • Comment
  • Repost
  • Share
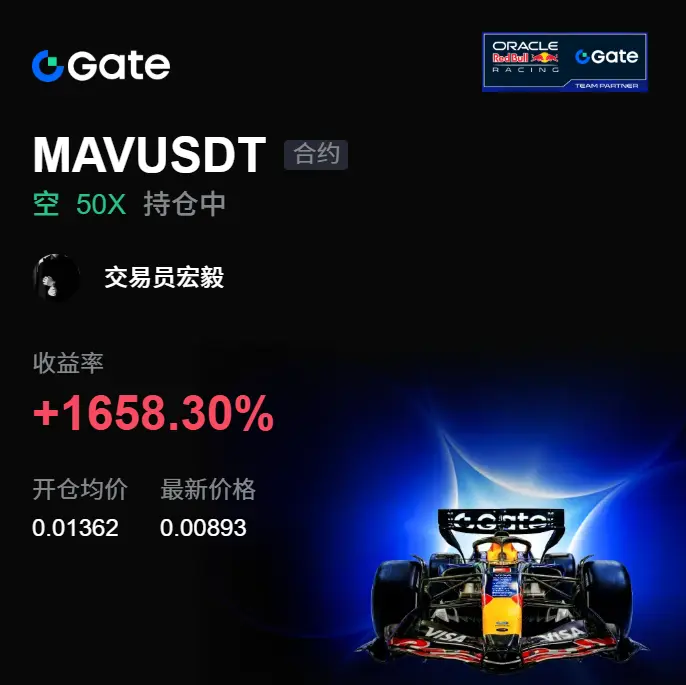
The most comfortable part of this trade wasn’t that it dropped fast—it was that the signals beforehand were clear enough. When $MAV was repeatedly pulling back and forth at the high, many people were still waiting for further breakout; at the time, I already felt the rhythm had changed. The push up lacked volume, but the pullback was decisive—once this contrast showed up, it meant the market wasn’t just ranging, it was laying the groundwork for the shorts.

What truly caught my attention was how MAV performed near key levels. After several attempts, it still couldn’t hold; buyers hesitated,
MAV-1.32%
BTC1.37%
ETH1.06%
View Original
post-image
  • Reward
  • Comment
  • Repost
  • Share
Mbappe, the rightful heir to Ronaldo's throne
22 goals in world Cup, highest ever
10 goals in 2026 world Cup, highest so far
Goal scoring machine!!!
post-image
  • Reward
  • Comment
  • Repost
  • Share
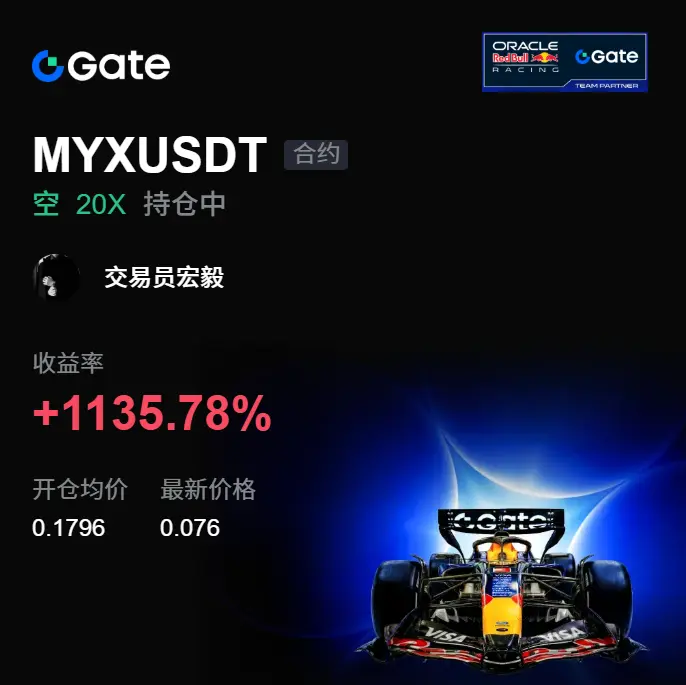
After this short position finally moved, all those fake strong moves earlier were completely exposed. $MYX Earlier, it had been going sideways at high levels, seemingly not dropping; but in reality, every attempt to rebound lacked strength—buying couldn’t keep up, while selling pressure became increasingly clear. In plain terms, the rhythm has changed.

At the time I was watching MYX. The key point wasn’t whether it could make another push higher, but whether anyone would be willing to take it after it reached around 0.1796. The result was very straightforward: the rebound went shorter and s
MYX3.10%
BTC1.37%
ETH1.06%
View Original
post-image
  • Reward
  • 1
  • Repost
  • Share
IfYouDareToFly,ThereIsASkyLike:
The “dog pool” has absolutely no intention of pumping the market. And maybe it’s because the car is too heavy—there’s simply no need for them to pump it. If they did pump, then you long-positioners would be the ones getting rich at high levels—how could that possibly be? They’re not doing charity.
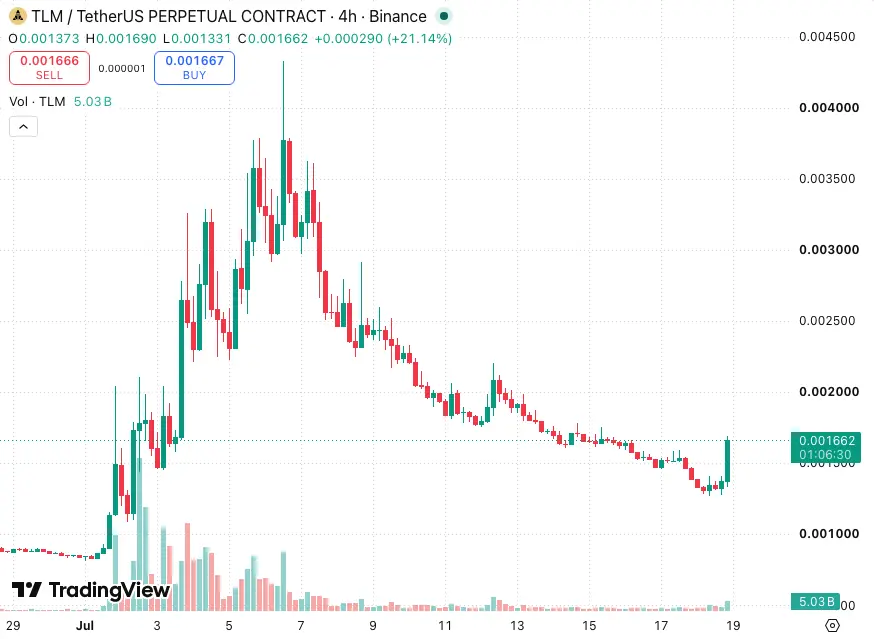
$TLM The profit you were aiming for from this run is already in hand; I’m stepping out now.
At this point, just close the position immediately to lock in gains, then switch vehicles and look at the next target. After that, I may continue to keep an eye on $BANK and $ESPORTS ’s moves.
Everyone, watch your own positions—don’t chase blindly, and manage your risk.
TLM23.62%
View Original
post-image
  • Reward
  • Comment
  • Repost
  • Share
Morning Crypto Market Update
gate liveLIVE
259
  • Reward
  • Comment
  • Repost
  • Share
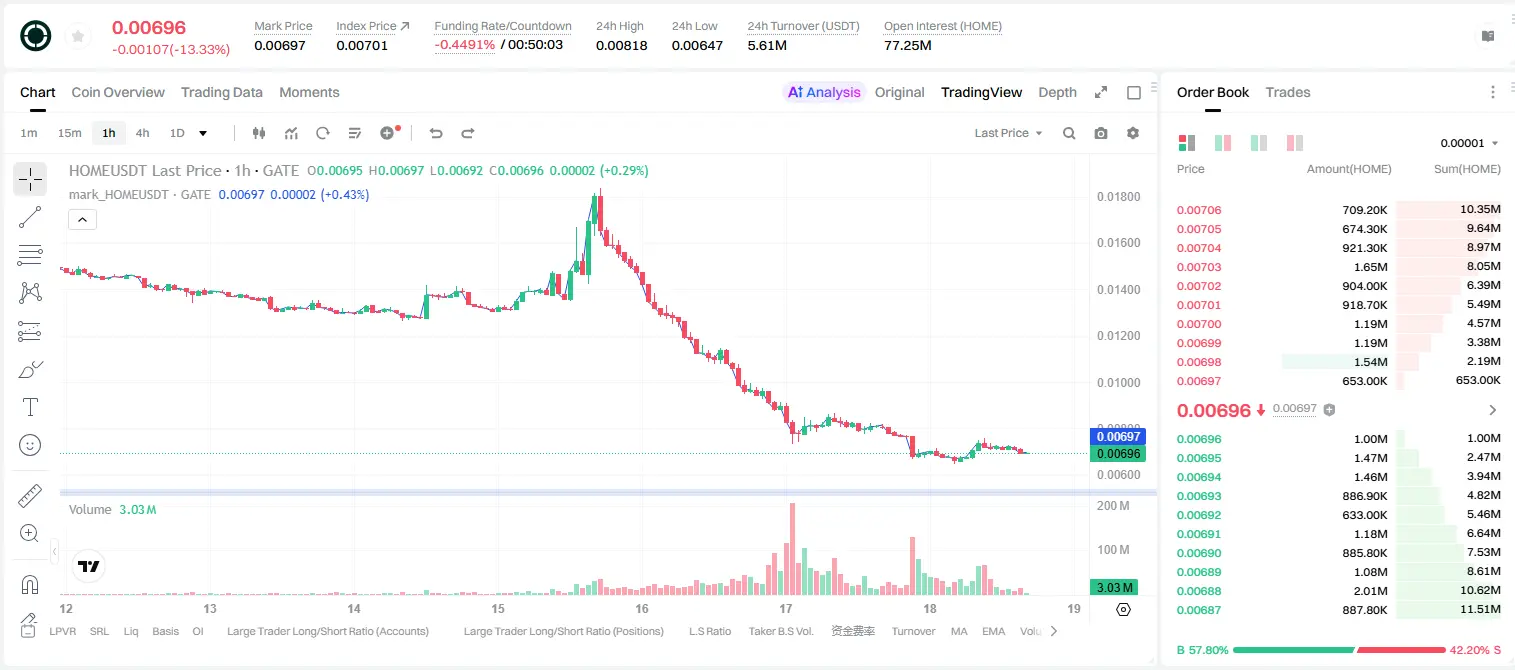
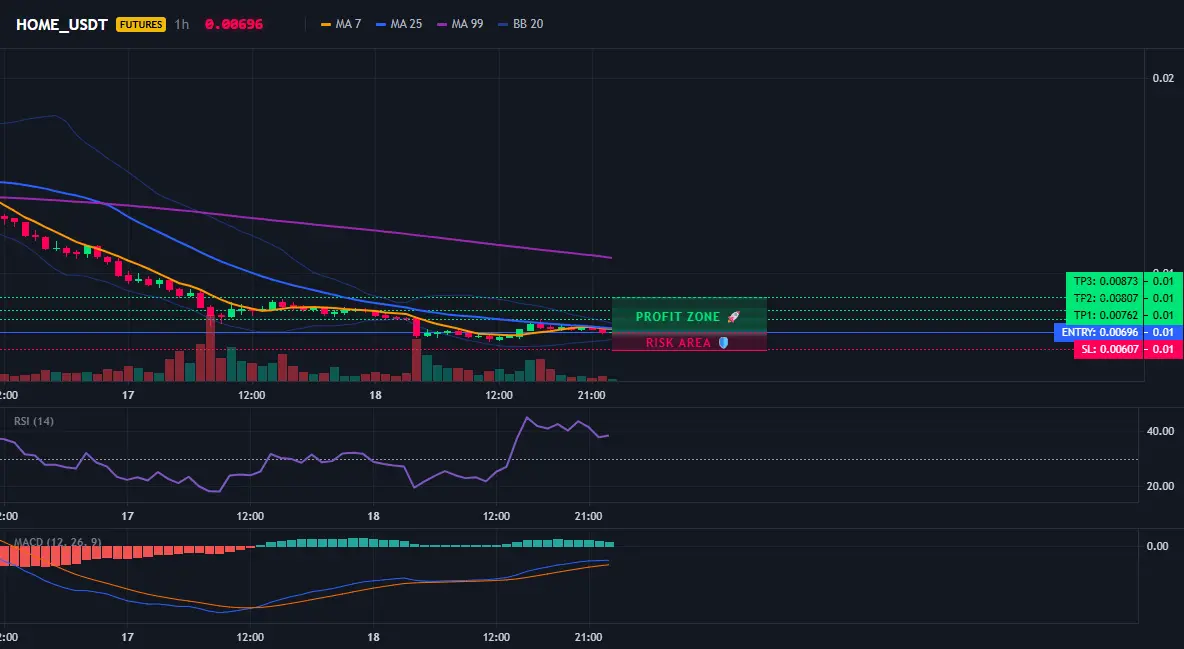
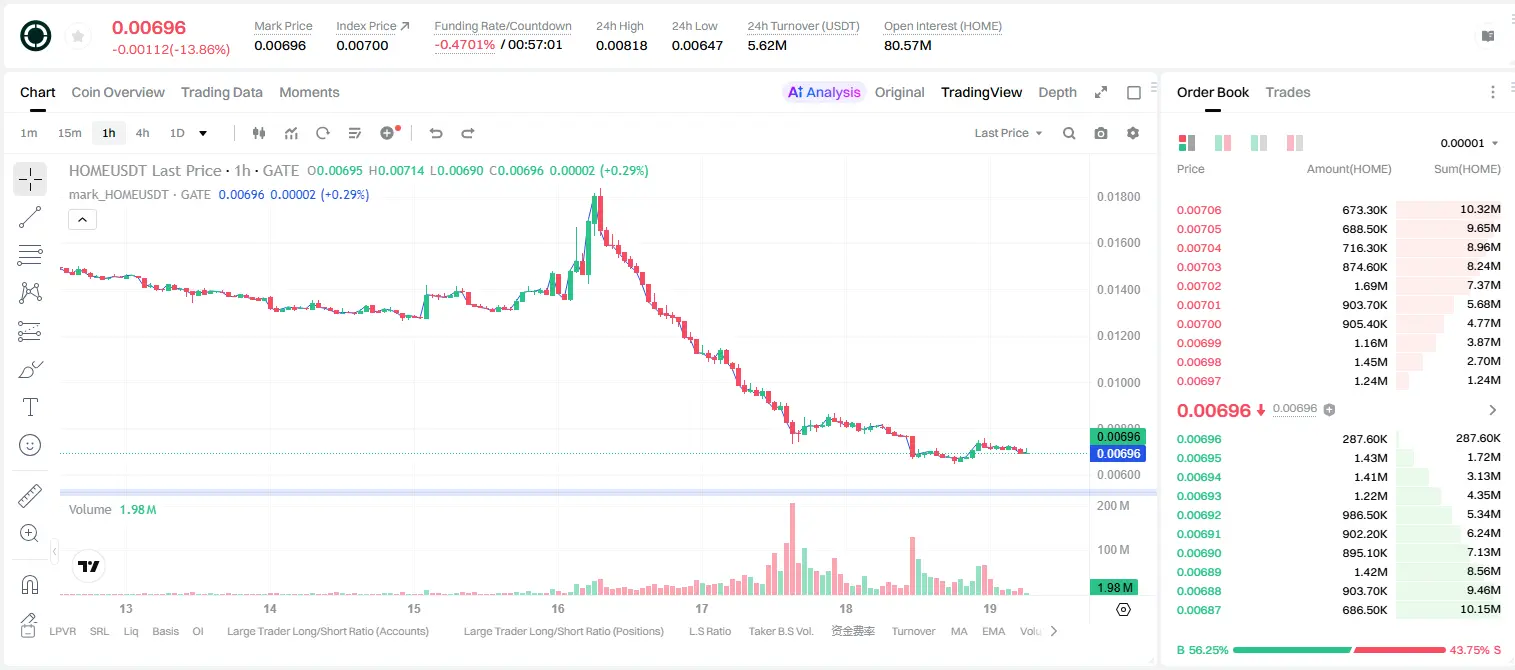
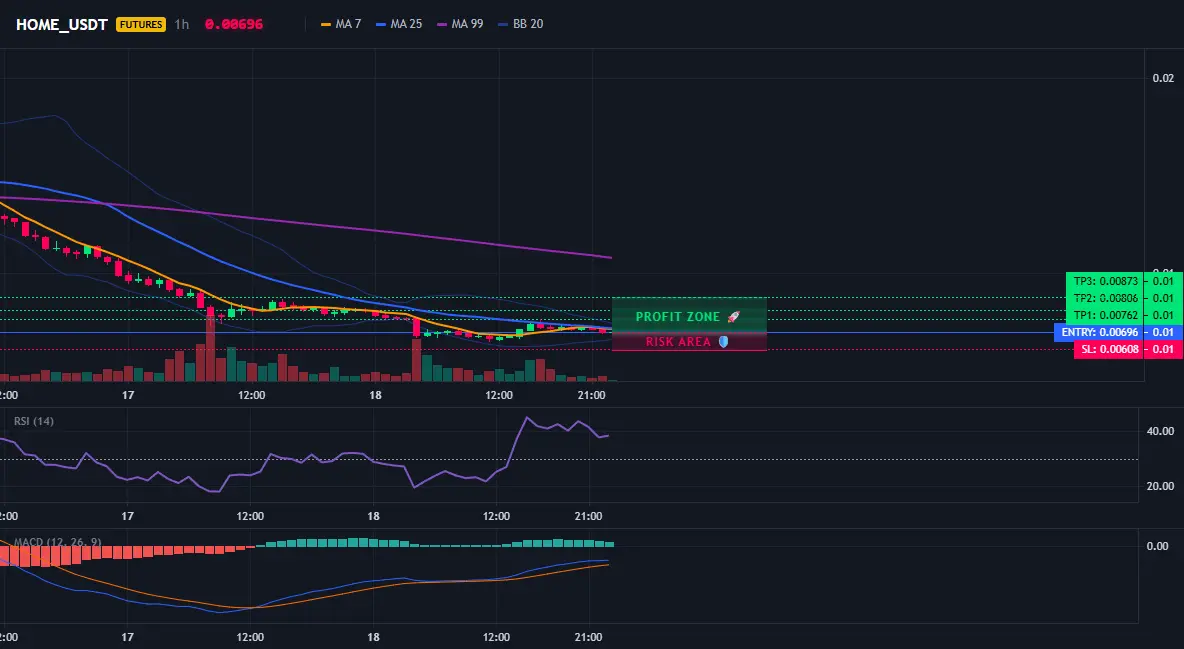
$HOME /USDT: Accumulation at the 4-hour bottom—will the whale push the market up?
$HOME /USDT - Go LONG
Trading plan:
Entry: 0.00689 – 0.00703
SL: 0.00607
TP1: 0.00762
TP2: 0.00807
TP3: 0.00873
Why focus on this structure?
- Current price 0.00696, and the 15-minute RSI is only 38.17—an oversold bounce is about to trigger.
- The 4-hour bullish signal score is 84, with dense EMA support; the entry zone is 0.00689-0.00703.
- TP1 target 0.00762 (+9.5%), TP2 0.00807 (+16%), with a stop loss set at 0.00607.
- Against the 1-day bearish trend, but it’s a high-probability short-term trade—why now? Beca
HOME-11.23%
View Original
post-image
post-image
  • Reward
  • Comment
  • Repost
  • Share
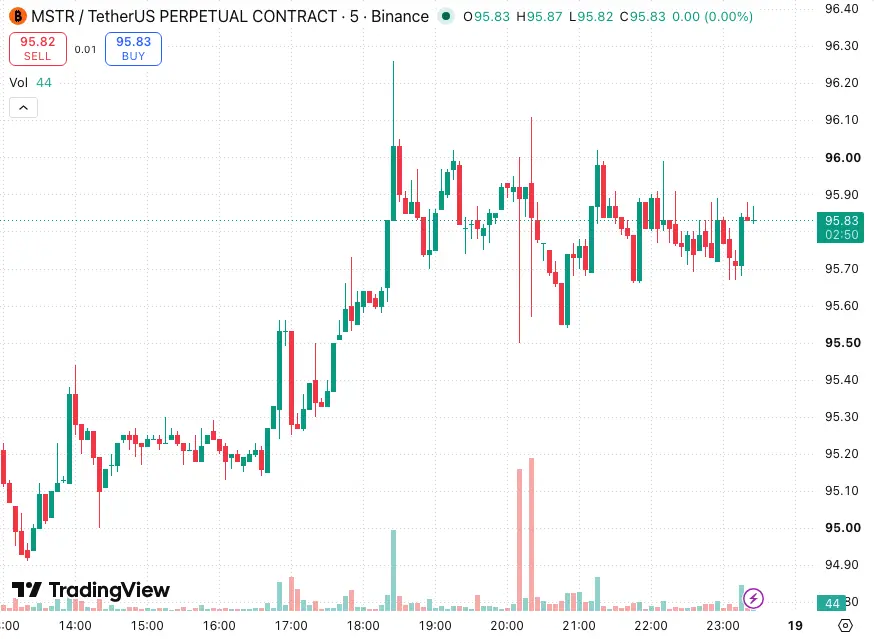
$MSTR Follow the long-side direction. Many people skip it because they think the chart looks messy, but that may be exactly where the opportunity is hiding. The 4-hour long structure is still intact. Although the daily chart is ranging, the price has already shown clear reactions in the 95.64 to 95.74 area. On the 15-minute chart, the RSI is right at the neutral 50 level, and there is room for further upside. Also, the 15-minute trading volume has increased by about 4 times—buy-side capital has genuinely flowed in. For entry, focus on the 95.64 to 95.74 range. The first upside target is 96.06
View Original
post-image
  • Reward
  • Comment
  • Repost
  • Share
$BR Watch for shorting opportunities at high levels.
This pump is a bit excessive. During the day, the RSI at the high has already shown signs of parabola exhaustion. The chart looks quite heavy, and it may be time for a pullback. For entry, you can watch the 0.1673 to 0.1715 range. Downward targets: first look at 0.15984, and if price continues to dig lower, it may reach 0.15219. Place your defense level at 0.17836.
But also watch the risk. Right now, the trend momentum is still very strong—if it breaks upward, the short positions could become invalid. Don’t go all-in; manage your position s
BR11.75%
View Original
  • Reward
  • Comment
  • Repost
  • Share
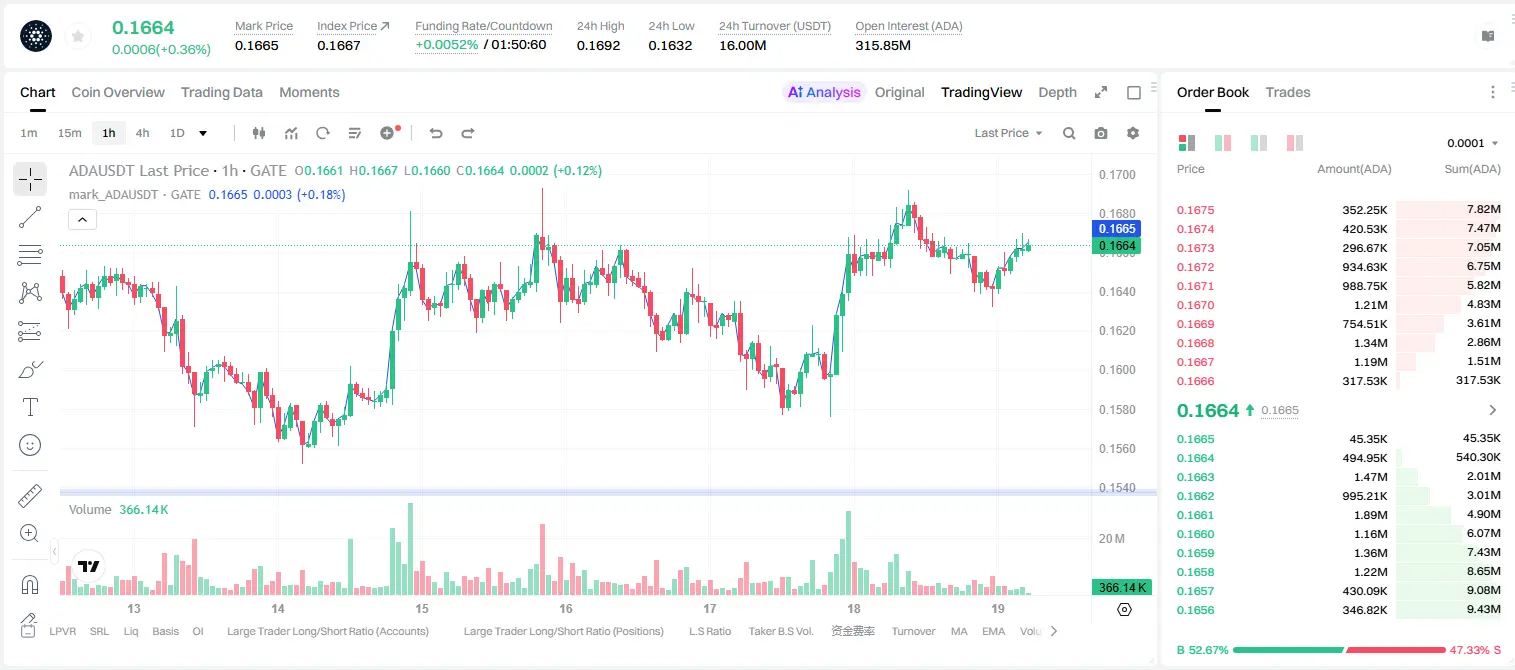
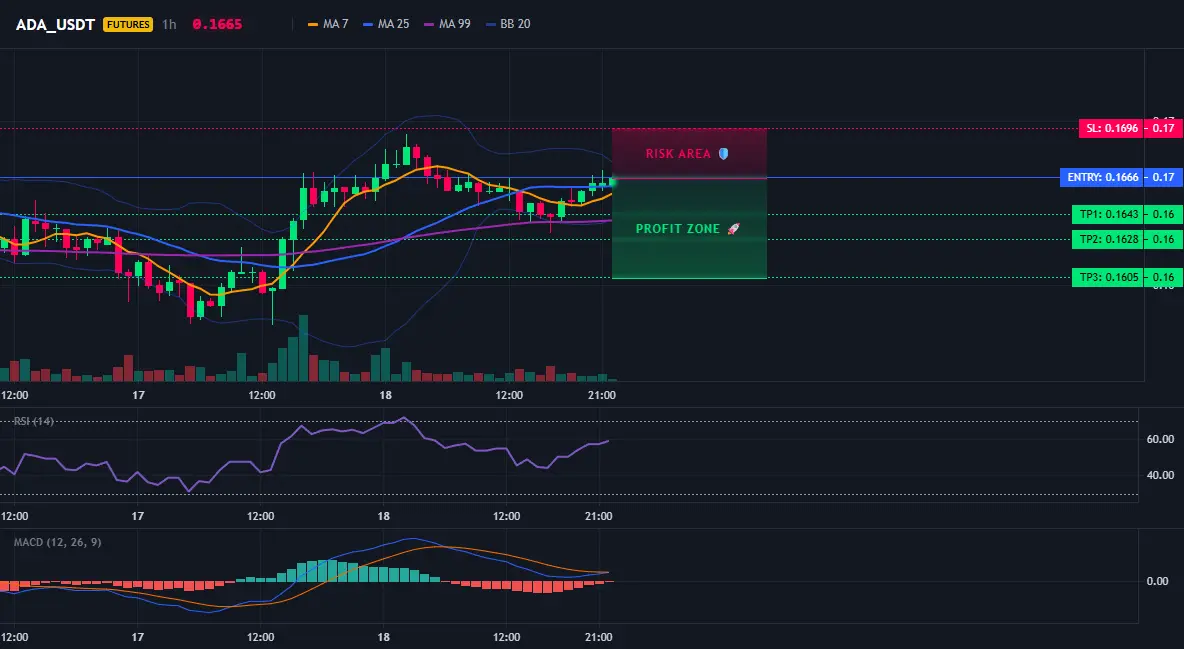
ADA long-vs-short battle—who’s quietly accumulating?
$ADA /USDT - SHORT
Trading plan:
Entry: 0.1663 – 0.1669
SL: 0.1696
TP1: 0.1643
TP2: 0.1628
TP3: 0.1605
Why focus on this setup?
- The 4H timeframe trend is clearly bearish; RSI on 15m is only 59.56, rebound momentum is insufficient
- The 1H ATR is only 0.001269; volatility is tightening, a breakout is imminent
- At the current 0.1666, price is under EMA suppression; bearish direction has a 95% probability
- Why now? The daily has broken down; consolidation on shrinking volume suggests shorts are building strength
Discussion:
Will this leg hi
ADA-0.06%
View Original
post-image
post-image
  • Reward
  • Comment
  • Repost
  • Share
$HOME /USDT shows an 84% bullish signal on the 4-hour chart, but the daily trend is bearish—an opportunity hides in the contradiction.

$HOME /USDT - Go LONG

Trading plan:
Entry: 0.00689 – 0.00703
SL: 0.00608
TP1: 0.00762
TP2: 0.00806
TP3: 0.00873

Why focus on this setup?
- 4-hour LONG signal: entry at 0.00696, TP1 at 0.00762, TP2 at 0.00806, SL set at 0.00608.
- The 15-minute RSI is only 38.17, in the oversold zone, with short-term rebound momentum building.
- The 1-hour ATR is 0.000283, with moderate volatility. The current 0.00696 is a support level, suitable for buying the dip.
HOME-11.23%
View Original
post-image
post-image
  • Reward
  • Comment
  • Repost
  • Share
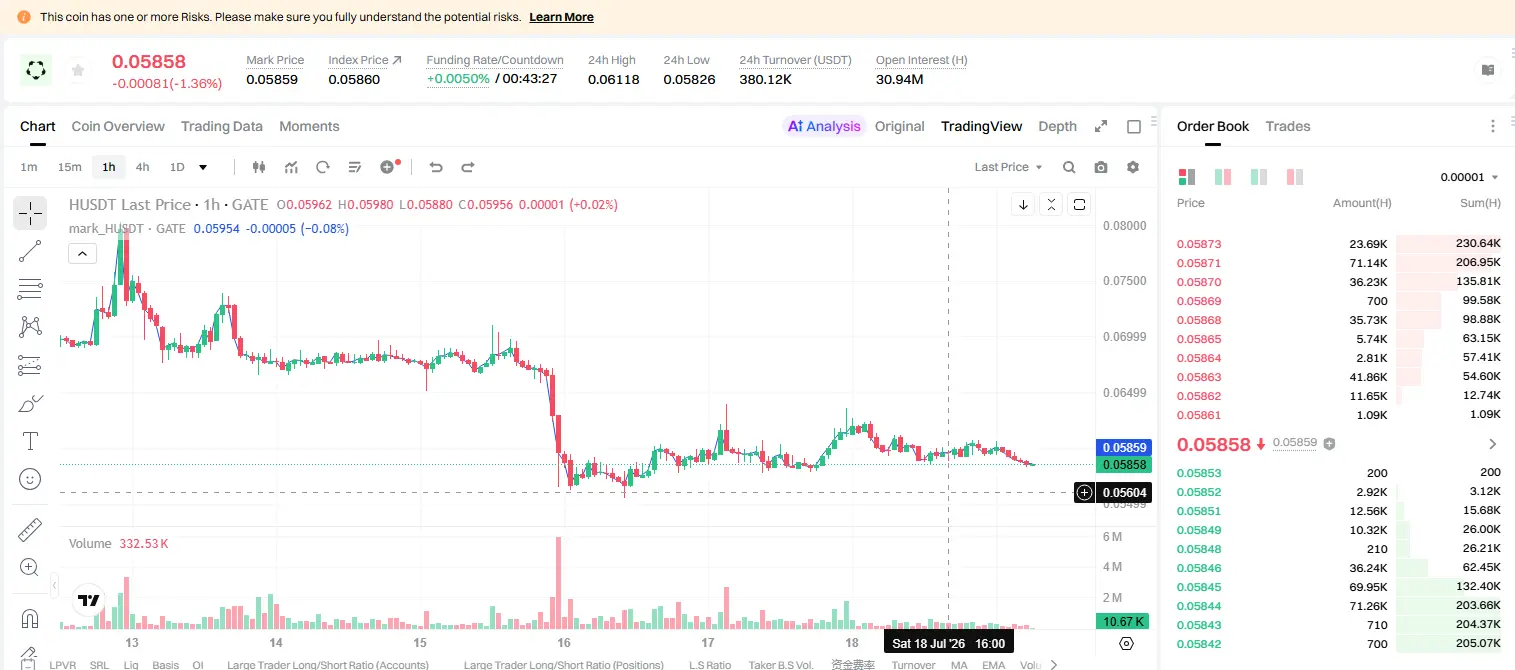
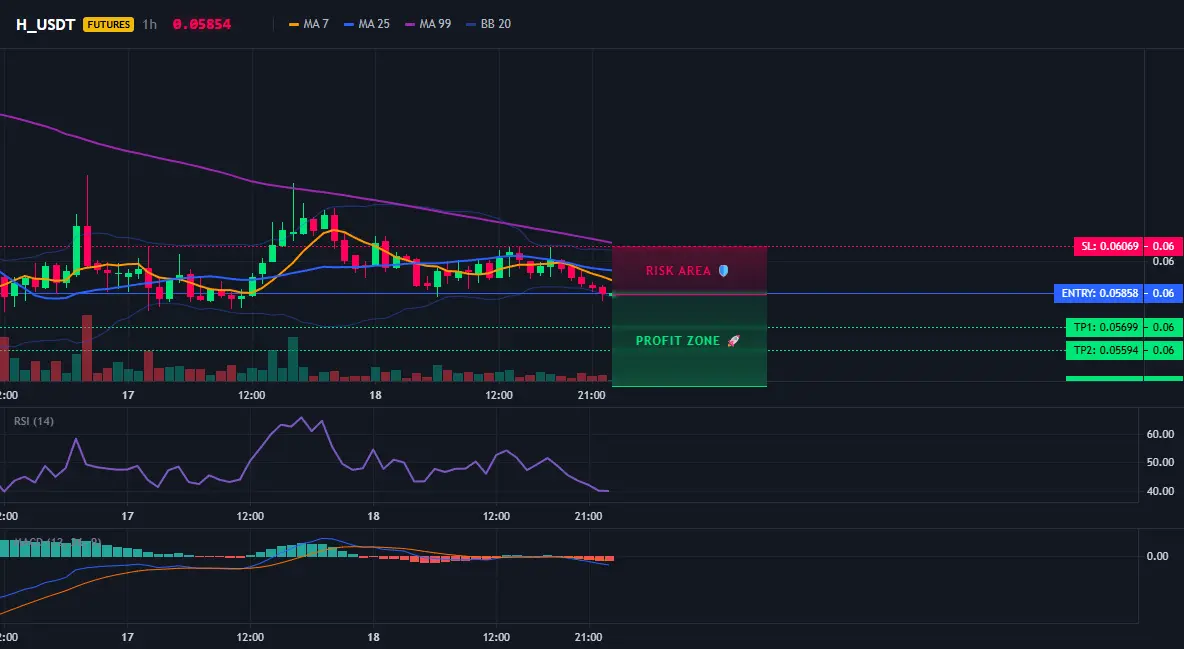
$H /USDT short — 95% win rate, do you dare to follow?

H_USDT - Go SHORT

Trading plan:
Entry: 0.05836 – 0.05880
SL: 0.06069
TP1: 0.05699
TP2: 0.05594
TP3: 0.05435

Why focus on this setup?
- 4-hour SHORT signal; the 1D trend is clearly bearish. RSI on the 15-minute chart is only 33.35—oversold, but not reversed.
- Entry at 0.05858; TP1 0.05699; TP2 0.05594; stop loss 0.06069; risk-reward looks good.
- Why now? EMA bearish alignment + high confidence; bearish momentum hasn’t faded.

Discussion:
Will this leg of the short hit TP2 first, or is it a stop-hunt rebound?
H-2.70%
View Original
post-image
post-image
  • Reward
  • Comment
  • Repost
  • Share
$HYPE has already more than 10x positions opened.
HYPE1.06%
View Original
post-image
post-image
  • Reward
  • Comment
  • Repost
  • Share
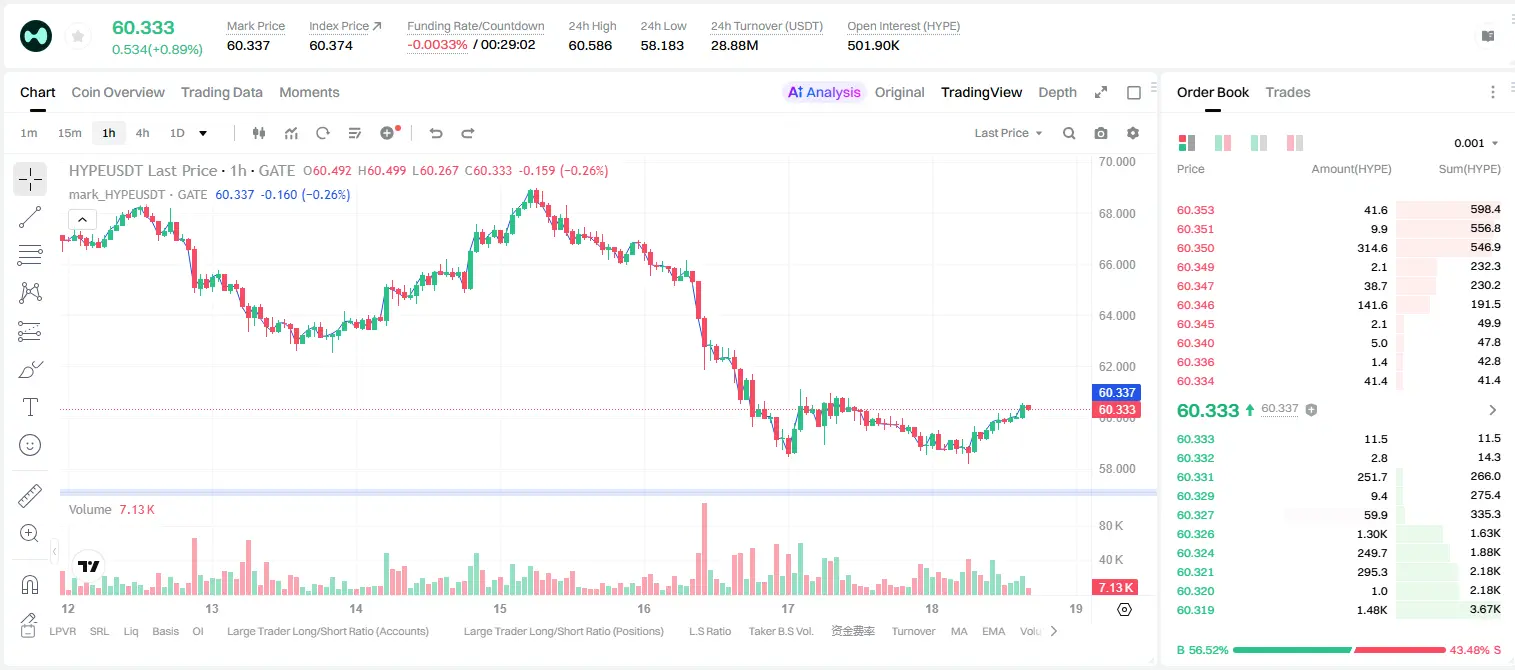
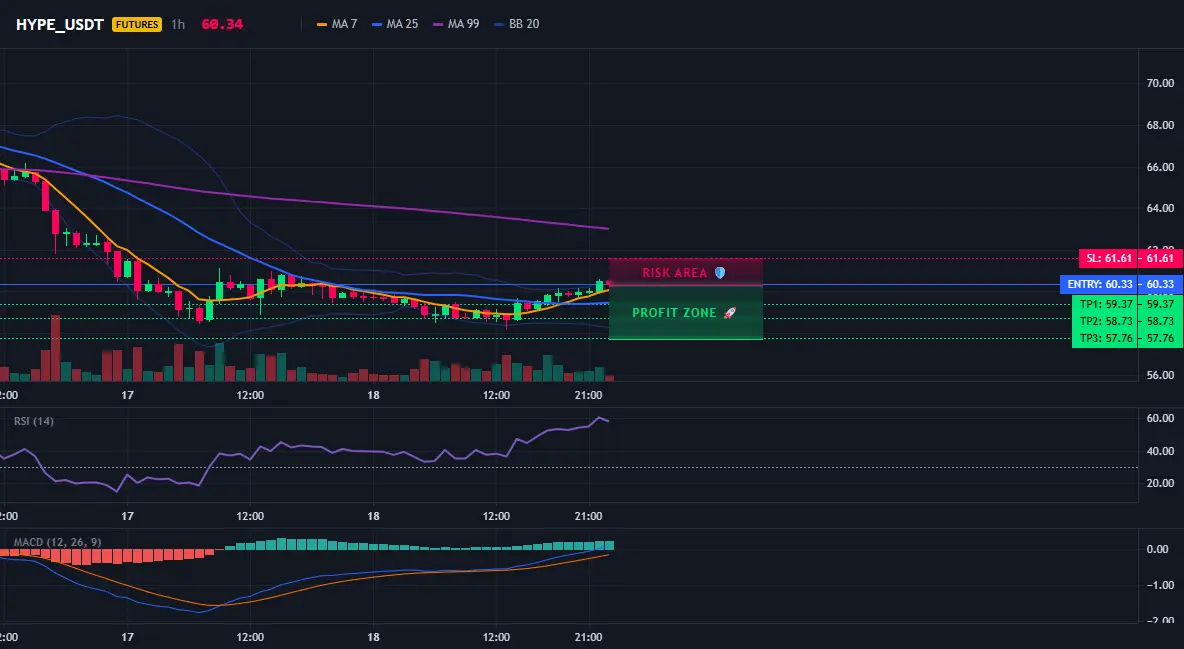
HYPE has a 4-hour bearish signal, but why am I still hesitating?

$HYPE /USDT - SHORT

Trading plan:
Entry: 60.20 – 60.46
SL: 61.61
TP1: 59.37
TP2: 58.73
TP3: 57.76

Why focus on this structure?
- Current HYPE price is 60.33; the 15-minute RSI is only 59.89, not overbought, and bearish momentum is insufficient.
- The 4-hour EMA suggests a bearish bias, but the daily chart is still ranging, and the direction hasn’t been confirmed.
- Key resistance is 61.61 (SL). If it breaks out, the short thesis is invalid; support below at 59.37 is the first target.
- Why now? In a ranging market, short tr
HYPE1.01%
View Original
post-image
post-image
  • Reward
  • Comment
  • Repost
  • Share
This rally wasn’t sudden—what really triggered it was the earlier period of price pressure. A lot of people got worn down until they had no temper left. I, on the other hand, feel that something is already off here. $XPIN repeatedly tested around 0.0012342; the key level didn’t keep sliding lower. When it was slammed, no one kept panicking and rushing to sell. This suggests the shorts’ pressure is starting to dissipate.

At the time, I was paying attention to XPIN’s follow-through, not whether a single candle looks good. Once the order book shifts from being passively beaten to actively push
XPIN-3.66%
BTC1.37%
ETH1.06%
View Original
post-image
  • Reward
  • Comment
  • Repost
  • Share
Load More

Join 40 M users in our growing community

⚡️ Join 40 M users in the crypto craze discussion
💬 Engage with your favorite top creators
👍 See what interests you
  • Pinned