Share crypto content and earn up to 60% commissions through content mining.
placeholder
gatefun
When you open the market screen in the morning, wake up instantly! 📉😎
A few days ago, before bed, $VVV was still grinding on it. It looked like it was building up for a move, but the more I watched, the more something felt off. The bounce had momentum, but the volume didn’t keep up—once it touched the upside, it went soft. This isn’t strength; it’s emptiness.
While everyone else is still watching, what I’m watching is VVV’s continuation/support 👀
When it spiked, no one stepped in to buy; when it fell back, it happened quickly again—showing that the overhead pressure is still there. At that
VVV-1.38%
BTC-1.60%
ETH-3.10%
View Original
post-image
  • Reward
  • Comment
  • Repost
  • Share
Tonight’s CPI: Full Coverage · Analysis
gate liveLIVE
2,927
  • Reward
  • 1
  • Repost
  • Share
SDyahaya:
let's support each other 💯
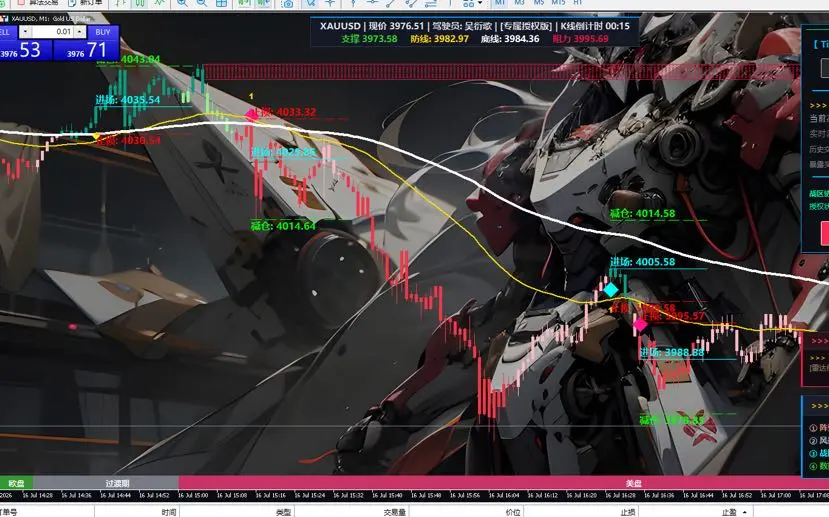
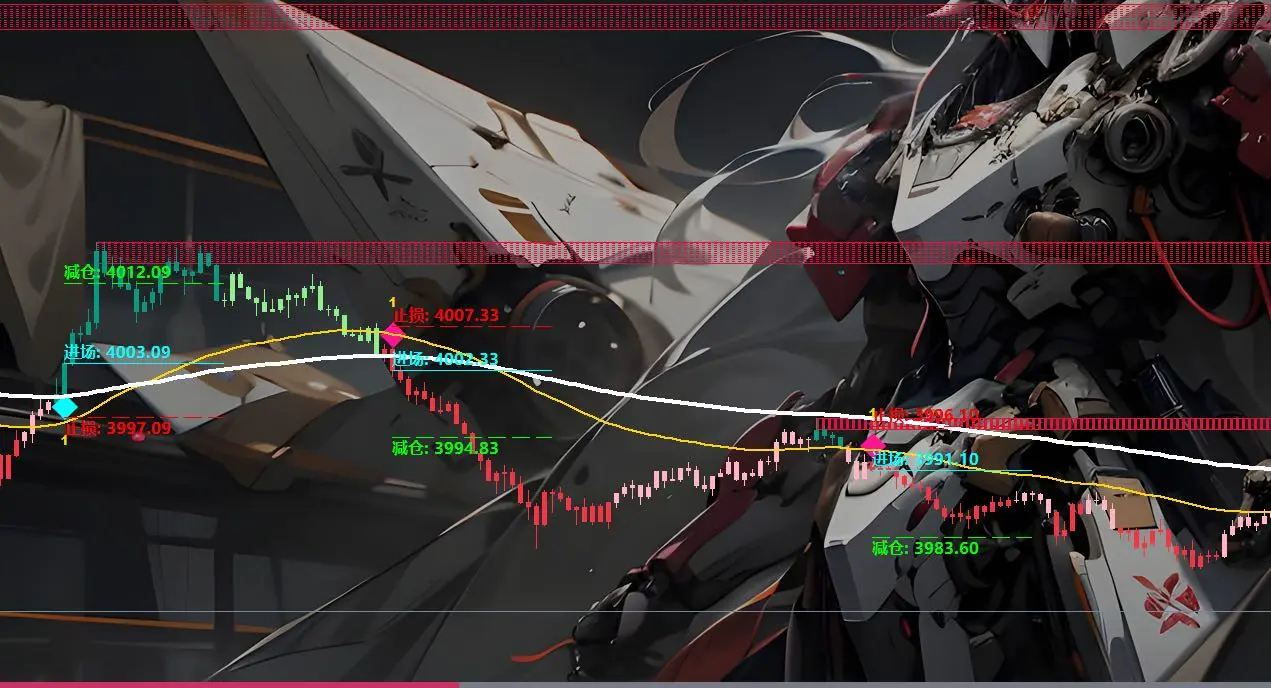
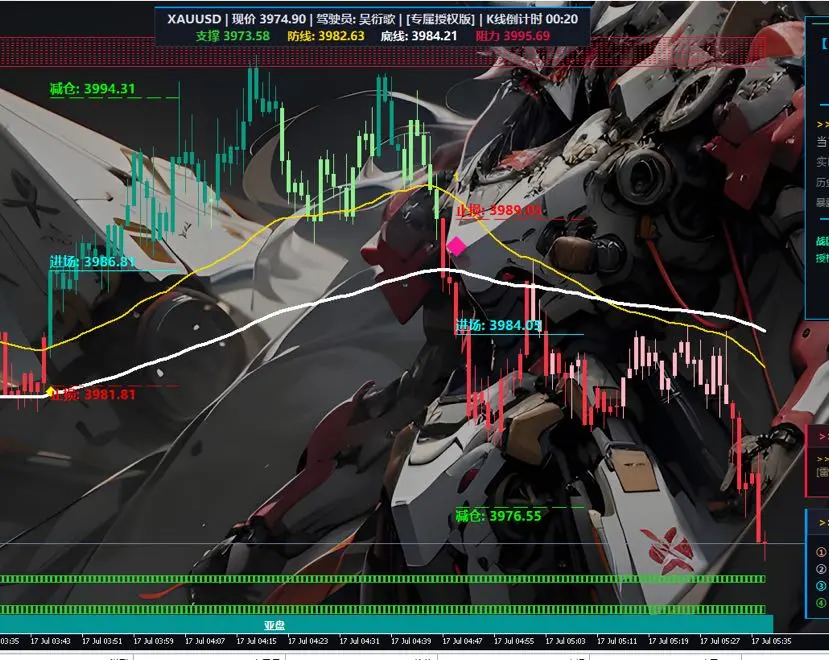
Gold price broke down on the 4-hour chart, and the shorts have set their sights on XAUT!
$XAUT /USDT - SHORT to sell
Trading plan:
Entry: 3975.6 – 3982.8
SL: 4013.4
TP1: 3953.5
TP2: 3936.4
TP3: 3910.7
Why pay attention to this structure?
- RSI (15 minutes) is 41.33, momentum is weak, and the 4-hour short trend continues.
- Current price is 3979. TP1=3953.5, TP2=3936.4, SL=4013.4, with a reward-to-risk ratio of 1:2 or higher.
- The 1-day trend is clearly bearish—why short now? Because the 4-hour EMA is being suppressed + a high-confidence signal has already been triggered.
Discussion:
Will this
XAUT-1.73%
View Original
post-image
post-image
  • Reward
  • Comment
  • Repost
  • Share
Don’t say—this round really gives face. 📉🔥 A few days ago, when the afternoon board was pushing up, a lot of people looked pretty excited, but I was watching the details: heavy resistance overhead, and the volume still wouldn’t cooperate.

While everyone was still watching, $PIPPIN every bounce was just about about to “leak,” and it clearly didn’t have the flavor of a strong continuation. I gave a slightly bearish handling at the time: going long was not the reference; instead, I said to watch it fall back and whether it would兑现. Reference 0.0211, first see if it pulls back and whether it
PIPPIN0.61%
BTC-1.60%
ETH-3.10%
View Original
post-image
  • Reward
  • Comment
  • Repost
  • Share
Gn ct 💙
Don't give up no matter what
See you tomorrow
post-image
  • Reward
  • Comment
  • Repost
  • Share
$febu back over 2 million Mc
post-image
  • Reward
  • Comment
  • Repost
  • Share
No??? This isn’t basically like picking up money, is it??? 🚀🔥 A few days ago, in the early hours, the chart was still just grinding. $NEAR kept pressing it down without moving. A lot of people found it annoying to watch, but I ended up watching even more closely.

At the time, what I saw was simple: the key levels hadn’t been broken, the bottom range hadn’t been smashed through, and the selling pressure was clearly easing. 📌 So I gave the signal to open long. The entry was around 1.7853. Don’t wait until it starts running before thinking about getting on the train.
Now the answer is her
NEAR-5.22%
BTC-1.60%
ETH-3.10%
View Original
post-image
  • Reward
  • Comment
  • Repost
  • Share
It was still being ground down a few days ago—today it’s directly giving the answer! 📉🎯 This kind of high-level back-and-forth is the easiest way to mess up people’s emotions, but precisely in moments like this you have to watch how price takes hold.
The last glance before sleep: when $OPG surged, it clearly didn’t have momentum. The overhead resistance has been pressing the whole time, and the buy side couldn’t hold👀 I was already prompting to go long around 0.1321. The logic was simple: the rebound lacked strength—then it’s just about waiting for the pullback to realize.
Now the price is
OPG-2.29%
BTC-1.60%
ETH-3.10%
View Original
post-image
  • Reward
  • Comment
  • Repost
  • Share
Guys, who gets it! This round of dropping hard is really invigorating to watch📉🔥 A few days ago, before bed, the chart was still grinding at a high level. Every time $ONDO surged, it was just short by a breath—I noticed the volume didn’t keep up and the overhead resistance was clearly strong, so I judged this spot wasn’t suitable for hard chasing. Instead, I had to watch for short opportunities.
The short entry I gave back then was at 0.3997. Now the price is at 0.3618, and the profit is already up to +457.84%—this piece of meat is eaten so comfortably🎯💰 It was really grinding before, and
ONDO-1.23%
BTC-1.60%
ETH-3.10%
View Original
post-image
  • Reward
  • Comment
  • Repost
  • Share
After this round of selloff, the tape’s “feel” is very clear. $NEAR has been grinding sideways at high levels for a while; many people think that if it hasn’t dropped yet, it’s strong. I actually think this is very dangerous here, because the price can’t go up—if time drags on, it will just wear down the bulls’ patience.

I opened a short around 2.5382. I’m not looking at just a single candlestick, but several consecutive attempts to push higher that all failed. To put it simply, the rhythm has changed: the buy-side can’t keep up. The weaker the rebound, the higher the probability that the ne
NEAR-5.22%
BTC-1.60%
ETH-3.10%
View Original
post-image
  • Reward
  • Comment
  • Repost
  • Share
Is this SNDK rebound a trap or a real breakout?
$SNDK /USDT - Go LONG
Trading plan:
Entry: 1379.73 – 1397.93
SL: 1275.25
TP1: 1474.01
TP2: 1530.80
TP3: 1615.99
Why pay attention to this structure?
- 4H LONG signal, confidence 77%, current price around 1388, near the support zone.
- 15-minute RSI is only 31, in the oversold area, with a high probability of a short-term rebound.
- Targets: TP1 1474 (+6%), TP2 1530 (+10%), SL 1275 (-8%), with a reasonable risk-reward ratio.
- Why now? RSI is low + the lower end of range consolidation; going long has a higher win rate than chasing shorts.
Discussi
SNDK-14.06%
View Original
post-image
post-image
  • Reward
  • Comment
  • Repost
  • Share
This sell-off was very typical just now: first it wicks up a bit, then it directly presses down the ones chasing longs. The high-range move in $BAS looks lively, but in reality the follow-through was already very thin. The real change came after it swept the short-term longs—there was no further push higher.

Earlier, I already paid attention to this zone. Around 0.028373, I chose to open a short—not because I was shouting aggressively, but because the order book gave confirmation: long upper wicks, weak bounce-backs, and a fast pullback. Most people were still hesitating at the time, whether
BAS8.85%
BTC-1.60%
ETH-3.10%
View Original
post-image
  • Reward
  • Comment
  • Repost
  • Share
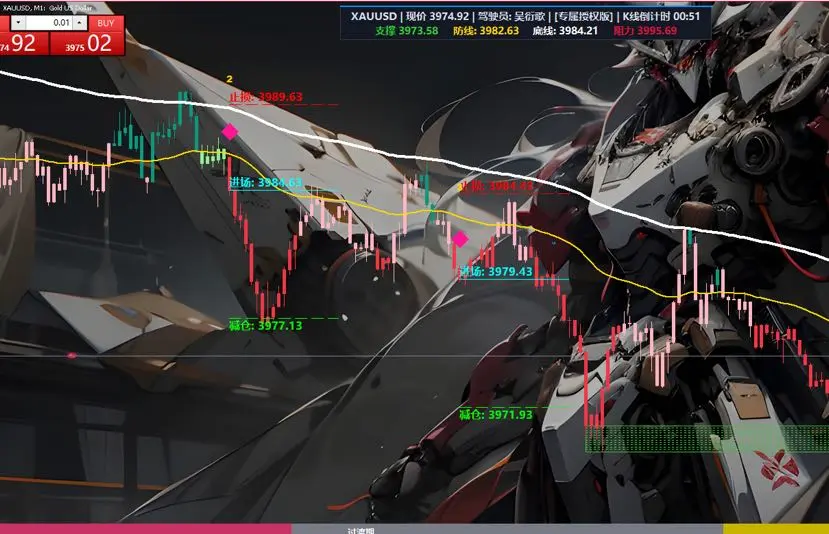
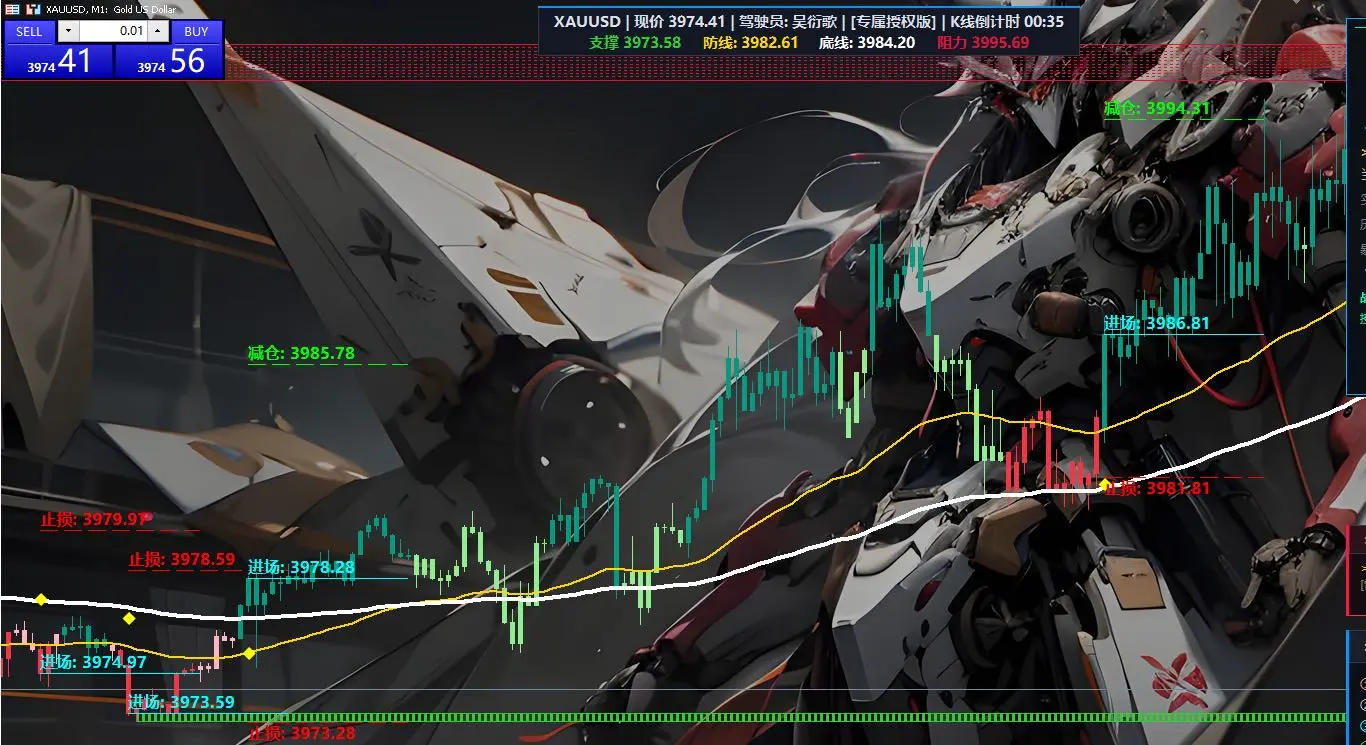
Gold 3983 short order is already placed. Is this time going to drop to 3913?
$XAU /USDT - SHORT
Trading plan:
Entry: 3979.88 – 3987.20
SL: 4018.67
TP1: 3957.19
TP2: 3939.62
TP3: 3913.27
Why watch this structure?
- On the 4H timeframe, the bearish signal is activated; RSI on the 15-minute chart has broken below 42, and momentum is weak
- On the daily chart, range-bound consolidation; bulls can’t break through with strength, and short opportunities appear
- TP1 at 3957, TP2 at 3939; stop loss at 4018—risk-reward is reasonable
- Why now? Weak RSI + 4H trend confirmation—shorts have the edge in th
XAU-1.81%
View Original
post-image
post-image
  • Reward
  • Comment
  • Repost
  • Share
The moment I opened the chart in the morning, it completely smashed my sleepiness away! 🚨📉
A few days ago around midnight, $PEPE was still moving back and forth above. It looked quite solid on the surface, but if you look closely it was all fake: endless pumping upward, weak follow-through, and it fell back as soon as it got pressed from above.

While everyone was still watching from the sidelines, what I was looking at was the 👀 feedback after each PEPE rebound—when it pushed up, there was no sustained follow-through, which showed that the area above wasn’t easy. Back then, I followed th
PEPE-2.76%
BTC-1.60%
ETH-3.10%
View Original
post-image
  • Reward
  • Comment
  • Repost
  • Share
What really caught my attention was the change after $XLM ’s rebound failed. At first glance it looks like just a pullback, but in the details you can see that the fund inflows to take over have already started to weaken.

My view is that after pressure builds at the top, if the price keeps failing to reclaim a key zone for a long time, the risk will be amplified. After entering around 0.20037, as the price moved to 0.19031, the feedback from the chart became fairly clear.

This return of +356.24% wasn’t because the market moved smoothly in our favor—it was because we were patient and waited
XLM-1.80%
BTC-1.60%
ETH-3.10%
View Original
post-image
  • Reward
  • Comment
  • Repost
  • Share
This move is really a bit ridiculous! 🔥📉 A few days ago, at dawn, it was still hovering up there, going back and forth. The chart looked like it was going to break higher, but every time it surged, it just missed by a breath. I said back then not to get carried away and go all in.

When it was grinding at the top during the session, $TSLAX ’s volume clearly didn’t keep up. The buy side didn’t dare to absorb, and the bounce got pulled higher and higher but thinner. I judged that this stretch was more suitable to watch for a drop. I set the long entry level at 444.42, and would wait for it t
TSLAX-1.61%
BTC-1.60%
ETH-3.10%
View Original
post-image
  • Reward
  • Comment
  • Repost
  • Share
This sell-off just now wasn’t most clearly about the size of the drop—it was that the rebound couldn’t hold at all. $SKYAI ground around at the high for so long; many people thought it was building up power, but what I saw was that the support was getting weaker and weaker.
What really made me take action was that pullback near 0.21690. Price gave an upswing move, but it didn’t get follow-through. Then sell-side orders started to press very tightly. Something was already off here—especially with short-term longs still stubbornly waiting for a comeback; the chart had already weakened first.
No
SKYAI14.67%
BTC-1.60%
ETH-3.10%
View Original
post-image
  • Reward
  • Comment
  • Repost
  • Share
Record the process of $POWER this time. At the very beginning, I didn’t rush to reach a conclusion; instead, after the price repeatedly met resistance at high levels, I slowly confirmed the direction.
In my review, the key point was that the rebound didn’t continue, and the support kept getting weaker. After the opening position at 0.08991, the price gradually fell back to 0.08145, and the bears’ momentum became clearly apparent.
There were also some tug-of-war moments along the way, but they didn’t change the main trend. +185.05% was the result of this downswing feedback. Once the profit came
POWER-1.16%
BTC-1.60%
ETH-3.10%
View Original
post-image
  • Reward
  • Comment
  • Repost
  • Share
$TRADOOR Watch for short opportunities. The current price is stuck in the range 0.41600 to 0.41720, and the seller momentum may be building. From a higher-level perspective, the short structure remains intact, and at the daily level this area still looks bearish. The 15-minute RSI is currently around 43; there seems to be room for further downside, and the volume data also confirms genuine seller participation. On the downside, watch for levels around 0.41240 and even 0.40530, with a defense around 0.42230. Be mindful of risk when trading contracts—set a stop-loss and don’t go in too aggressi
TRADOOR-4.40%
View Original
post-image
  • Reward
  • Comment
  • Repost
  • Share
Load More

Join 40 M users in our growing community

⚡️ Join 40 M users in the crypto craze discussion
💬 Engage with your favorite top creators
👍 See what interests you
  • Pinned