Bitcoin (BTC), Ethereum (ETH), and Ripple (XRP) prices remained largely flat during Monday’s trading session after experiencing a sharp correction week with declines of approximately 9%, 8%, and 10%, respectively. Currently, BTC hovers around the $70,000 mark, while ETH and XRP continue to fail in their attempts to break through key resistance levels. Analysts recommend investors remain cautious: although the market shows signs of temporary stabilization, the recovery potential for the top three cryptocurrencies remains limited amid a prevailing downward trend.
Bitcoin Faces Rejection at the Daily Resistance Zone Near $73,000
Bitcoin experienced a volatile week, dropping nearly 10% to a low of $60,000 on Friday before quickly rebounding. The recovery allowed BTC to test the daily resistance zone around $73,072 on Sunday. As of Monday, the largest cryptocurrency by market cap is trading around $70,700.
In a positive scenario, if the upward momentum continues, Bitcoin could extend its rally and revisit the important resistance level at $73,072.
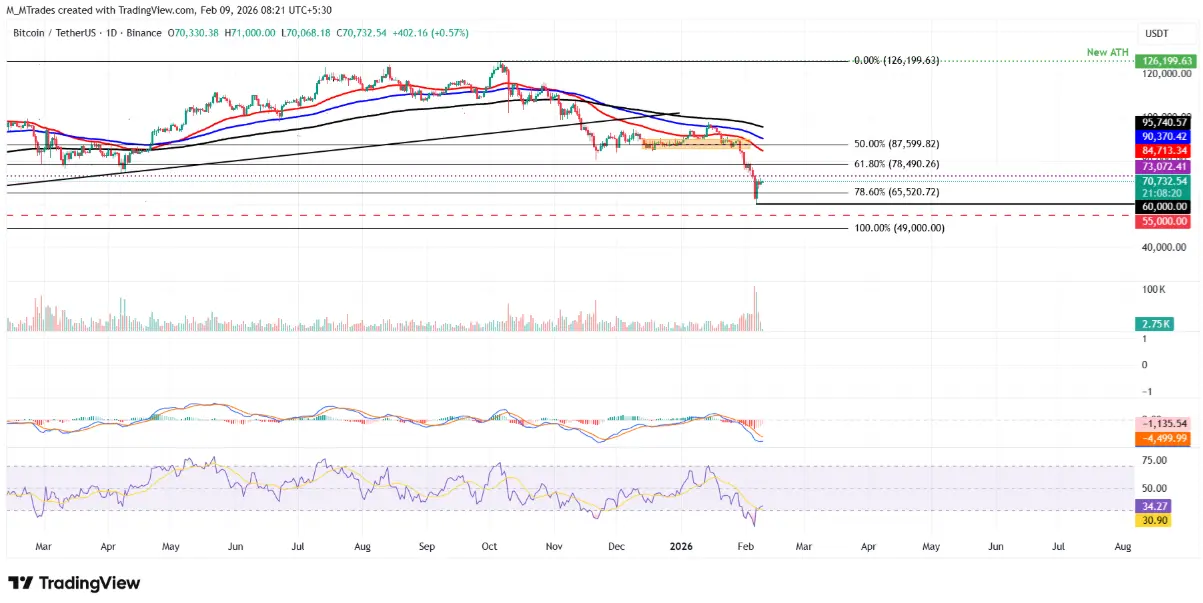 Daily BTC/USDT Chart | Source: TradingView Technical indicators are sending mixed signals. The daily RSI is currently at 34 and trending upward after bouncing from oversold levels last week, indicating selling pressure is weakening and a recovery is gradually forming. However, investors should remain cautious as the MACD has shown a bearish crossover, implying that the downtrend has not been fully invalidated.
Conversely, if selling pressure resumes and the downtrend persists, Bitcoin’s price could extend its correction toward the Fibonacci retracement level of 78.6%, around $65,520. This level is derived from the August 2024 low of $49,000 up to the October 2025 all-time high of $126,199 and is considered a significant medium-term support zone.
Ethereum Approaching Key Resistance at $2,150
Ethereum’s price experienced a sharper correction of over 8% last week, falling to a low of $1,747 on Friday — the lowest since May 6, 2025 — before rebounding significantly to $2,149 on Sunday. As of Monday, ETH remains oscillating around $2,149, indicating that buying interest has emerged but has not yet overwhelmed selling pressure.
In a negative scenario, if selling pressure continues to dominate, Ethereum is likely to retest the recent low at $1,747.
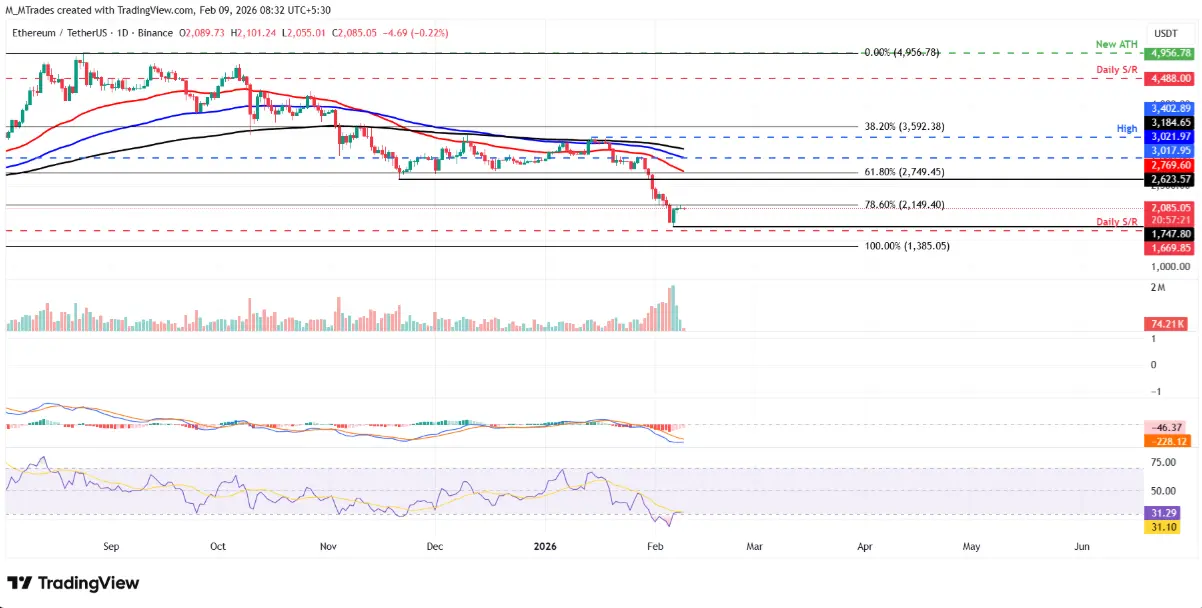 Daily ETH/USDT Chart | Source: TradingView From a technical perspective, the daily RSI is at 31, approaching oversold territory, reflecting that momentum is still in favor of the bears. Meanwhile, the MACD remains in a bearish crossover, further reinforcing a short-term negative outlook.
On the other hand, if ETH can break above and close above $2,149 on the daily timeframe, the recovery could be extended toward the next significant resistance zone around $2,500.
XRP Tests the Lower Boundary of the Descending Wedge Pattern
XRP lost the lower trendline of the descending wedge pattern on Thursday, then plummeted to a low of $1.11 on Friday. However, within the same day, the price rebounded to retest the broken support zone and continued to consolidate around this area throughout the weekend. As of writing, XRP is trading near $1.44.
If selling pressure continues to dominate, XRP risks extending its decline and retreating toward the important weekly support zone at $1.30.
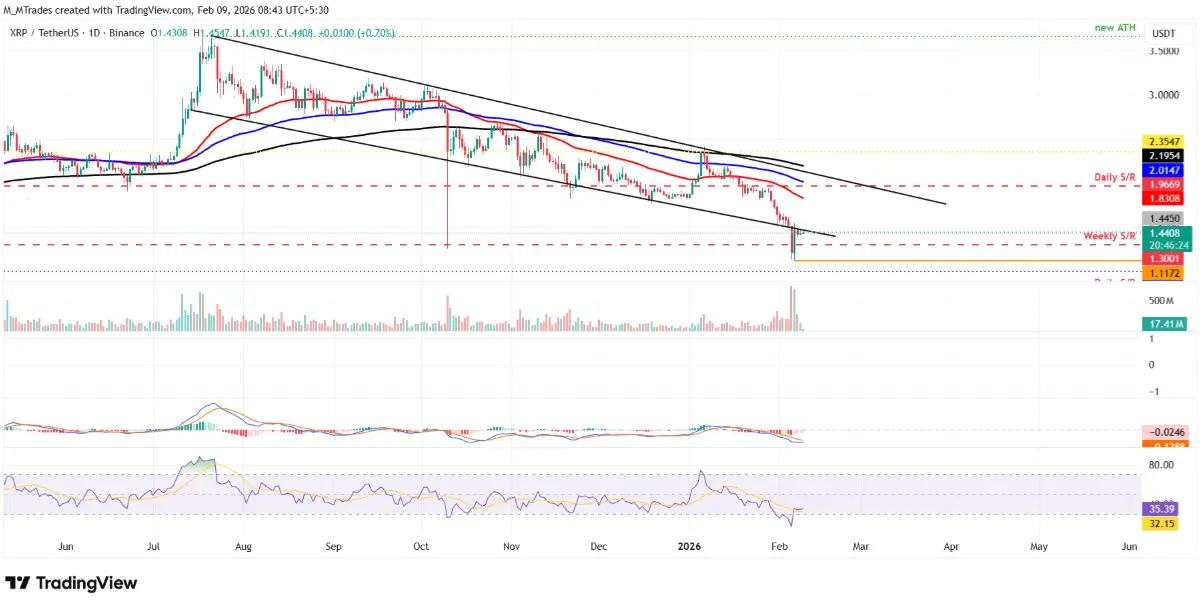 Daily XRP/USDT Chart | Source: TradingView Notably, similar to Ethereum, XRP’s momentum indicators such as RSI and MACD are also leaning toward a negative scenario, indicating that downside risk remains present.
Conversely, if XRP regains and closes firmly above the lower boundary of the descending wedge pattern, the recovery could be strengthened, paving the way for a move upward to test the 50-day EMA around $1.83.
Disclaimer: The information on this page may come from third parties and does not represent the views or opinions of Gate. The content displayed on this page is for reference only and does not constitute any financial, investment, or legal advice. Gate does not guarantee the accuracy or completeness of the information and shall not be liable for any losses arising from the use of this information. Virtual asset investments carry high risks and are subject to significant price volatility. You may lose all of your invested principal. Please fully understand the relevant risks and make prudent decisions based on your own financial situation and risk tolerance. For details, please refer to
Disclaimer.
