Trade
Basic
Futures
Futures
Hundreds of contracts settled in USDT or BTC
TradFi
Gold
Trade global traditional assets with USDT in one place
Options
Hot
Trade European-style vanilla options
Unified Account
Maximize your capital efficiency
Demo Trading
Futures Kickoff
Get prepared for your futures trading
Futures Events
Participate in events to win generous rewards
Demo Trading
Use virtual funds to experience risk-free trading
Earn
Launch
CandyDrop
Collect candies to earn airdrops
Launchpool
Quick staking, earn potential new tokens
HODLer Airdrop
Hold GT and get massive airdrops for free
Launchpad
Be early to the next big token project
Alpha Points
Trade on-chain assets and enjoy airdrop rewards!
Futures Points
Earn futures points and claim airdrop rewards
Investment
Simple Earn
Earn interests with idle tokens
Auto-Invest
Auto-invest on a regular basis
Dual Investment
Buy low and sell high to take profits from price fluctuations
Soft Staking
Earn rewards with flexible staking
Crypto Loan
0 Fees
Pledge one crypto to borrow another
Lending Center
One-stop lending hub
VIP Wealth Hub
Customized wealth management empowers your assets growth
Private Wealth Management
Customized asset management to grow your digital assets
Quant Fund
Top asset management team helps you profit without hassle
Staking
Stake cryptos to earn in PoS products
Smart Leverage
New
No forced liquidation before maturity, worry-free leveraged gains
GUSD Minting
Use USDT/USDC to mint GUSD for treasury-level yields
More
Happy_Bird
🧠 Why Most Crypto Traders Fail — And How Market Logic, Liquidity, and Discipline Change Everything
The crypto market is often described as volatile, unpredictable, and chaotic. However, this perception mostly exists among traders who rely on opinions, emotions, or lagging indicators. In reality, crypto markets operate on clear structural principles. Price moves with intent, not randomness.
This deep dive explains why the majority of traders lose, and how understanding liquidity, market structure, psychology, and risk management creates a professional framework for consistent decision-making.

- Reward
- 2
- Comment
- Repost
- Share
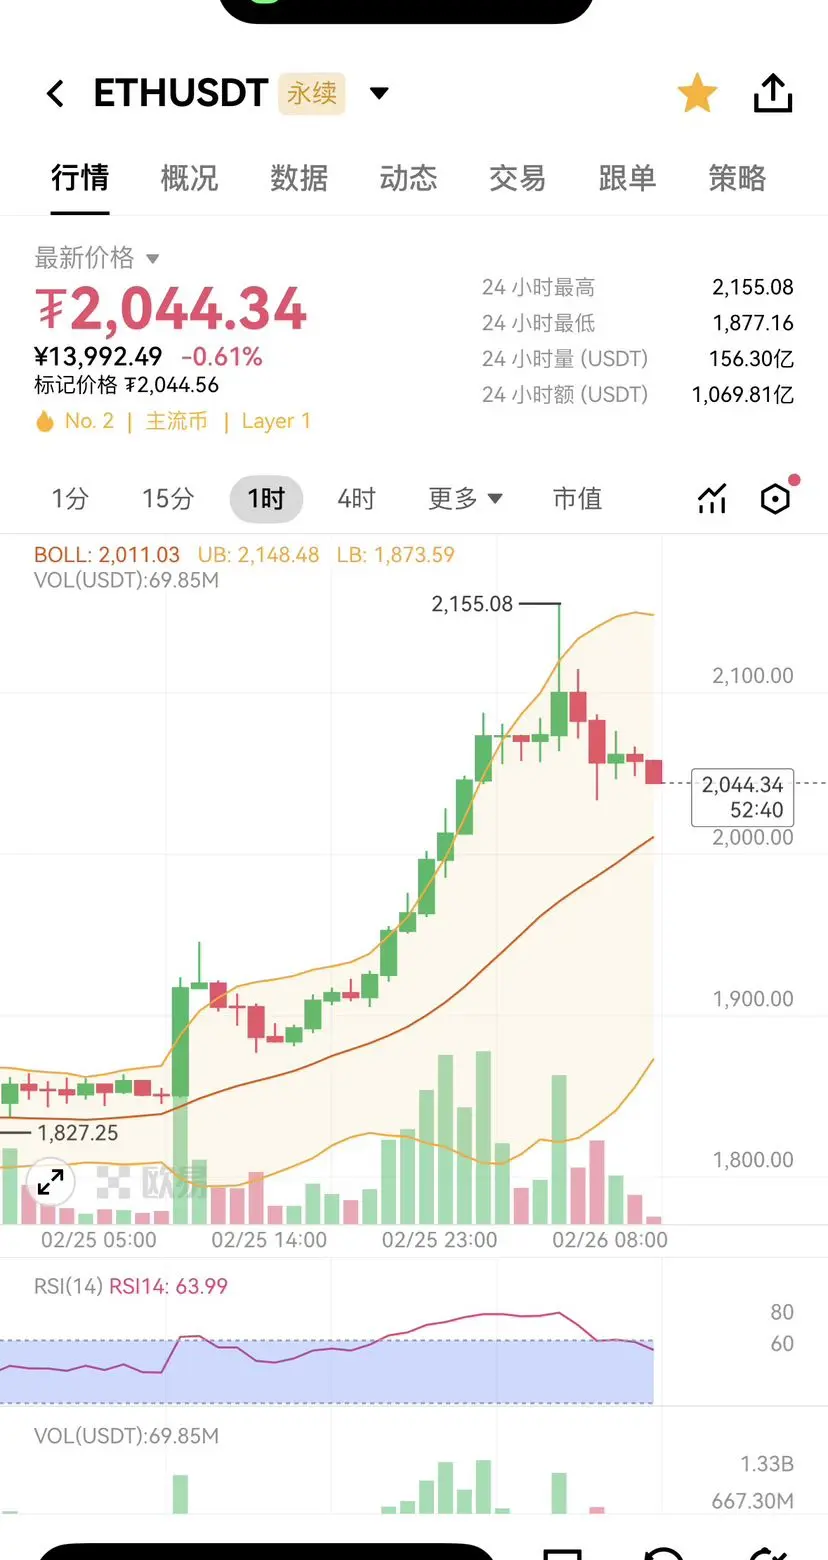
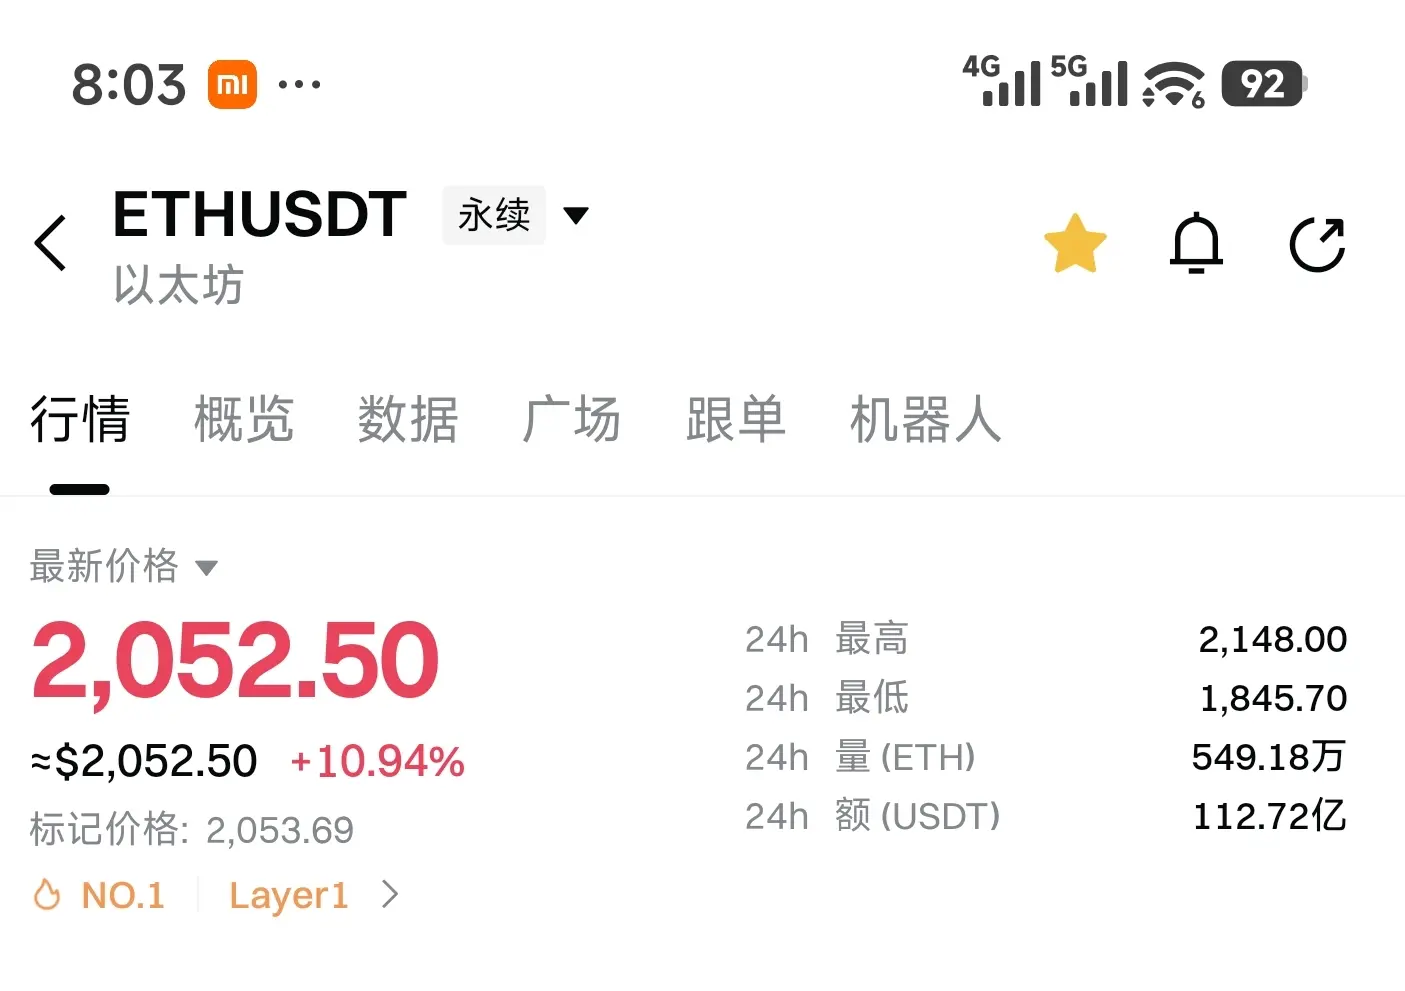
Yesterday, the starting point for Ethereum's rise was 1845, and the previous day's low was 1960. Around 1870 yesterday, I recommended reducing short positions. I didn't expect it to reach 2150 in the evening. I thought if it broke 1960, reaching 2000 would be no problem.
Here's the trading idea for today: yesterday's increase was too large, about 12%. During the day, there was a need for a short-term pullback. I lean towards a cautious short view—either not shorting or taking small positions. Today's plan is to go long at lower levels, with the support levels for long positions at 1960 and 184
Here's the trading idea for today: yesterday's increase was too large, about 12%. During the day, there was a need for a short-term pullback. I lean towards a cautious short view—either not shorting or taking small positions. Today's plan is to go long at lower levels, with the support levels for long positions at 1960 and 184
ETH6,65%
- Reward
- 2
- Comment
- Repost
- Share
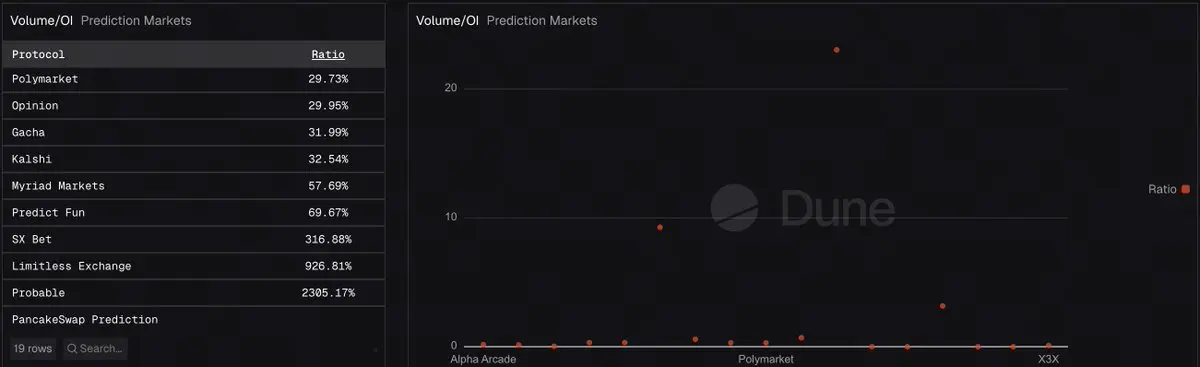
Using Polymarket as a benchmark, the real-time Vol/OI ratios for prediction markets from lowest to highest are:
- Polymarket: 29.73%
- Opinion: 29.95%
- Kalshi: 32.54%
- Myriad: 57.69%
- Predict Fun: 69.67%
- Limitless: 926.81%
- Probable: 2,305.17%
View Original- Polymarket: 29.73%
- Opinion: 29.95%
- Kalshi: 32.54%
- Myriad: 57.69%
- Predict Fun: 69.67%
- Limitless: 926.81%
- Probable: 2,305.17%
- Reward
- like
- Comment
- Repost
- Share
whotookmyP
wtp
Created By@expexpert
Subscription Progress
0.00%
MC:
$0
More Tokens
The 2060 loss position has finally been recovered 🤐, the one-sided market is really disgusting
View Original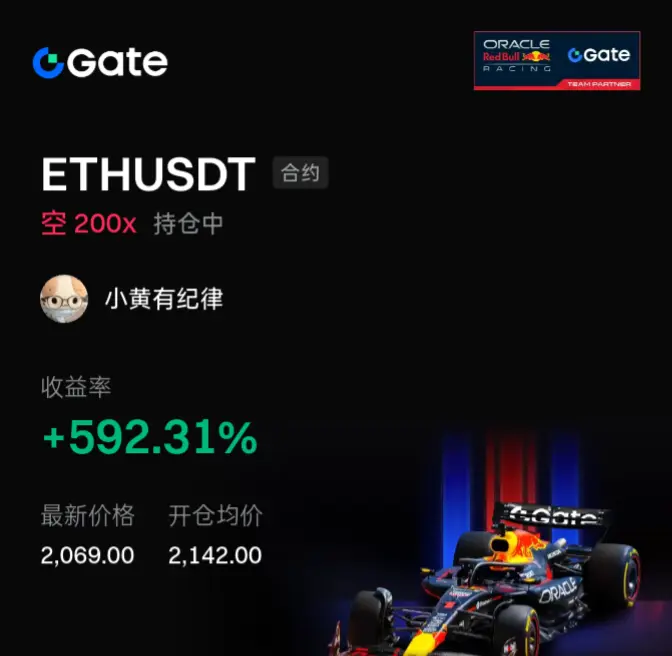
[The user has shared his/her trading data. Go to the App to view more.]
- Reward
- like
- Comment
- Repost
- Share
Opportunities in the crypto space come every day, but some campaigns truly deserve attention. GateSquare's #GateSquare$50KRedPacketGiveaway Red Packet Giveaway is one of those exciting events that offers the perfect mix of community engagement, rewards, and smart participation. If you're a crypto enthusiast, trader, or just looking to explore the ecosystem, this giveaway is a fantastic chance.
GateSquare's Red Packet concept is simple yet thrilling. The idea is for users to participate in platform activities, increase engagement, and unlock rewards. But the real fun lies in the unpredictabilit
View OriginalGateSquare's Red Packet concept is simple yet thrilling. The idea is for users to participate in platform activities, increase engagement, and unlock rewards. But the real fun lies in the unpredictabilit


- Reward
- 2
- 4
- Repost
- Share
StylishKuri:
To The Moon 🌕View More
Crypto Daily Report #马年开工第一帖 02.26 (: Bitcoin Breaks $68,000, Institutional Accumulation and Short Liquidations Resonating, Market Correlation Significantly Weakening
1. Bitcoin Price Trends and Technical Analysis
1. Bitcoin has recently fluctuated between $62,000 and $68,000. The four-hour technical chart shows the price briefly breaking through the midline but facing selling pressure and pulling back. The MACD indicator shows increasing bullish momentum but may be losing strength. The Bollinger Bands' middle line is resisting at $68,000, with support at $63,000–$64,000.
2. Regarding trading
View Original1. Bitcoin Price Trends and Technical Analysis
1. Bitcoin has recently fluctuated between $62,000 and $68,000. The four-hour technical chart shows the price briefly breaking through the midline but facing selling pressure and pulling back. The MACD indicator shows increasing bullish momentum but may be losing strength. The Bollinger Bands' middle line is resisting at $68,000, with support at $63,000–$64,000.
2. Regarding trading


[The user has shared his/her trading data. Go to the App to view more.]
- Reward
- like
- Comment
- Repost
- Share

High Volatility in BTC/ETH/SOL —washout or trend reversal
90
- Reward
- like
- Comment
- Repost
- Share
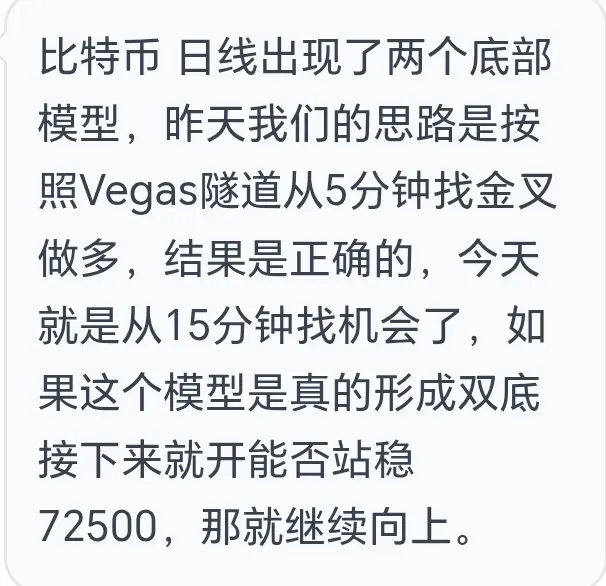
2.26 Morning Analysis
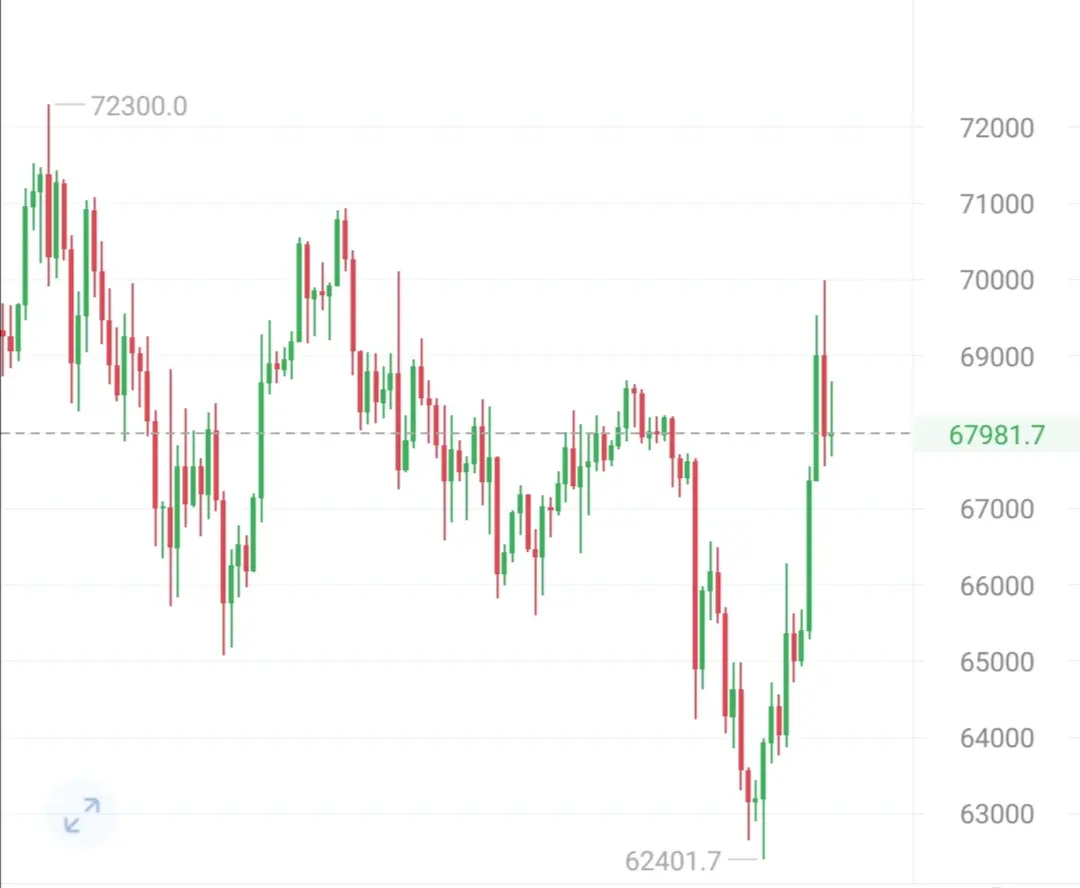
Recently, the overall market remains dominated by a bearish trend. In the early hours, the bears briefly paused, and the bulls launched a quick counterattack. The price surged to the 70,000 level before facing resistance and pulling back. This rapid rally was quite abrupt. Currently, Bitcoin is consolidating around 68,300.
On the 4-hour chart, indicators show a golden cross, with both lines diverging upward. The MACD red histogram is gradually increasing, indicating a temporary rebound in bullish momentum. However, the candlestick pattern shows a V-shaped rebound. Althoug
BTC3,06%
- Reward
- 2
- Comment
- Repost
- Share
A rebound is the best opportunity to short at high levels. Don't be afraid, don't panic. This is another chance. Go short boldly, target 57,800.
View Original- Reward
- 1
- Comment
- Repost
- Share
🧠 Liquidity, Structure, and Psychology: The Hidden Framework Behind Crypto Price Movements
Most crypto traders spend their time searching for the perfect indicator or the next big narrative. Yet despite endless tools and information, consistency remains rare. The reason is simple: price does not move because of indicators or opinions — it moves because of liquidity, structure, and human psychology.
This deep dive explains the core framework that quietly drives crypto markets and why understanding it changes how traders approach risk, entries, and expectations.
📌 Liquidity: The True Fuel of t

- Reward
- 7
- Comment
- Repost
- Share
汗血宝马
汗血宝马
Created By@gatefunuser_22b1
Listing Progress
100.00%
MC:
$8.28K
More Tokens
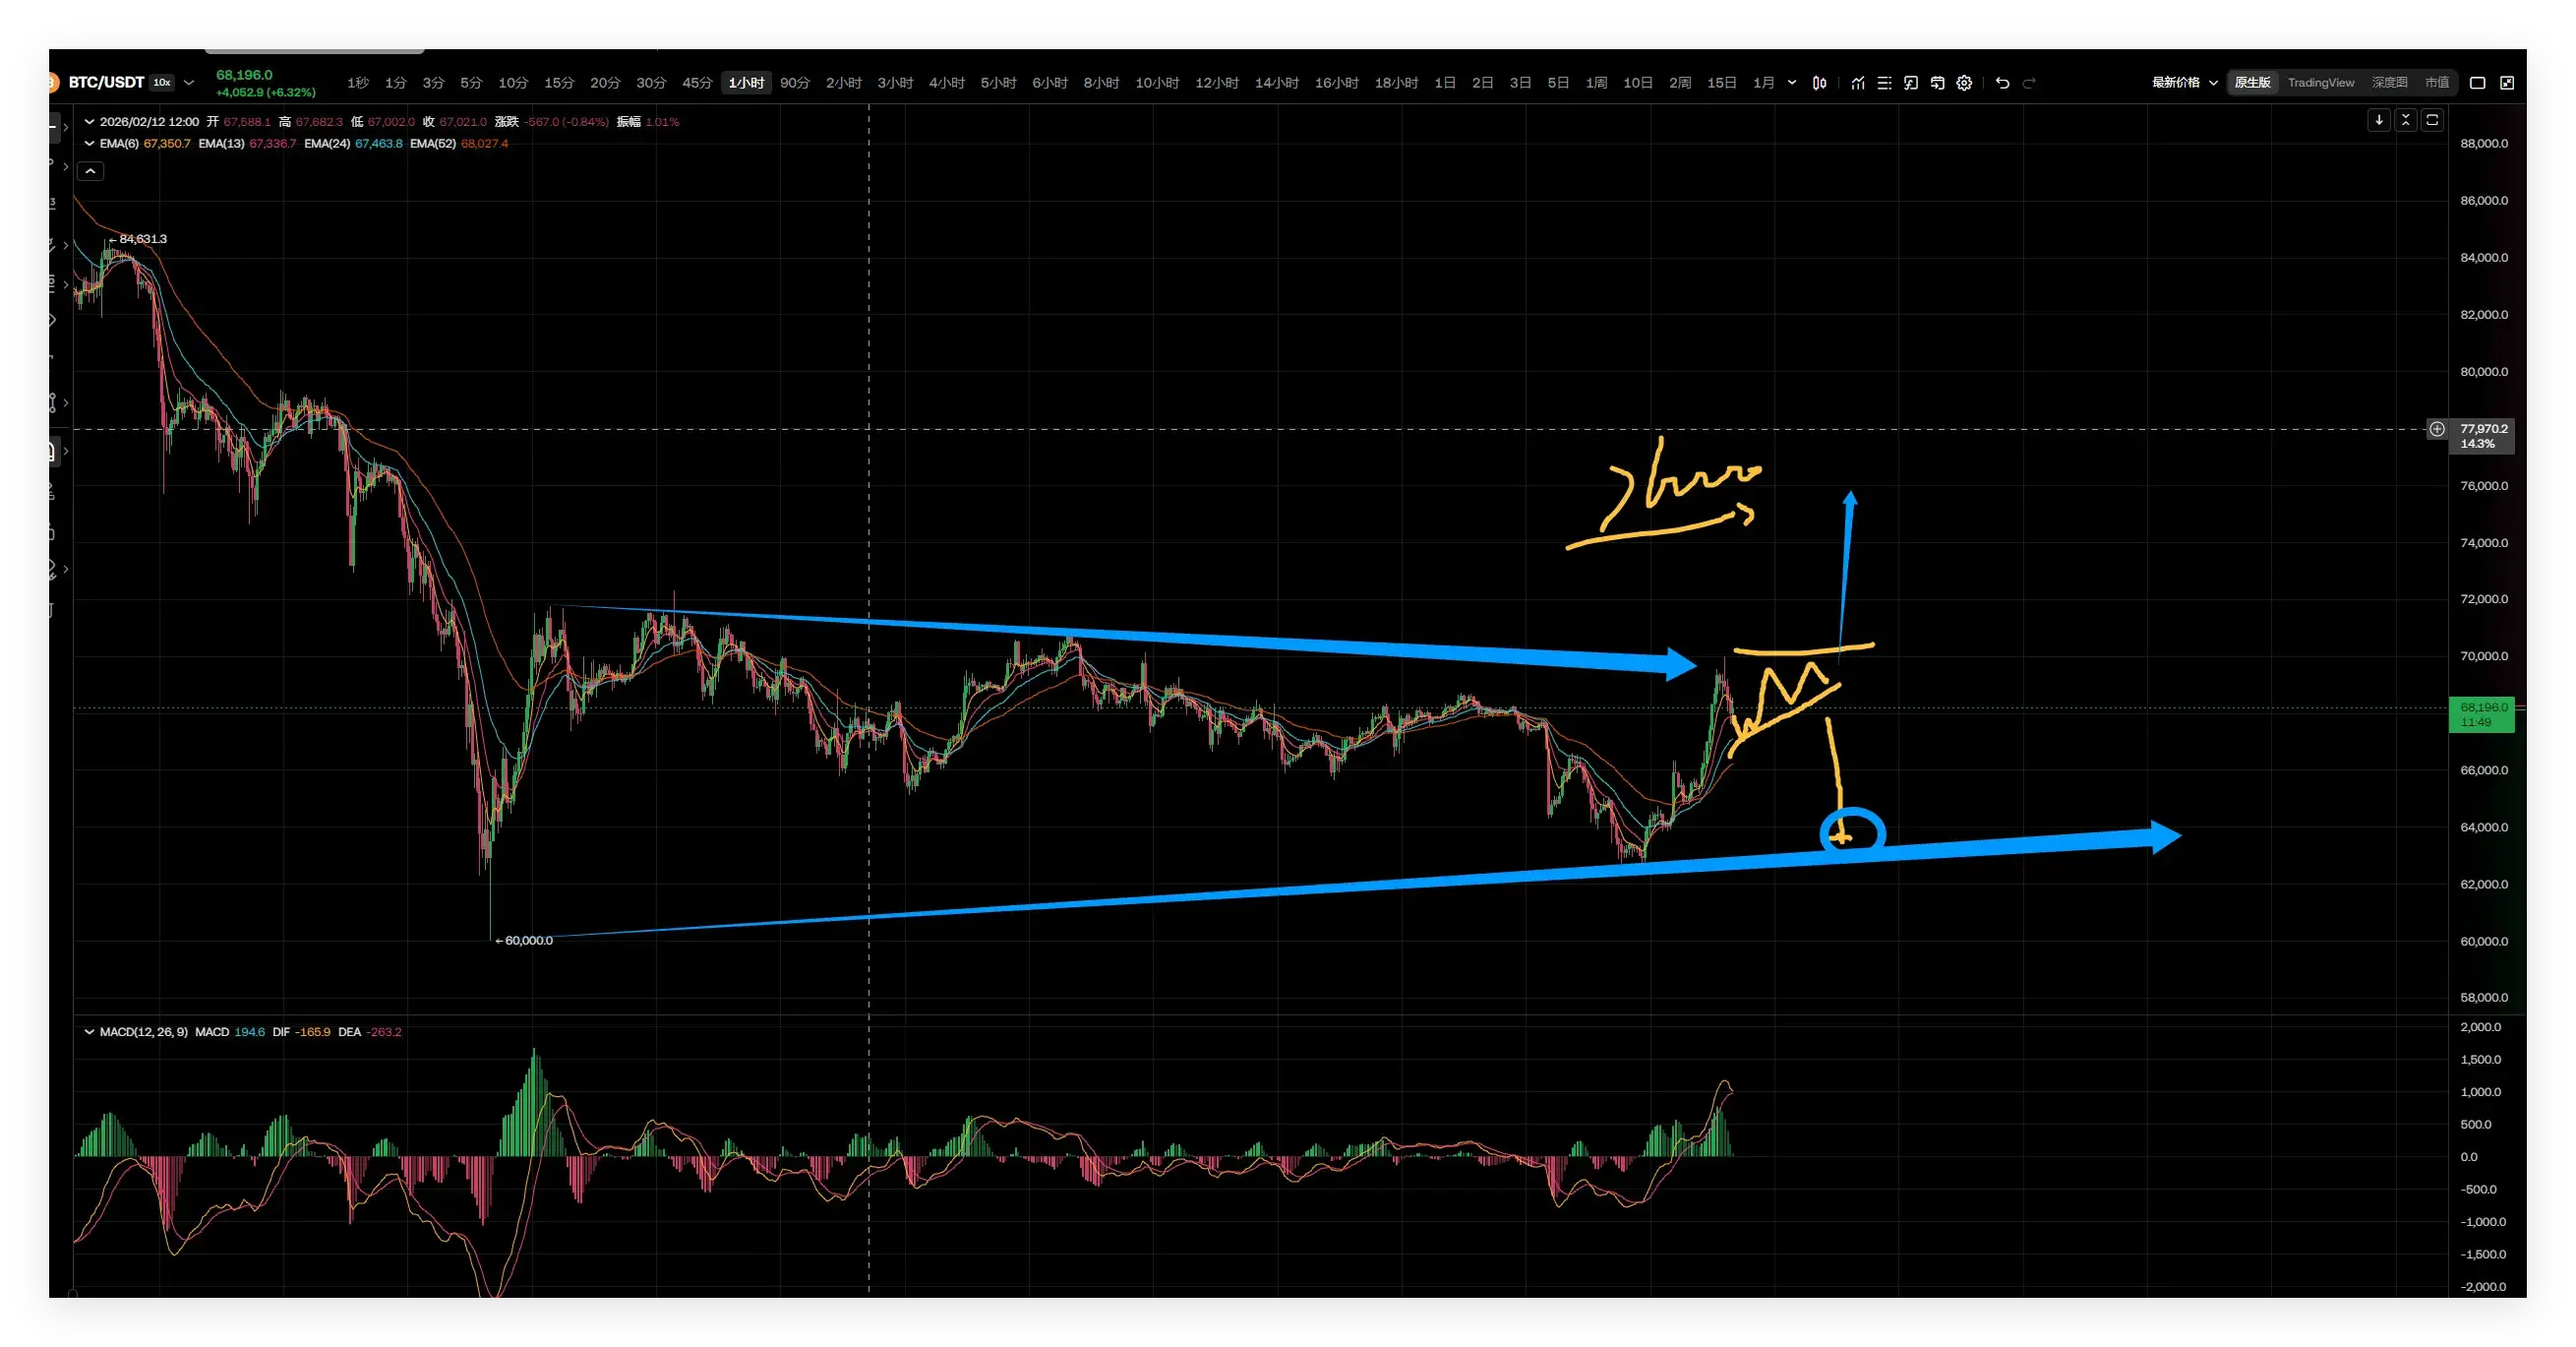
February 26 Bitcoin Market Analysis: Currently, the market is consolidating at a high level, and the bullish momentum within 2 hours has not yet completed. Now, wait for the correction and subsequent trend reversal. Be aware that once the market effectively breaks through 71,700, it will reach the 76,000 level. The larger timeframe remains bearish, and the smaller timeframe requires sustained strength for upward movement. Pay attention to the market after small-scale consolidation; you can watch for long positions in the 66,000 - 67,000 range. #比特币
BTC3,06%
- Reward
- 1
- Comment
- Repost
- Share
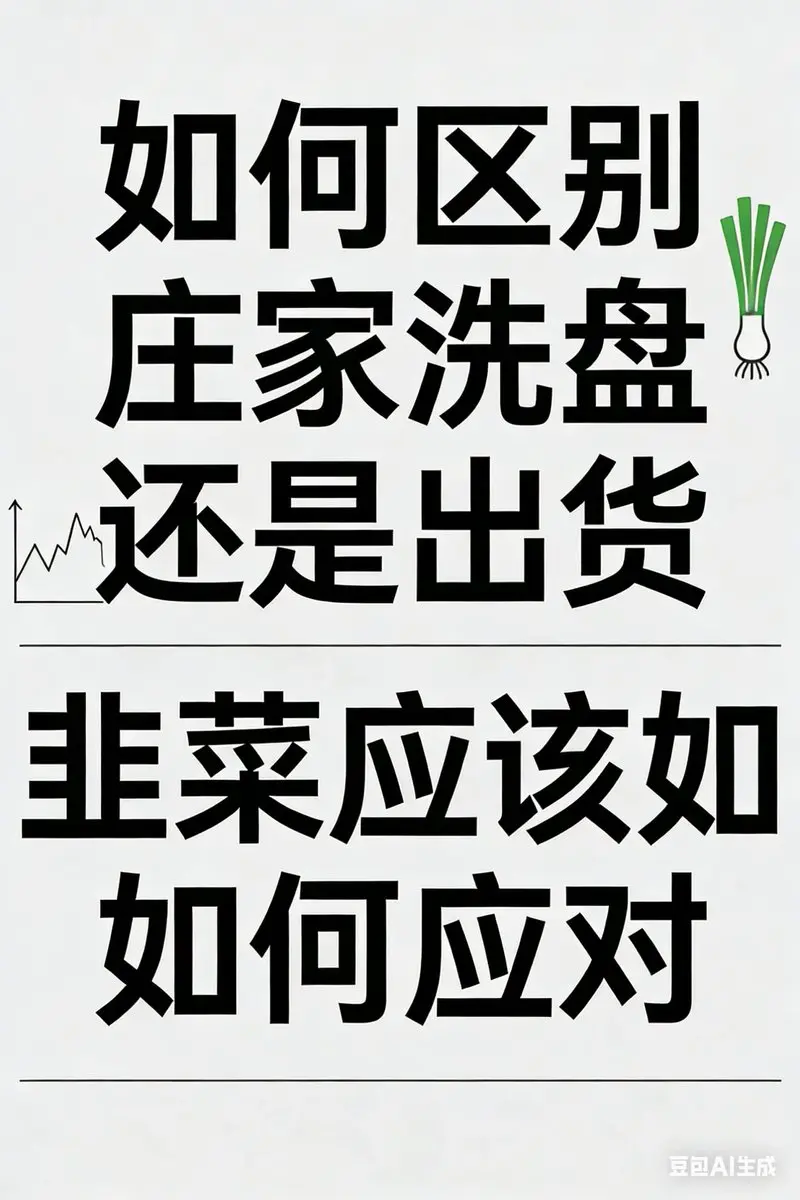
Prices go down and then go up—that's called a shakeout‼️
Prices fall again and then drop—that's called a dump‼️
In the financial markets, the most common question among retail investors is:
Is this a shakeout or is the big player selling off?
But the harsh reality is—
Many times, it’s the actions of retail investors themselves that determine the market trend.
1. What is a dump?
A dump essentially means the big player wants to sell their holdings to the market.
If given a choice, the big player will definitely prefer to sell at high levels.
Because the higher the position, the greater the profi
View OriginalPrices fall again and then drop—that's called a dump‼️
In the financial markets, the most common question among retail investors is:
Is this a shakeout or is the big player selling off?
But the harsh reality is—
Many times, it’s the actions of retail investors themselves that determine the market trend.
1. What is a dump?
A dump essentially means the big player wants to sell their holdings to the market.
If given a choice, the big player will definitely prefer to sell at high levels.
Because the higher the position, the greater the profi
- Reward
- 1
- Comment
- Repost
- Share

- Reward
- 2
- 1
- Repost
- Share
RenataMoreira:
I wanted to make money 💰I've experienced a bull and bear cycle in the crypto world. My biggest realization is: surviving the shuffle of bull and bear markets is more important than making quick money; earning within my understanding is more important than gambling on uncertain riches.
In this round of market shifts, most of my altcoins have gone to zero, and I’ve given up short-term trading strategies like chasing gains and cutting losses. I’ve only committed to one confident action:
Consistently investing in Gate Exchange’s platform token, GT.
Many people ask me, with countless options in the market, why choos
View OriginalIn this round of market shifts, most of my altcoins have gone to zero, and I’ve given up short-term trading strategies like chasing gains and cutting losses. I’ve only committed to one confident action:
Consistently investing in Gate Exchange’s platform token, GT.
Many people ask me, with countless options in the market, why choos


- Reward
- 2
- 1
- Repost
- Share
rtsky777 :
:
Good luck and prosperity 🧧
- Reward
- 2
- Comment
- Repost
- Share
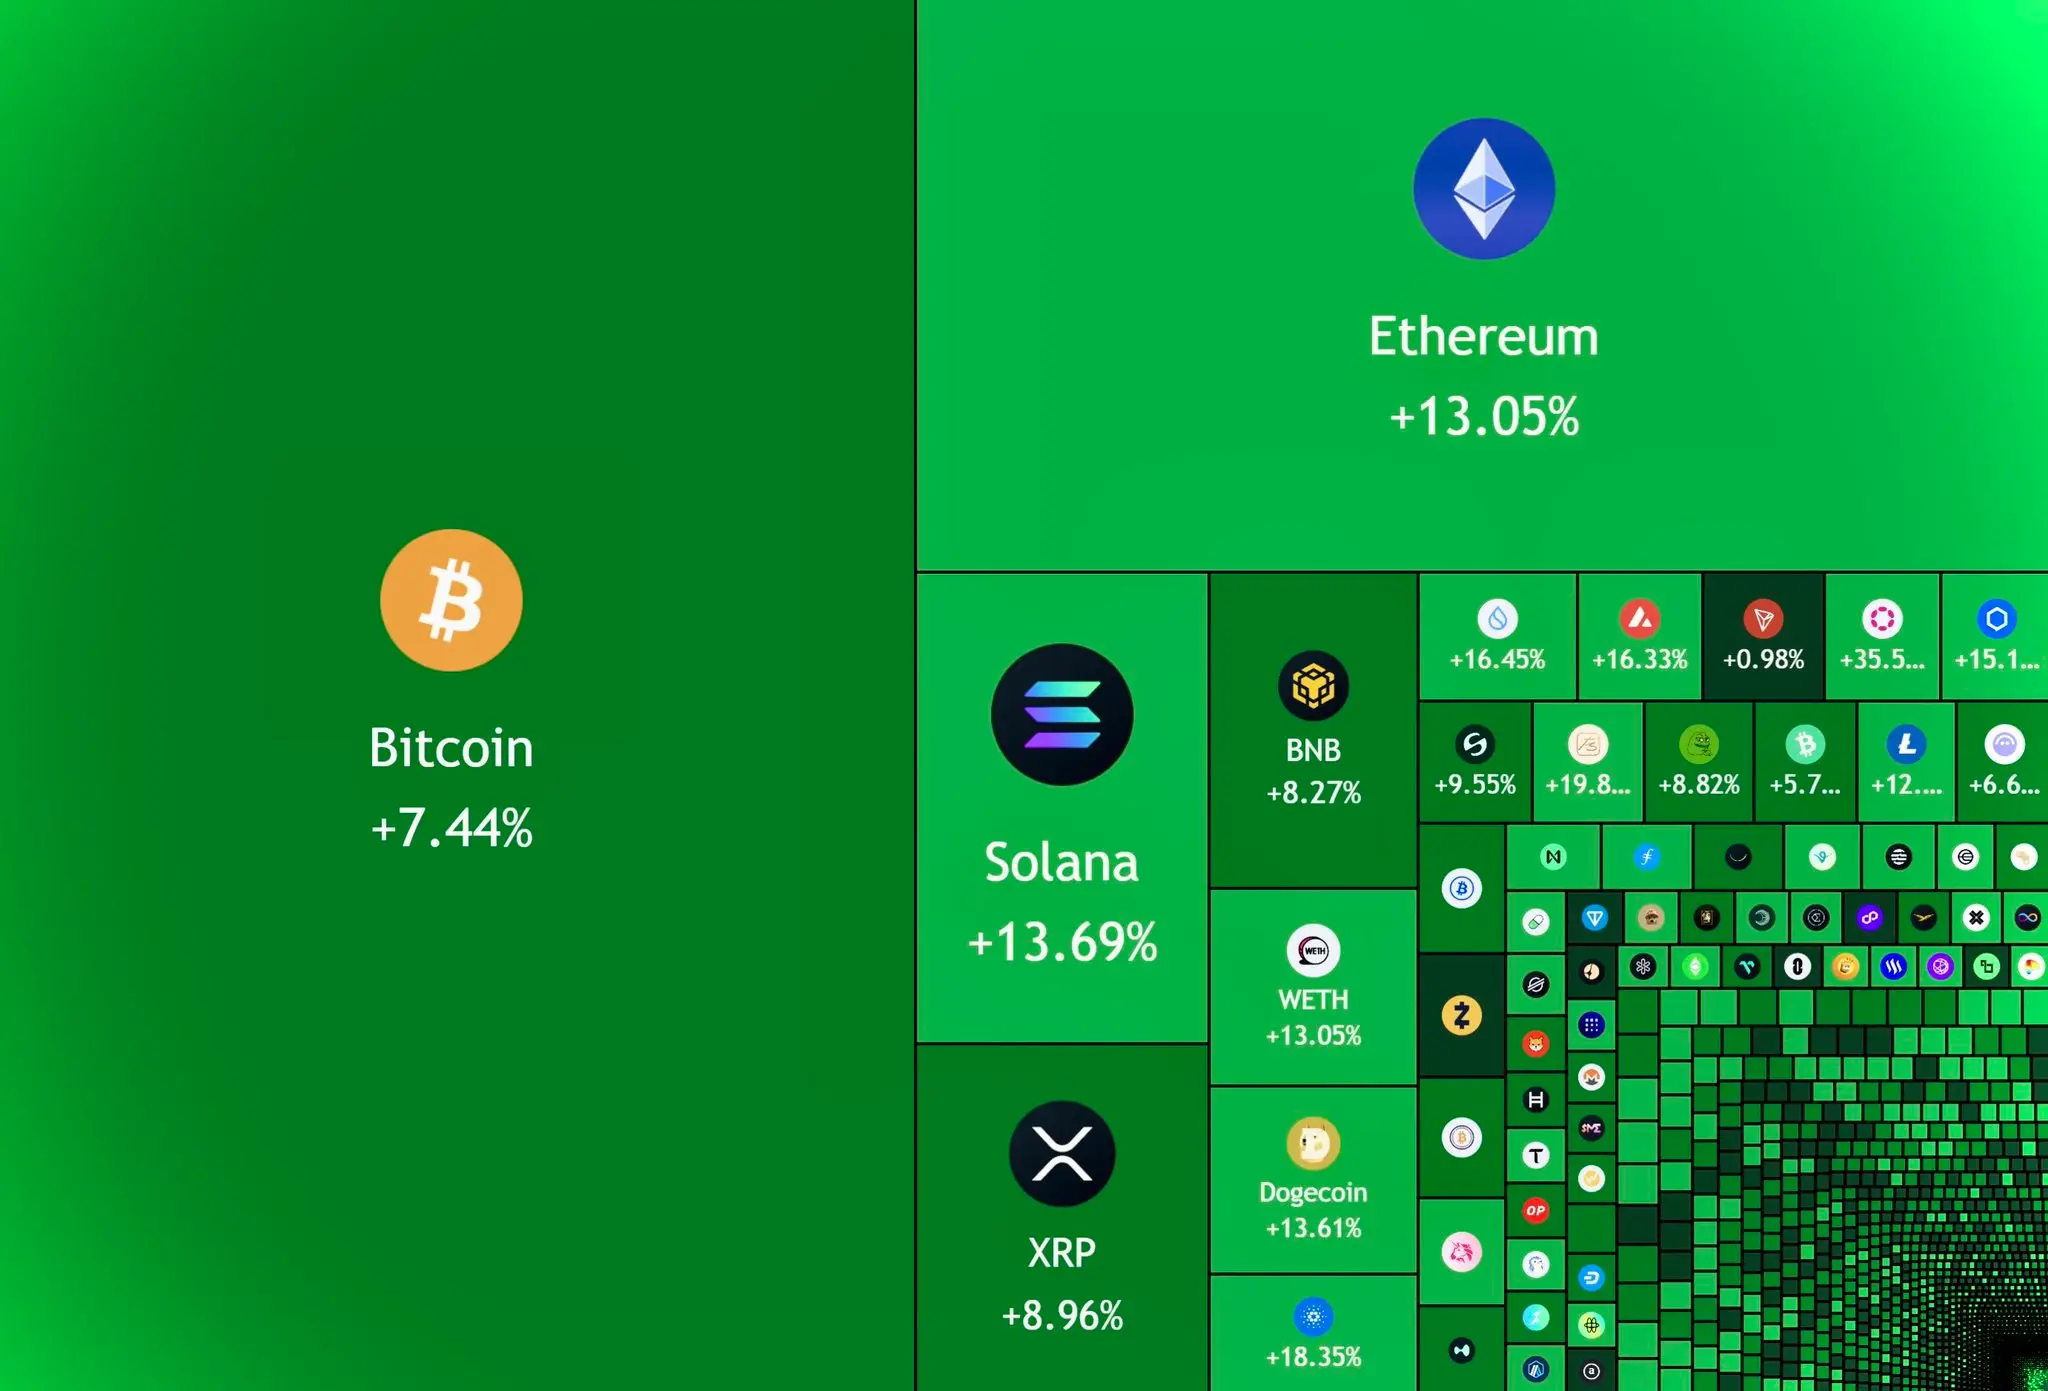
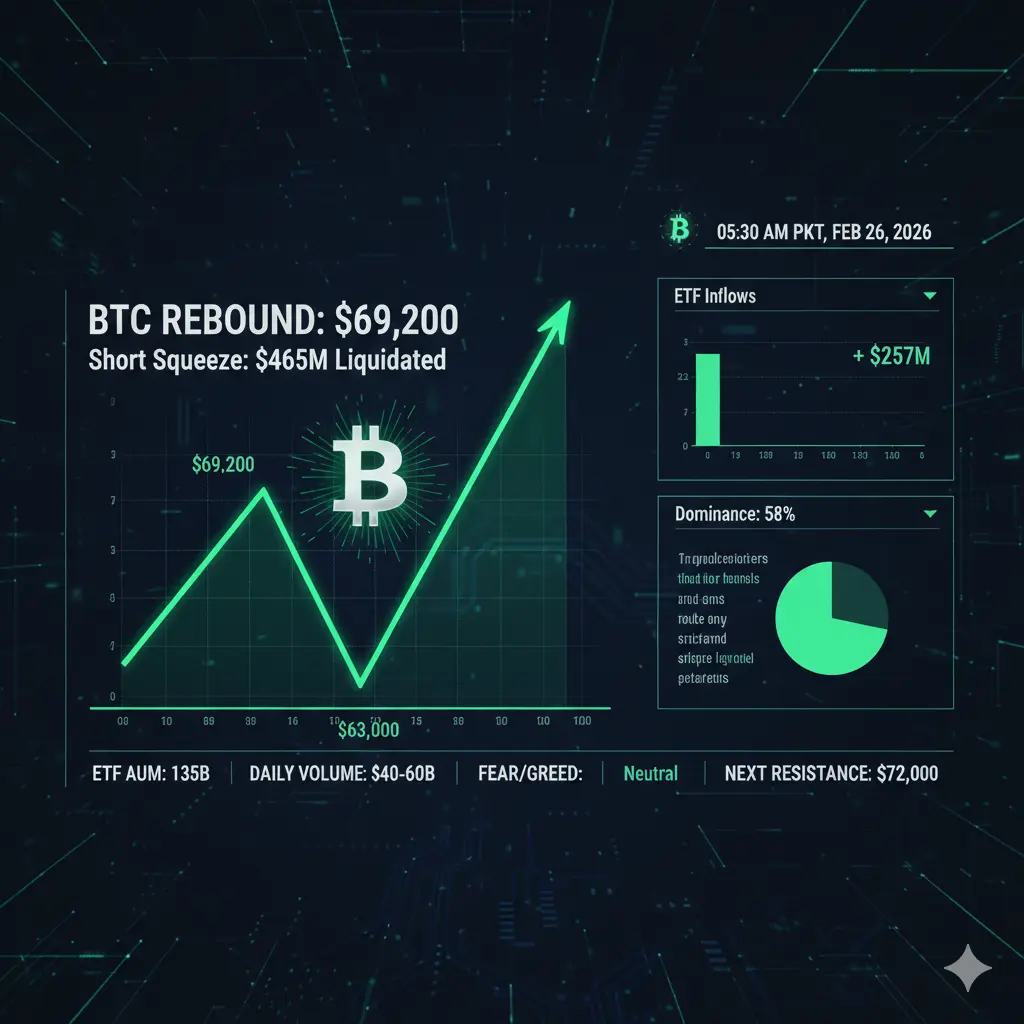
🔹 Bitcoin breaks through $68,000 strongly up over 6 percent in 24 hours is a new major upward wave beginning?
1.066
- Reward
- 1
- 1
- Repost
- Share
ANTOR:
2026 GOGOGO 👊#BitcoinBouncesBack
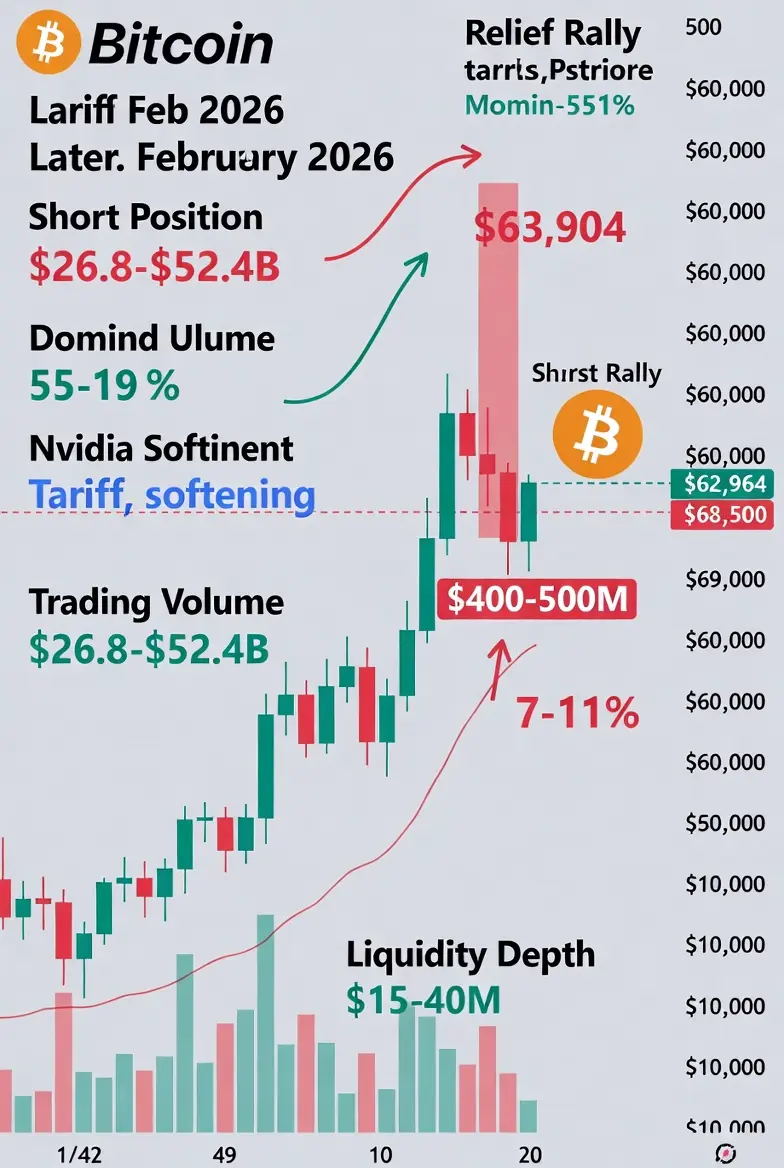
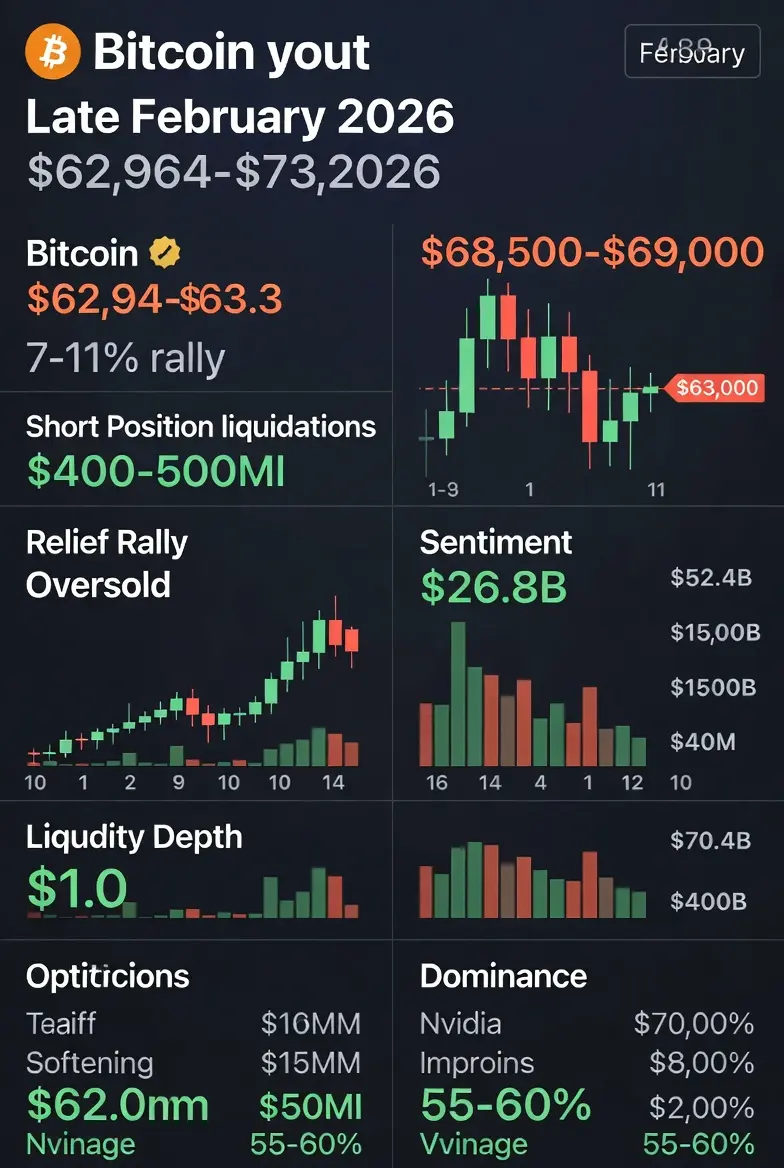
February, surging from intraday lows near $62,964–$63,000 to trade firmly above $68,500–$69,000 in just 24–48 hours. The move represents a 7–11%+ rally from trough levels, liquidating more than $400–500 million in short positions in a single session and forcing a cascade of covering across perpetual futures and spot markets. This classic relief rally has shifted sentiment from capitulation fears back toward cautious optimism, though the broader cycle correction remains intact with BTC still down ~45% from late-2025 peaks above $126,000.
The rebound is driven by a combinat
- Reward
- 4
- 8
- Repost
- Share
Discovery :
:
To The Moon 🌕View More
Cherish life; if God still lets you live, there is definitely a plan for you.
View Original


- Reward
- 2
- Comment
- Repost
- Share
Load More
Join 40M users in our growing community
⚡️ Join 40M users in the crypto craze discussion
💬 Engage with your favorite top creators
👍 See what interests you
Trending Topics
View More87.79K Popularity
176.74K Popularity
42.03K Popularity
9.69K Popularity
433.72K Popularity
Hot Gate Fun
View More- MC:$2.5KHolders:20.10%
- MC:$2.5KHolders:20.09%
- MC:$2.46KHolders:10.00%
- MC:$0.1Holders:10.00%
- MC:$2.5KHolders:20.22%
News
View MoreMetaMask now supports creating contracts using any token
4 m
Caixin: Rumors that Chinese regulatory authorities are examining Jane Street's trading behavior in China's ETF market
6 m
U.S. XRP spot ETF's total net inflow on a single day is $3,091,000.
7 m
Data: Hyperliquid platform whales currently hold positions worth $3.11 billion, with a long-short position ratio of 0.99
8 m
Market Report: Top 5 Cryptocurrency Gainers on February 26, 2026, with Polkadot leading the gains
9 m
Pin