Trade
Trading Type
Spot
Trade crypto freely
Alpha
Points
Get promising tokens in streamlined on-chain trading
Pre-Market
Trade new tokens before they are officially listed
Margin
Magnify your profit with leverage
Convert & Block Trading
0 Fees
Trade any size with no fees and no slippage
Leveraged Tokens
Get exposure to leveraged positions simply
Futures
Futures
Hundreds of contracts settled in USDT or BTC
Options
HOT
Trade European-style vanilla options
Unified Account
Maximize your capital efficiency
Demo Trading
Futures Kickoff
Get prepared for your futures trading
Futures Events
Participate in events to win generous rewards
Demo Trading
Use virtual funds to experience risk-free trading
Earn
Launch
CandyDrop
Collect candies to earn airdrops
Launchpool
Quick staking, earn potential new tokens
HODLer Airdrop
Hold GT and get massive airdrops for free
Launchpad
NEW
Be early to the next big token project
Alpha Points
NEW
Trade on-chain assets and enjoy airdrop rewards!
Futures Points
NEW
Earn futures points and claim airdrop rewards
Investment
Simple Earn
Earn interests with idle tokens
Auto-Invest
Auto-invest on a regular basis
Dual Investment
Buy low and sell high to take profits from price fluctuations
Soft Staking
Earn rewards with flexible staking
Crypto Loan
0 Fees
Pledge one crypto to borrow another
Lending Center
One-stop lending hub
VIP Wealth Hub
Customized wealth management empowers your assets growth
Private Wealth Management
Customized asset management to grow your digital assets
Quant Fund
Top asset management team helps you profit without hassle
Staking
Stake cryptos to earn in PoS products
BTC Staking
HOT
Stake BTC and earn 10% APR
GUSD Minting
Use USDT/USDC to mint GUSD for treasury-level yields
More
VastStarDiary
No content yet
VastStarDiary
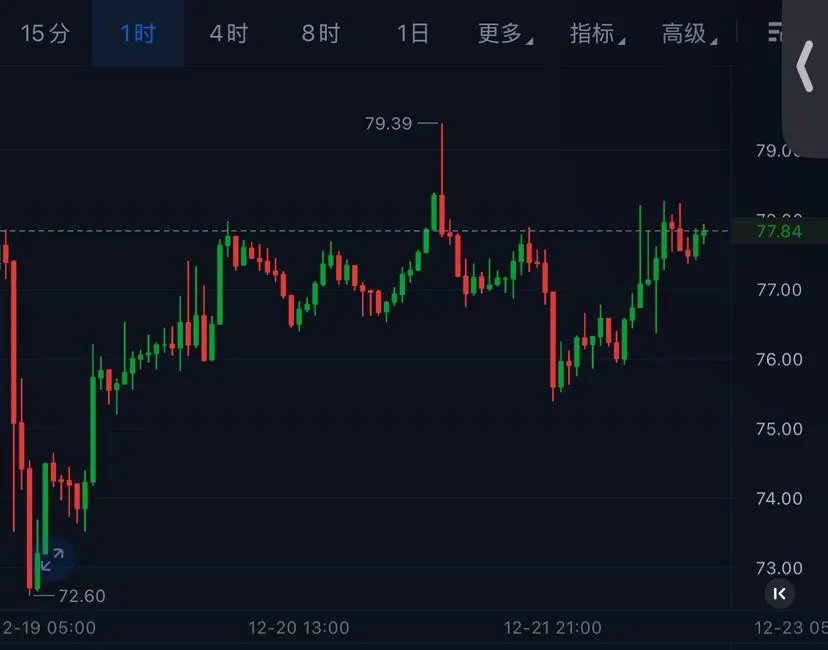
In the 1-hour chart of LTC, an upward trend is forming. Although there is short-term pressure at 78, the price is attempting to break through. In terms of technical indicators, the MACD green bars are continuously showing higher trade volumes, and the KDJ indicator is performing strongly, indicating that a breakout is imminent.
Personal advice, for reference only (strictly set defense)
Near 77.5-76.5, target around 79-80.
Personal advice, for reference only (strictly set defense)
Near 77.5-76.5, target around 79-80.
LTC0.6%
- Reward
- like
- Comment
- Repost
- Share
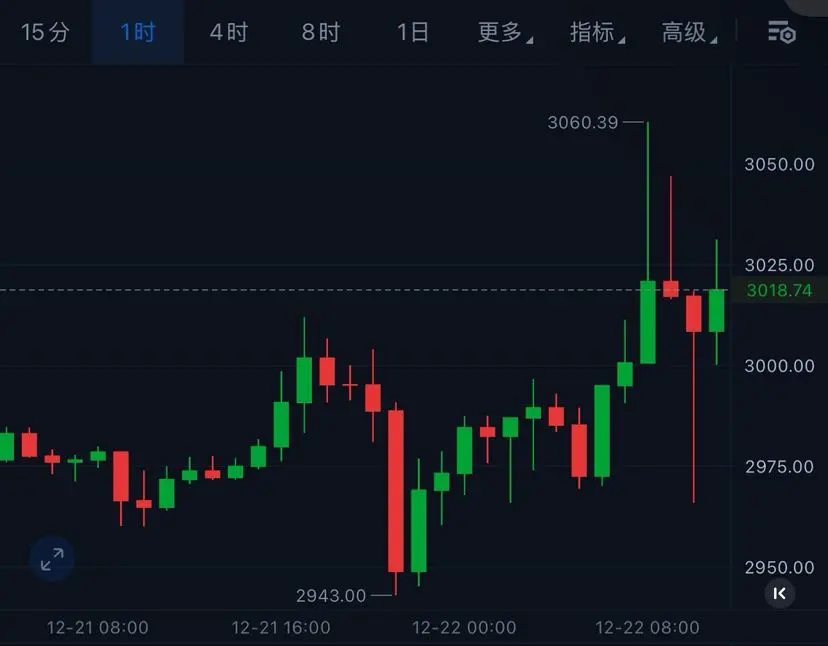
12.22 Monday midday ETH Silk Road
Looking at the 1-hour chart, after nearly two days of consolidation, the confrontation began intensively from midday, and the current price has broken through the resistance level of 3000. On the technical indicators, the MACD green bars continue to expand, and the KDJ indicator has an upward trend around 50, so it is possible to buy at a low level.
Personal suggestion, for reference only (strictly set defense)
ETH can be traded around 2950-3000, with a target of 3100-3150.
View OriginalLooking at the 1-hour chart, after nearly two days of consolidation, the confrontation began intensively from midday, and the current price has broken through the resistance level of 3000. On the technical indicators, the MACD green bars continue to expand, and the KDJ indicator has an upward trend around 50, so it is possible to buy at a low level.
Personal suggestion, for reference only (strictly set defense)
ETH can be traded around 2950-3000, with a target of 3100-3150.
- Reward
- like
- Comment
- Repost
- Share
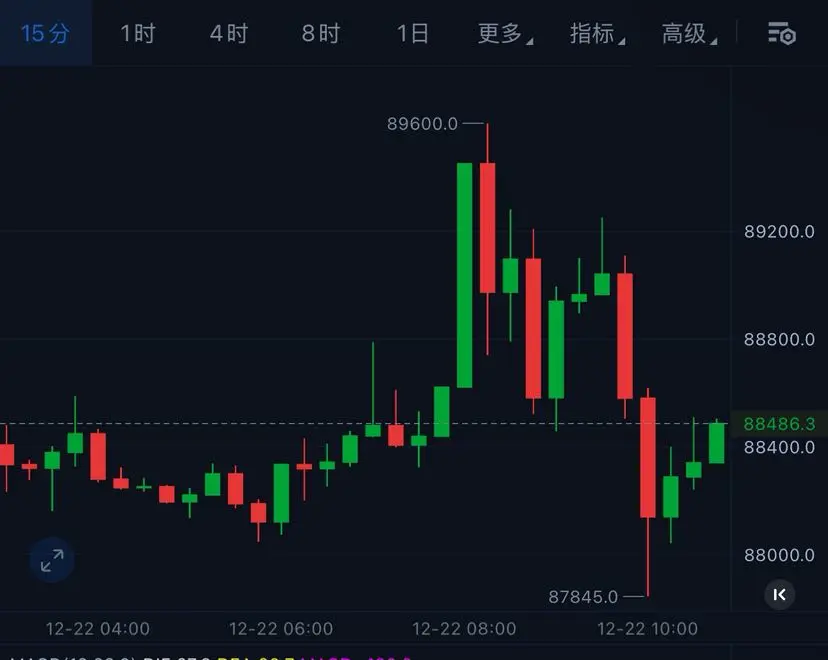
12.22 Monday midday BTC Silk Road
BTC surged to the 89600 line but did not experience significant retracement; instead, it maintained a strong upward oscillating pattern within the range. The daily level has recorded three consecutive bullish days, steadily increasing, with bullish volume being released consistently, indicating a clear upward trend. Although the bullish momentum on the four-hour chart has somewhat weakened, it still recorded a bullish candle. The KDJ indicator is gradually completing a golden cross and diverging upward, highlighting short-term rebound signals. The hourly chart
BTC surged to the 89600 line but did not experience significant retracement; instead, it maintained a strong upward oscillating pattern within the range. The daily level has recorded three consecutive bullish days, steadily increasing, with bullish volume being released consistently, indicating a clear upward trend. Although the bullish momentum on the four-hour chart has somewhat weakened, it still recorded a bullish candle. The KDJ indicator is gradually completing a golden cross and diverging upward, highlighting short-term rebound signals. The hourly chart
BTC1.55%
- Reward
- like
- Comment
- Repost
- Share
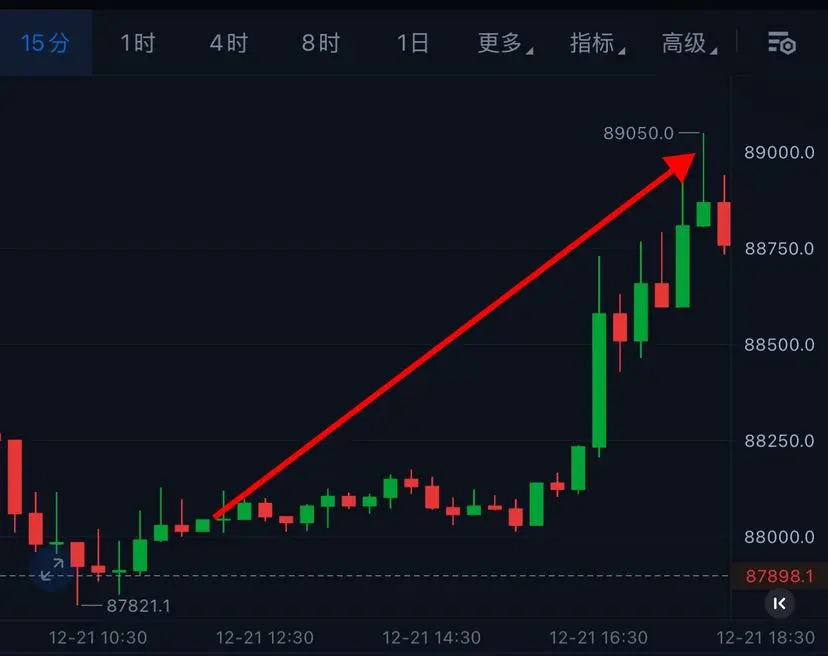
In the afternoon, the pancake silk road provided, although it hasn't retraced, it accurately reached the first target, easily securing 1k points!
BTC1.55%

- Reward
- like
- Comment
- Repost
- Share
12.21 Sunday midday ETH Silk Road
From the 1-hour chart, although the price comparison is in a consolidation phase, the MACD red bars are shrinking, a golden cross is about to form, and the KDJ indicator is favorable, currently in an upward trend, with momentum about to kick in.
Personal advice, for reference only (strictly set defense)
ETH can hover around 2950-2900, target 3100-3150
View OriginalFrom the 1-hour chart, although the price comparison is in a consolidation phase, the MACD red bars are shrinking, a golden cross is about to form, and the KDJ indicator is favorable, currently in an upward trend, with momentum about to kick in.
Personal advice, for reference only (strictly set defense)
ETH can hover around 2950-2900, target 3100-3150

- Reward
- like
- Comment
- Repost
- Share
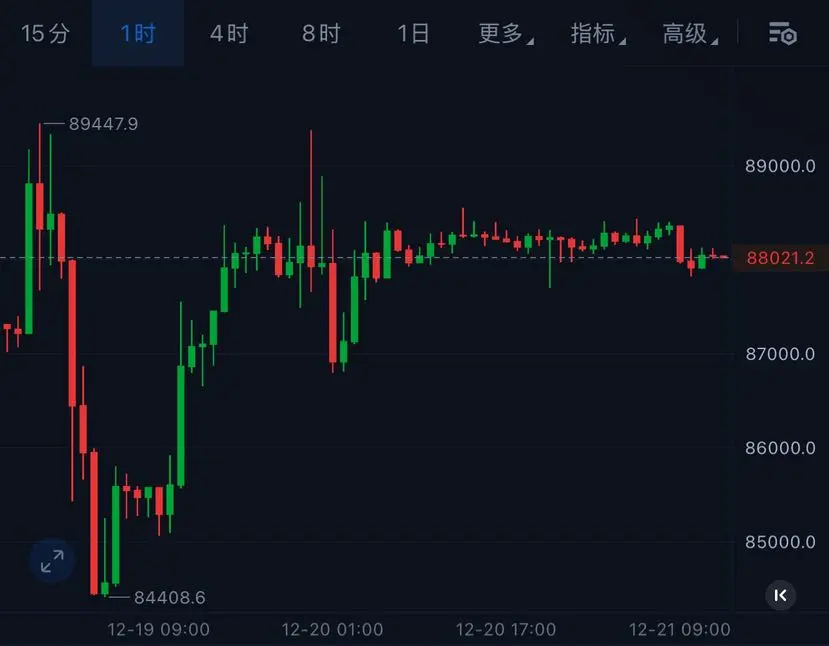
12.21 Sunday midday BTC Silk Road
Looking at the 1-hour chart, the weekend market is not very active, remaining in a sideways phase. For friends who want to trade at this position, I personally suggest focusing on low entries and setting proper stop losses.
Personal suggestion, for reference only (strictly set defense)
BTC can fluctuate around 87000-86000, with a target of 89000-90000.
BTC1.55%
- Reward
- like
- Comment
- Repost
- Share
SOL has been on a downward trend from 129 to 116 on the hourly chart, after which it quickly bounced back. Now, after a day of sideways consolidation, there is a slight dip, but this is precisely the opportunity to get on board. In terms of technical indicators, the KDJ indicator has exited the oversold zone and is showing a trend of turning upwards, so it is advisable to enter at a low.
Personal suggestion, for reference only (strictly set defense)
You can go long on SOL around 124-126, with a target of 130-135.
Personal suggestion, for reference only (strictly set defense)
You can go long on SOL around 124-126, with a target of 130-135.
SOL0.92%

- Reward
- 5
- 5
- 1
- Share
GateUser-30727b29:
🔥View More
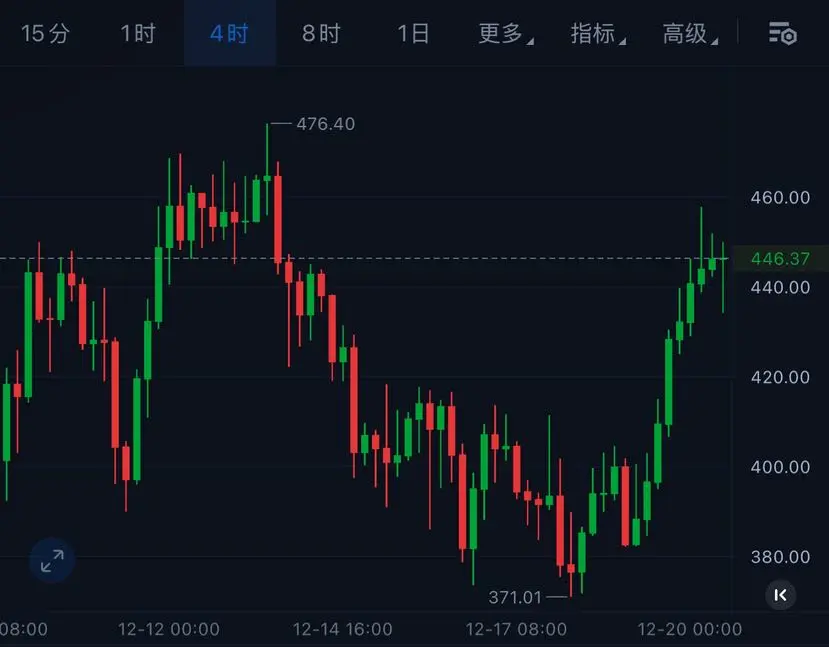
ZEC from the 4-hour chart shows an upward move from 371 to 446, but the rally is clearly losing momentum. A doji star has appeared at the top, and the KDJ indicator is in the overbought zone with a downward turning trend, indicating that a correction may be imminent.
Personal suggestion, for reference only (strictly set stop-loss)
Correction around 457-477, target near 400-370
Personal suggestion, for reference only (strictly set stop-loss)
Correction around 457-477, target near 400-370
ZEC3.3%
- Reward
- like
- Comment
- Repost
- Share
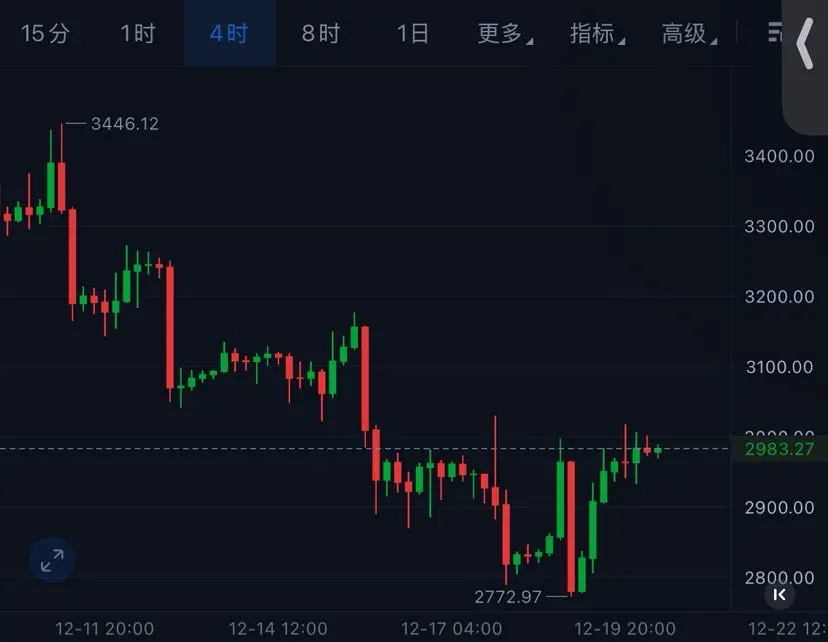
12.20 Saturday Noon Erbing Silk Road
From the 4-hour chart, after the price dipped to 2772, it quickly rebounded. Currently, the battle is intense. The Doko has regained lost ground. Technically, the MACD green bars continue to expand, and although the KDJ indicator is in the overbought zone, it remains strong.
Personal suggestion, for reference only (strictly set stop-loss)
Erbing can fluctuate around 2950-2900, with a target of 3100-3150
View OriginalFrom the 4-hour chart, after the price dipped to 2772, it quickly rebounded. Currently, the battle is intense. The Doko has regained lost ground. Technically, the MACD green bars continue to expand, and although the KDJ indicator is in the overbought zone, it remains strong.
Personal suggestion, for reference only (strictly set stop-loss)
Erbing can fluctuate around 2950-2900, with a target of 3100-3150
- Reward
- like
- Comment
- 1
- Share
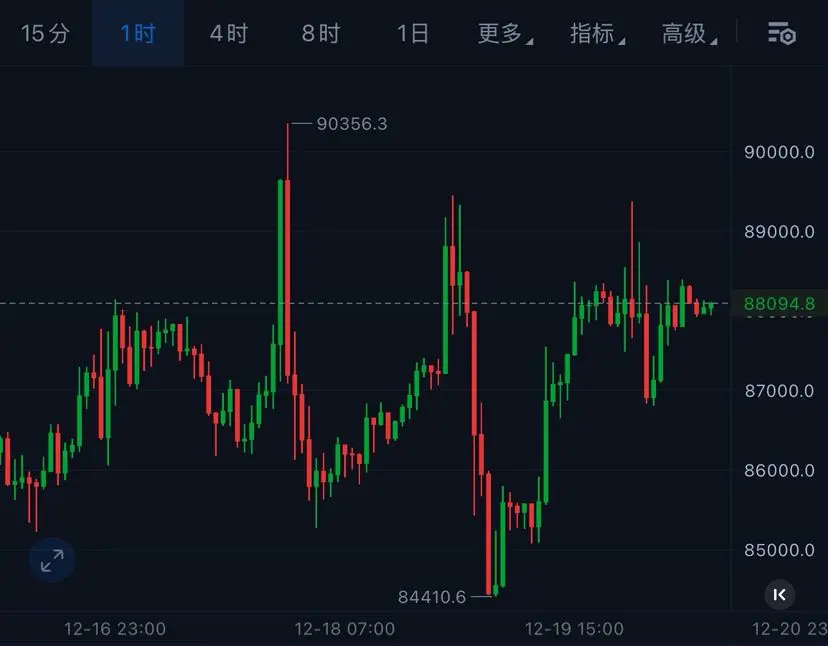
12.20 Saturday Noon Bitcoin Analysis
From the 1-hour chart, influenced by US news, the price has experienced significant fluctuations, showing a pattern of double kills in the market. It's unclear how many people have been caught off guard. Technically, the price has stabilized above the middle band of the Bollinger Bands, and the KDJ indicator continues its upward trend. Overall, the bulls still hold the advantage.
Personal suggestion, for reference only (strictly set stop-loss)
Bitcoin can fluctuate around 87,500-86,500, with targets of 89,000-90,000.
BTC1.55%
- Reward
- like
- Comment
- Repost
- Share
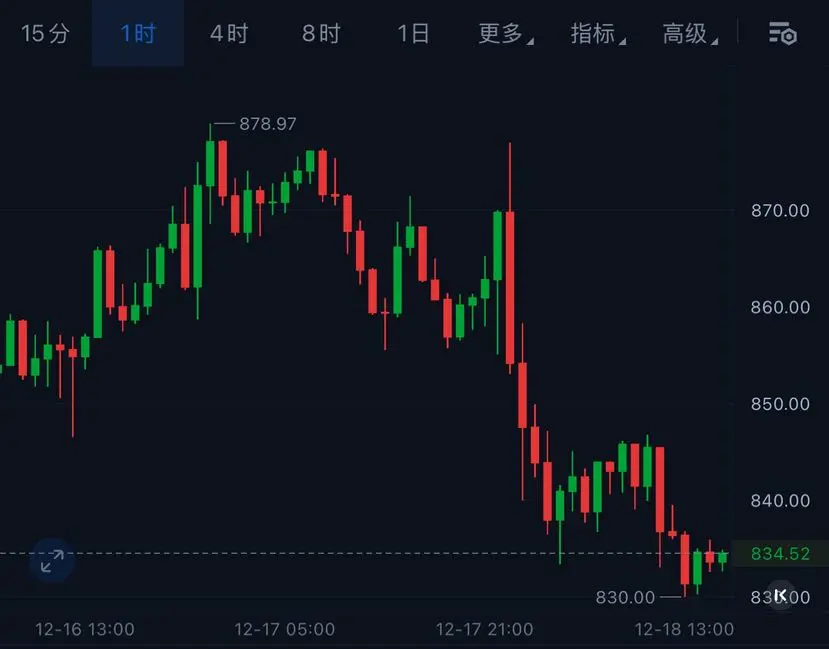
BNB 1-hour level, after the price dipped below 830, it has now clearly stabilized and stopped falling. On the technical indicators, the MACD shows a golden cross emerging, and the KDJ indicator is in the oversold zone. The overall pattern is a head-and-shoulders formation, with the head about to exert strength.
Personal suggestion, for reference only (strictly set stop-loss)
Head-and-shoulders around 830-820, target around 850-860
Personal suggestion, for reference only (strictly set stop-loss)
Head-and-shoulders around 830-820, target around 850-860
BNB1.11%
- Reward
- like
- Comment
- Repost
- Share
Thursday, 12.18, Midday, Erbing Silk Road
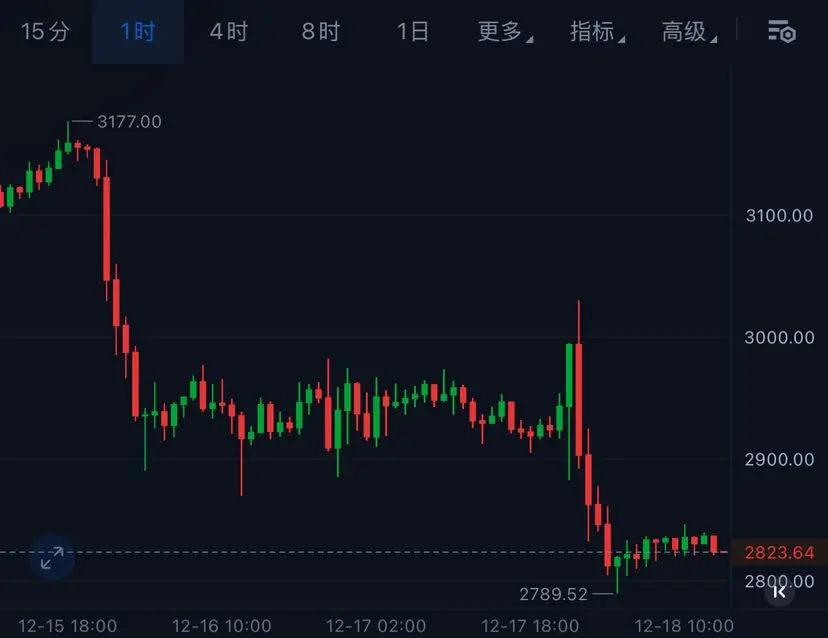
From the 1-hour chart, influenced by news, Erbing dipped to around 2790. The long-term correction is basically complete, and the MACD has already shown a golden cross, with momentum above the zero line. The setup for a potential upward move is in place.
Personal suggestion, for reference only (strictly set defensive stops):
Erbing can accumulate around 2800-2750, with targets of 2900-3000.
View OriginalFrom the 1-hour chart, influenced by news, Erbing dipped to around 2790. The long-term correction is basically complete, and the MACD has already shown a golden cross, with momentum above the zero line. The setup for a potential upward move is in place.
Personal suggestion, for reference only (strictly set defensive stops):
Erbing can accumulate around 2800-2750, with targets of 2900-3000.
- Reward
- like
- Comment
- Repost
- Share
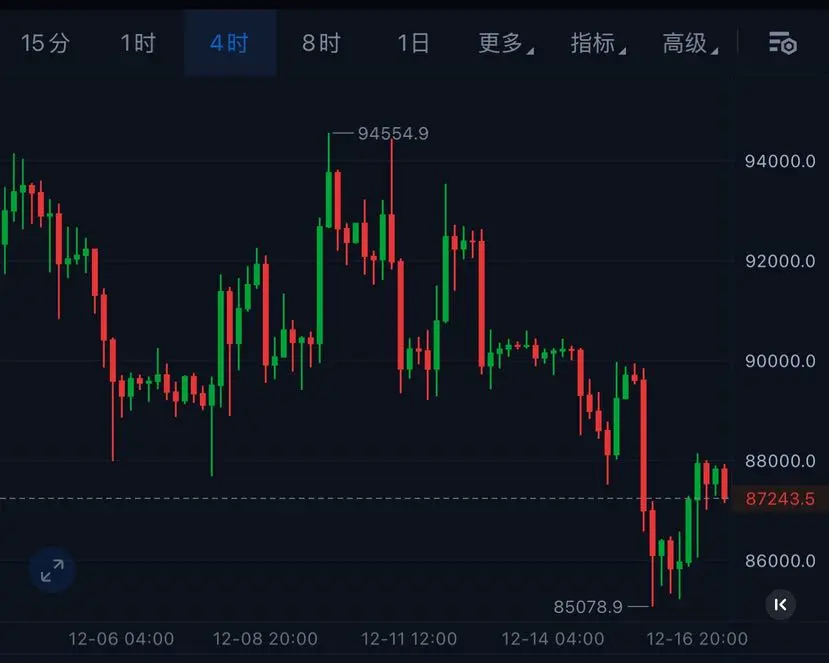
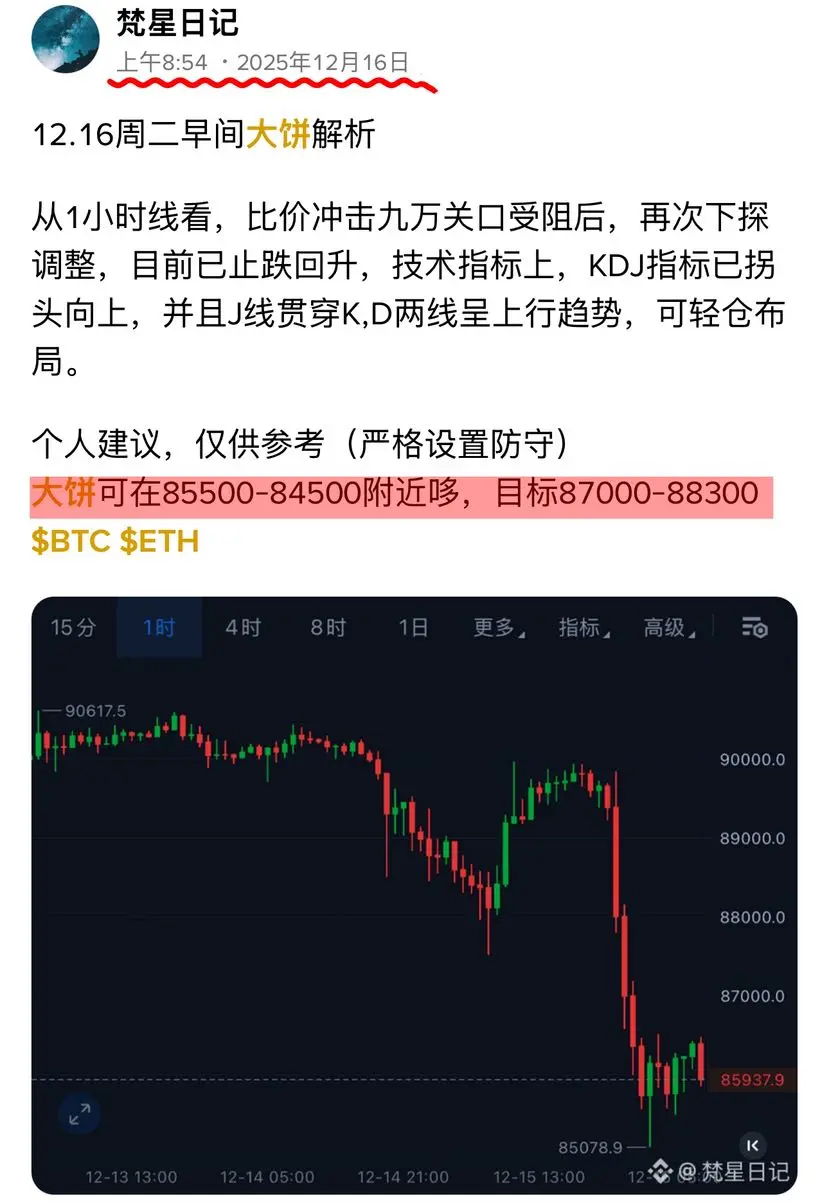
12.18 Thursday Morning Bitcoin Analysis
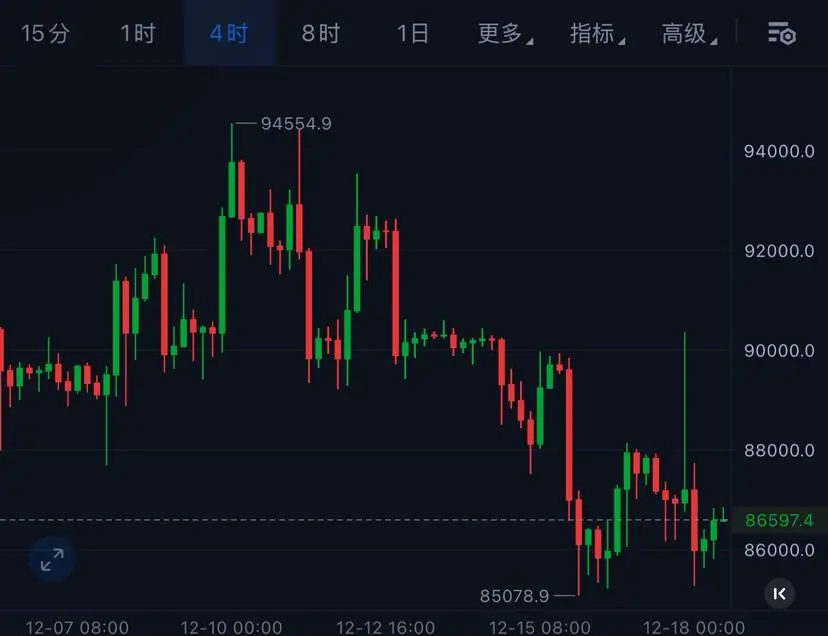
From the 4-hour chart, after the dovish speech by the Federal Reserve Chair post-election, the price surged to around 89,000 and then quickly retreated. After nearly a day of oscillation and consolidation, it has now stabilized. The overall strategy remains mainly bearish.
Personal suggestion, for reference only (strictly set stop-loss)
Bitcoin can fluctuate around 86,000-85,000, with targets of 87,000-88,000.
BTC1.55%
- Reward
- 1
- Comment
- Repost
- Share
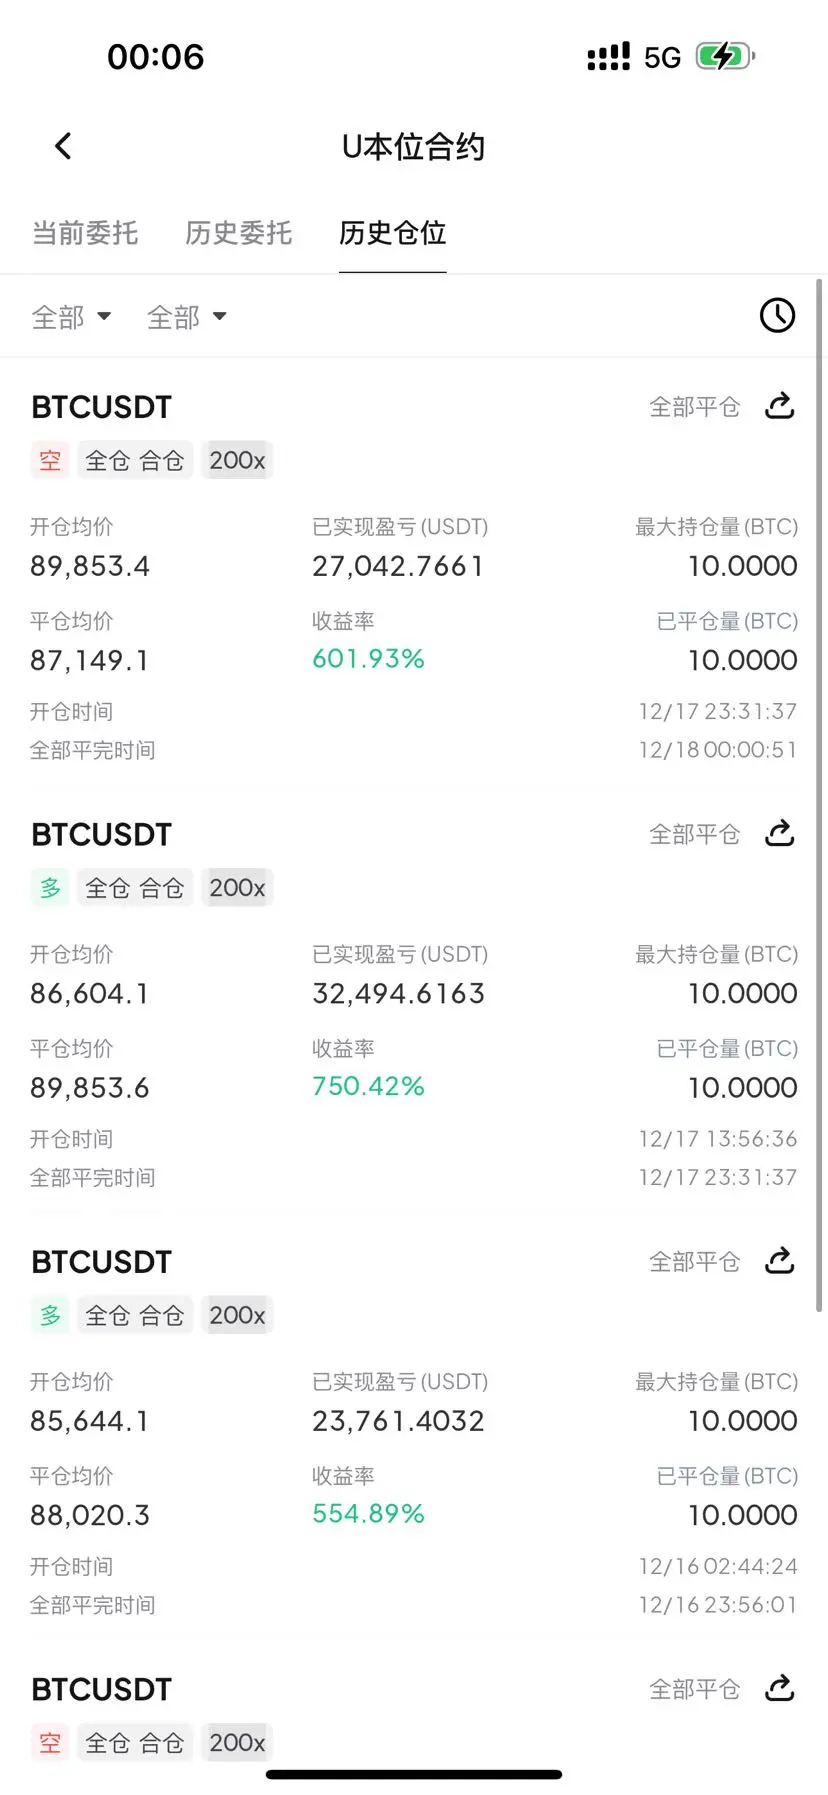
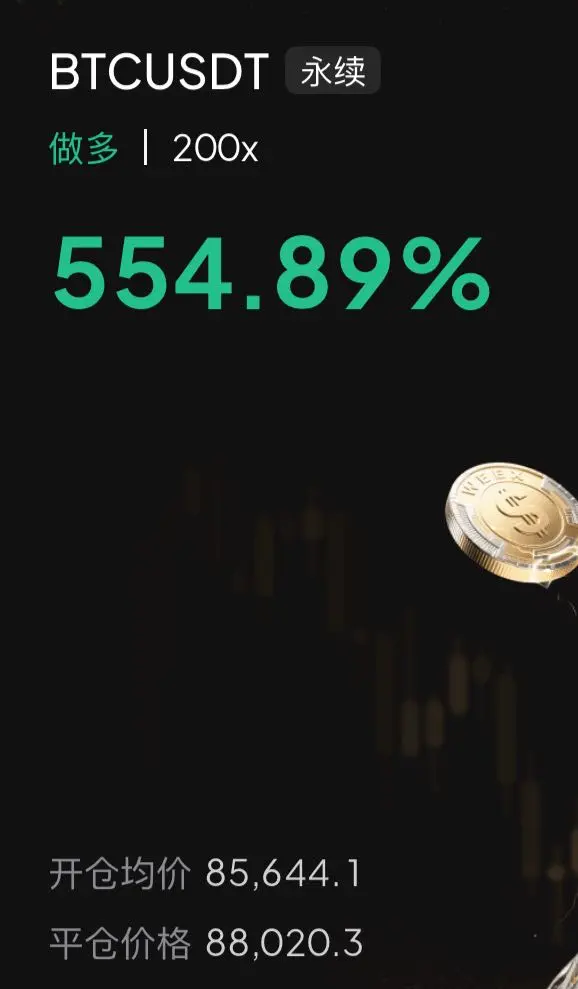
Bitcoin's strategy is perfectly validated, accurately reaching the target point, easily moving out of 4,000 points, then quickly pulling back. Under the scenario of dual kills by Duokong, the teacher handles it with ease, leading partners to over 60,000 oil!
BTC1.55%
- Reward
- like
- Comment
- Repost
- Share
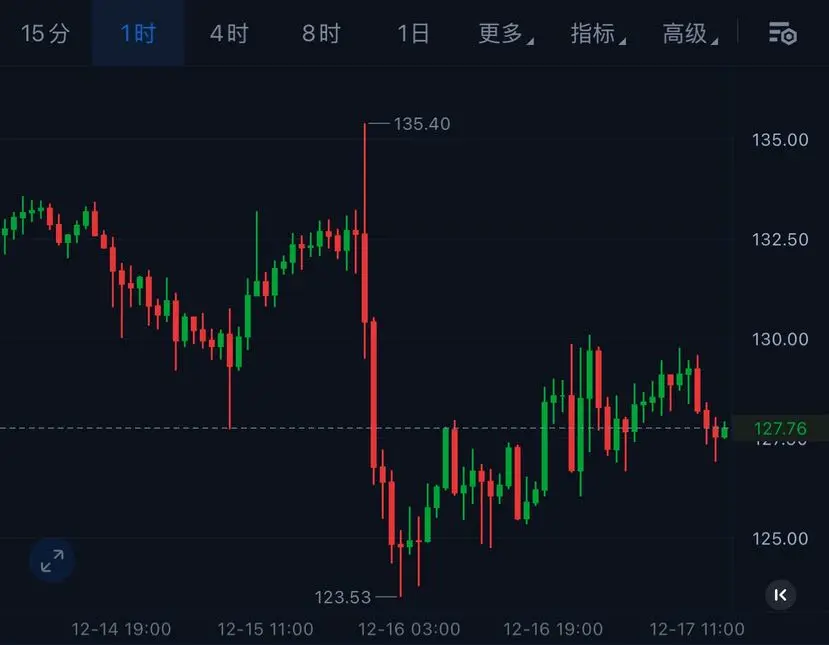
SOL is currently in a clear consolidation trend! The support level at 123 has been tested twice, so it has stabilized; but the resistance level at 135 has not been broken through, so in the short term, it is likely to fluctuate within this range.
Personal suggestion, for reference only (strictly set stop-loss)
SOL can be traded around 129-130, with a target of 126-123
Personal suggestion, for reference only (strictly set stop-loss)
SOL can be traded around 129-130, with a target of 126-123
SOL0.92%
- Reward
- like
- Comment
- Repost
- Share
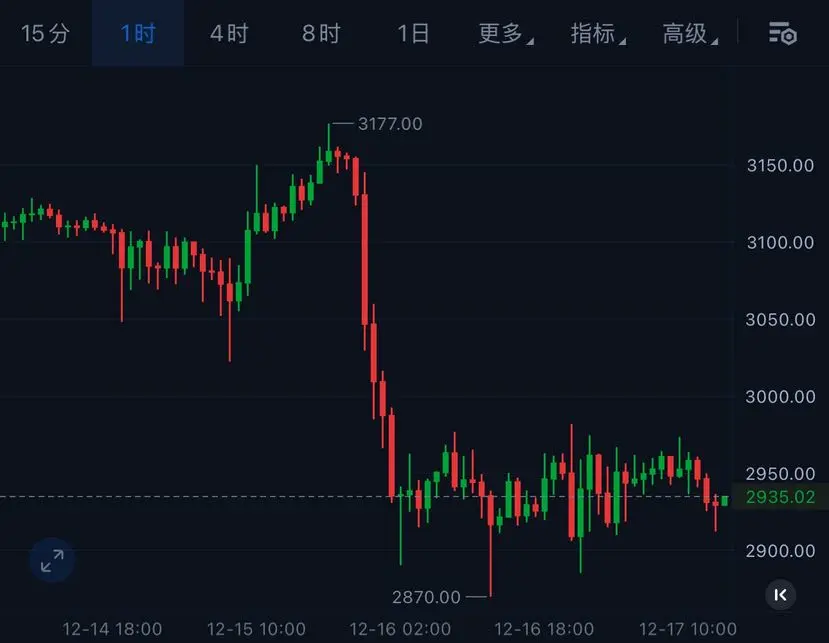
Wednesday, 12.17, Midday, ETH and BTC Market Overview
From the 1-hour chart, the price correction is basically complete, a bottom doji star has appeared, coupled with a MACD golden cross, and the KDJ indicator is in oversold territory and turning upward. Overall, the indicators show a slight upward trend, but the momentum appears weak.
Personal suggestion, for reference only (strictly set stop-loss)
ETH and BTC can fluctuate around 2900-2850, with targets of 3020-3150
View OriginalFrom the 1-hour chart, the price correction is basically complete, a bottom doji star has appeared, coupled with a MACD golden cross, and the KDJ indicator is in oversold territory and turning upward. Overall, the indicators show a slight upward trend, but the momentum appears weak.
Personal suggestion, for reference only (strictly set stop-loss)
ETH and BTC can fluctuate around 2900-2850, with targets of 3020-3150
- Reward
- like
- Comment
- Repost
- Share
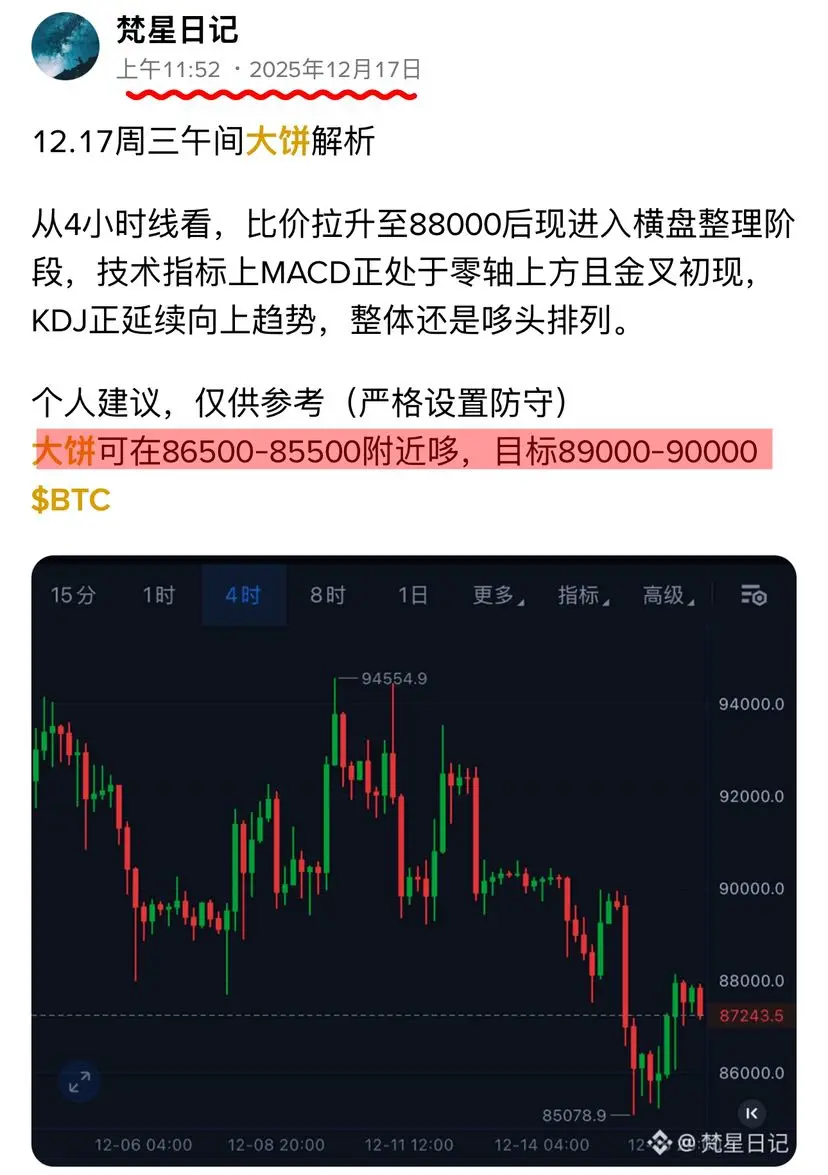
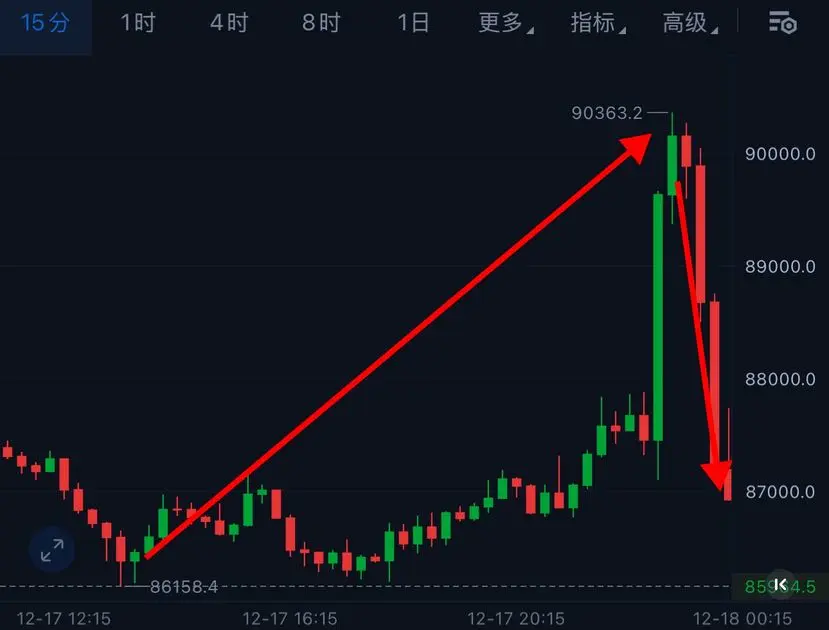
Wednesday, 12.17 Midday Bitcoin Analysis
From the 4-hour chart, after the price surged to 88,000, it is now entering a sideways consolidation phase. Technical indicators show that MACD is above the zero line with a golden cross beginning to form, and KDJ continues its upward trend. Overall, the chart still shows a bullish arrangement.
Personal suggestion, for reference only (strictly set stop-loss)
Bitcoin can fluctuate around 86,500-85,500, with targets of 89,000-90,000.
BTC1.55%
- Reward
- like
- Comment
- Repost
- Share
This is what professionalism looks like! The Bitcoin price accurately hits the target level, combining knowledge and action, and successfully secures 2,300 points!
BTC1.55%
- Reward
- like
- Comment
- Repost
- Share