


#CryptoMarketWatch
THE DIGITAL RENAISSANCE OF 2026 AND CRYPTO STRATEGY GUIDE
The first quarter of 2026 is being recorded as a historical turning point where the "experimentation" phase for the cryptocurrency market has ended, and the era of "structural maturity" has begun. We are no longer discussing mere speculation; we are looking at a massive financial ecosystem driven by institutional integration, regulatory clarity, and macroeconomic shifts. Specifically, the crypto-friendly stances of frontrunners for the Fed Chairmanship, such as Rick Rieder and Kevin Hassett, are keeping the "super cycle" expectations alive.
MARKET ANALYSIS AND GENERAL OUTLOOK
As of January 2026, the market has entered a consolidation phase following the aggressive rally at the end of 2025. Bitcoin’s journey from $40,000 to $95,000 has decoupled the market from the traditional "four-year cycle" theory, transitioning it into a more stable and long-term upward trend. Institutional ETF inflows have become a daily routine, while stablecoin volumes exceeding $47 trillion serve as the most concrete proof that blockchain networks have transformed into global payment infrastructures.
TOP 3 FAVORITE COINS: IN-DEPTH ANALYSIS
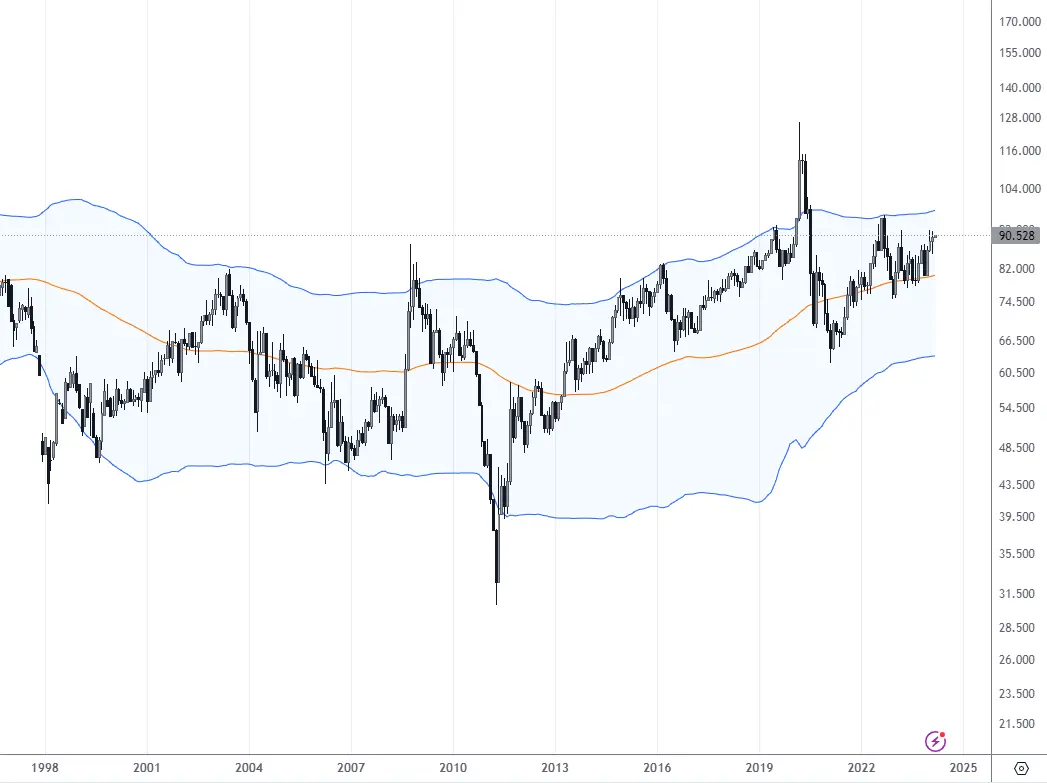
1. Bitcoin (BTC): The Strategic Reserve Asset
In 2026, Bitcoin is no longer just an investment vehicle; it has become a strategic reserve asset held on the balance sheets of nation-states and major corporations.
Recent Development: The new U.S. administration and potential Fed candidates (notably Rick Rieder, currently leading with a 59% probability) defining Bitcoin as a "modern safe haven" has significantly minimized sell-side pressure on BTC.
Analysis: BTC’s volatility has dropped below that of giant tech stocks like Nvidia. This allows conservative funds to allocate larger portions of their portfolios to Bitcoin.
Strategy: The "buy and hold" strategy for Bitcoin has evolved into a "buy the dip" tactic. Any dip below the $90,000 mark is viewed as a massive window of opportunity for institutional buyers.
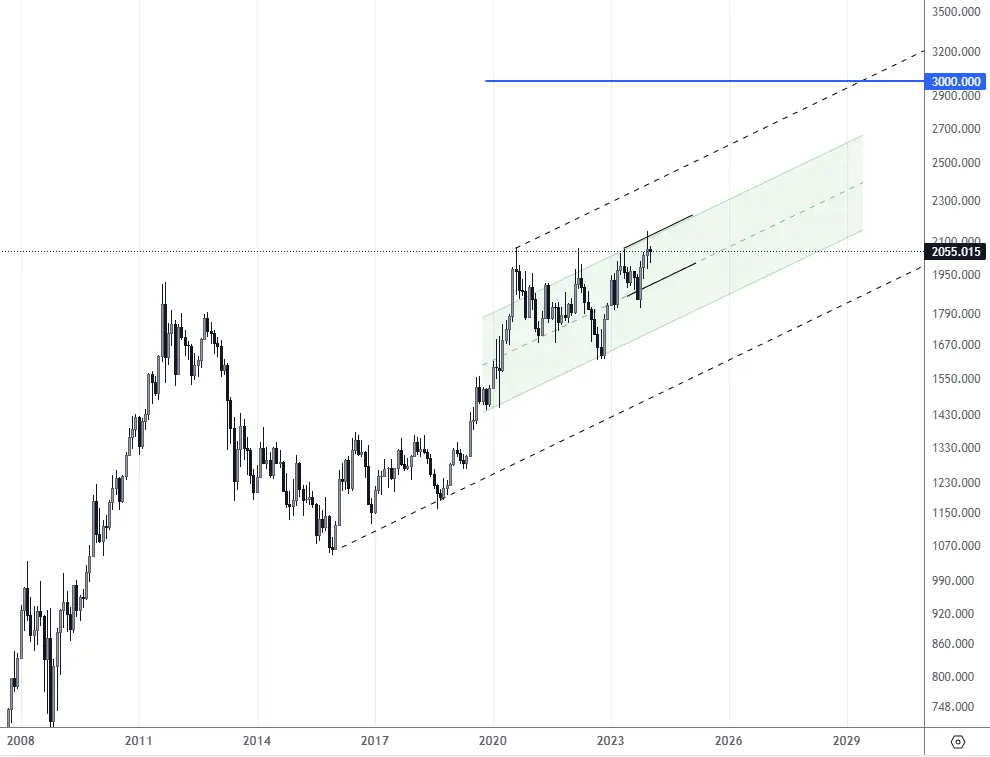
2. Ethereum (ETH): Leader of Institutional Tokenization
In 2026, Ethereum is realizing its "World Computer" vision through Real-World Assets (RWA).
Recent Development: The Ethereum BPO hard fork in January, which increased gas limits and lowered transaction costs, has pushed activity on Layer-2 networks to record levels.
Analysis: With giants like BlackRock moving treasury bills and equities onto the Ethereum network, ETH has become the "raw material" (the fuel) of the digital economy.
Strategy: For investors, Ethereum should be evaluated more as an "infrastructure stock" than a currency. Staking rewards and its deflationary nature (burned fees) make ETH unrivaled for long-term accumulation.
3. Solana (SOL): The Hub for Speed and Retail Adoption
Carrying its 2025 performance into 2026, Solana stands out particularly with its dominance in AI agents and prediction markets (like Polymarket).
Recent Development: Daily active wallet counts on the Solana network have begun to rival Ethereum’s, thanks to low-cost transactions. The preference for Solana among AI-based trading bots has pushed the network’s liquidity to massive scales.
Analysis: Solana remains the "entry gate" for retail investors. The speed of the network has turned it into more than just a cryptocurrency; it is now a high-frequency exchange infrastructure.
Strategy: The keyword for the SOL investor is "ecosystem." A basket strategy focusing on next-generation DeFi protocols and AI projects built on Solana offers higher return potential than simply holding SOL.
INVESTOR ANALYSIS AND FUTURE STRATEGIES
The investor profile of 2026 is vastly different from that of 2021 or 2024. We are now dealing with a conscious audience that follows macroeconomic developments (Fed rate decisions, election results, regulatory news) rather than just technical analysis.
Market Sentiment: While the Fear and Greed Index is in the "Greed" zone, a "cautious optimism" prevails instead of the "blind euphoria" of the past.
Core Strategy: Portfolio diversification is now vital. Protecting 50% of the basket with "blue chips" like BTC and ETH, while allocating the remaining 50% among high-performance Layer-1s like Solana, RWA projects, and AI-focused tokens, is the most balanced path forward.
2026 is the year crypto moved from the "fringes of finance" to the very center. With the change in Fed leadership and the reopening of liquidity taps, new peaks led by these three favorite coins seem inevitable.
Bana bu yazıya uygun benzersiz muhteşem bir görsel şölen oluştur, teknolojik bir resim
THE DIGITAL RENAISSANCE OF 2026 AND CRYPTO STRATEGY GUIDE
The first quarter of 2026 is being recorded as a historical turning point where the "experimentation" phase for the cryptocurrency market has ended, and the era of "structural maturity" has begun. We are no longer discussing mere speculation; we are looking at a massive financial ecosystem driven by institutional integration, regulatory clarity, and macroeconomic shifts. Specifically, the crypto-friendly stances of frontrunners for the Fed Chairmanship, such as Rick Rieder and Kevin Hassett, are keeping the "super cycle" expectations alive.
MARKET ANALYSIS AND GENERAL OUTLOOK
As of January 2026, the market has entered a consolidation phase following the aggressive rally at the end of 2025. Bitcoin’s journey from $40,000 to $95,000 has decoupled the market from the traditional "four-year cycle" theory, transitioning it into a more stable and long-term upward trend. Institutional ETF inflows have become a daily routine, while stablecoin volumes exceeding $47 trillion serve as the most concrete proof that blockchain networks have transformed into global payment infrastructures.
TOP 3 FAVORITE COINS: IN-DEPTH ANALYSIS
1. Bitcoin (BTC): The Strategic Reserve Asset
In 2026, Bitcoin is no longer just an investment vehicle; it has become a strategic reserve asset held on the balance sheets of nation-states and major corporations.
Recent Development: The new U.S. administration and potential Fed candidates (notably Rick Rieder, currently leading with a 59% probability) defining Bitcoin as a "modern safe haven" has significantly minimized sell-side pressure on BTC.
Analysis: BTC’s volatility has dropped below that of giant tech stocks like Nvidia. This allows conservative funds to allocate larger portions of their portfolios to Bitcoin.
Strategy: The "buy and hold" strategy for Bitcoin has evolved into a "buy the dip" tactic. Any dip below the $90,000 mark is viewed as a massive window of opportunity for institutional buyers.
2. Ethereum (ETH): Leader of Institutional Tokenization
In 2026, Ethereum is realizing its "World Computer" vision through Real-World Assets (RWA).
Recent Development: The Ethereum BPO hard fork in January, which increased gas limits and lowered transaction costs, has pushed activity on Layer-2 networks to record levels.
Analysis: With giants like BlackRock moving treasury bills and equities onto the Ethereum network, ETH has become the "raw material" (the fuel) of the digital economy.
Strategy: For investors, Ethereum should be evaluated more as an "infrastructure stock" than a currency. Staking rewards and its deflationary nature (burned fees) make ETH unrivaled for long-term accumulation.
3. Solana (SOL): The Hub for Speed and Retail Adoption
Carrying its 2025 performance into 2026, Solana stands out particularly with its dominance in AI agents and prediction markets (like Polymarket).
Recent Development: Daily active wallet counts on the Solana network have begun to rival Ethereum’s, thanks to low-cost transactions. The preference for Solana among AI-based trading bots has pushed the network’s liquidity to massive scales.
Analysis: Solana remains the "entry gate" for retail investors. The speed of the network has turned it into more than just a cryptocurrency; it is now a high-frequency exchange infrastructure.
Strategy: The keyword for the SOL investor is "ecosystem." A basket strategy focusing on next-generation DeFi protocols and AI projects built on Solana offers higher return potential than simply holding SOL.
INVESTOR ANALYSIS AND FUTURE STRATEGIES
The investor profile of 2026 is vastly different from that of 2021 or 2024. We are now dealing with a conscious audience that follows macroeconomic developments (Fed rate decisions, election results, regulatory news) rather than just technical analysis.
Market Sentiment: While the Fear and Greed Index is in the "Greed" zone, a "cautious optimism" prevails instead of the "blind euphoria" of the past.
Core Strategy: Portfolio diversification is now vital. Protecting 50% of the basket with "blue chips" like BTC and ETH, while allocating the remaining 50% among high-performance Layer-1s like Solana, RWA projects, and AI-focused tokens, is the most balanced path forward.
2026 is the year crypto moved from the "fringes of finance" to the very center. With the change in Fed leadership and the reopening of liquidity taps, new peaks led by these three favorite coins seem inevitable.
Bana bu yazıya uygun benzersiz muhteşem bir görsel şölen oluştur, teknolojik bir resim