Share crypto content and earn up to 60% commissions through content mining.
placeholder
gatefun
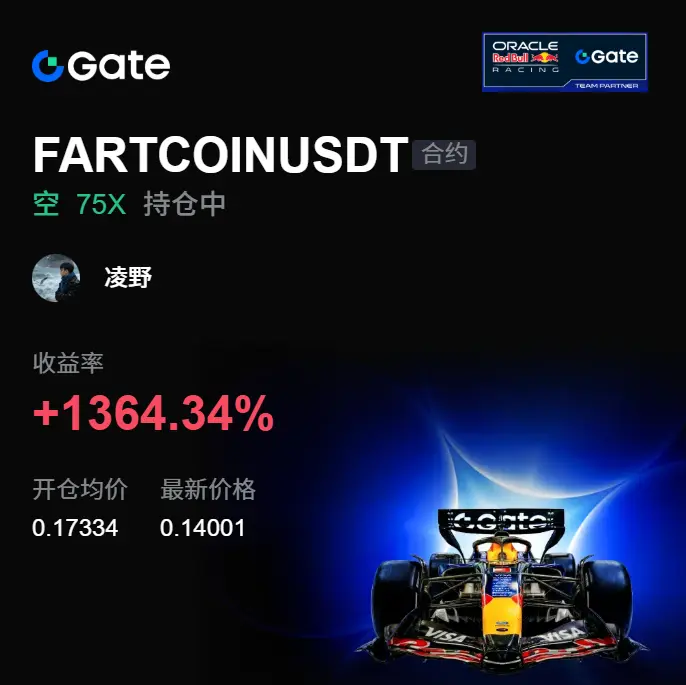
Guys, who understands this! Once this hits, the chart stops pretending📉🔥 A few days ago, before bed it was still grinding near the highs. A lot of people thought it could still break through. What I saw was the overhead resistance was way too obvious, and the volume didn’t follow. Every rebound always fell short by just one breath.
Before the chart was fully “on,” I was watching the $FARTCOIN order book/absorption. When it tried to go up, there was nobody there to take it. The bull-trap (fake-out) flavor got heavier and heavier. At the time, the advice was: don’t chase orders. Short positio
FARTCOIN-7.54%
BTC-1.13%
ETH-2.42%
View Original
post-image
  • Reward
  • Comment
  • Repost
  • Share
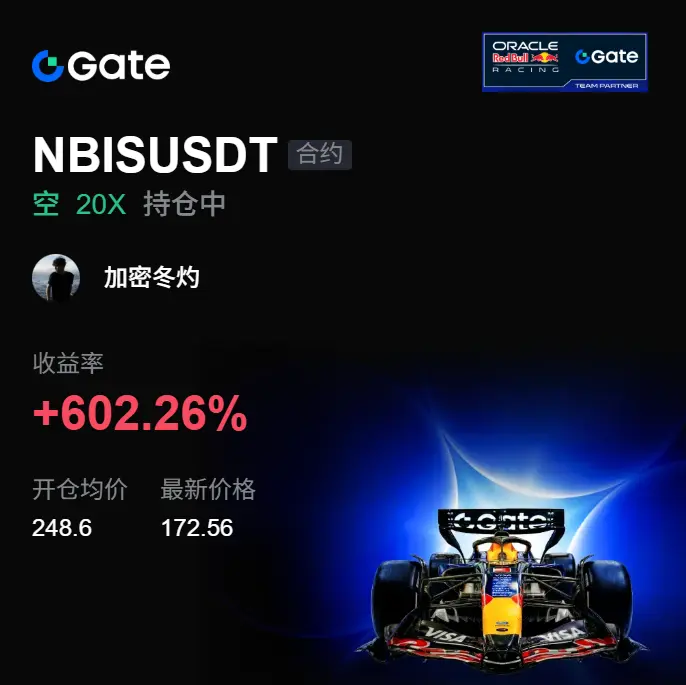
Woke up and instantly felt sharp! 📉😎 This morning I opened the order book, and $NBIS had already smashed through all the needless back-and-forth from a few days ago. That early-morning spike from a few days back—I felt the baiting-for-longs flavor was strong. Every time price tried to push up, it was short by just one breath.
At the time, I went long around 248.60. Now the price has come to 172.79, and the profit shows +602.26%. Everyone in the car should have already laughed awake ✅🎉—it wasn’t that the market suddenly started acting right. It was that the rhythm got stepped on early.
When
NBIS-11.90%
BTC-1.13%
ETH-2.42%
View Original
post-image
  • Reward
  • Comment
  • Repost
  • Share
BTC outlook improves after ~6% weekly gain as buyers return in spot, futures, and ETFs; geopolitical headwinds could still derail the rebound. $BTC
BTC-1.06%
post-image
  • Reward
  • Comment
  • Repost
  • Share
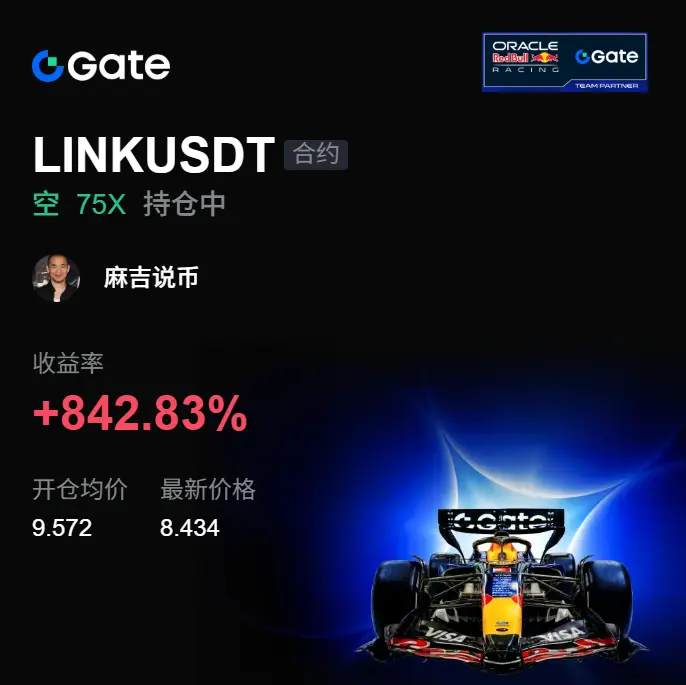
A few days ago it looked like it was going to hard push, but today it got pinned down by the shorts directly! When the price 📉🔥 churned higher intraday, I felt $LINK was off—on the surface it still looked like it could hold, but on closer inspection it was all fake.

Before the market fully kicked off, LINK bounced up but each wave was weaker than the last. The overhead pressure wasn’t being cleared, and the volume didn’t cooperate either 👀. I judged at the time that this wasn’t accumulation before a breakout—it looked more like a high-level liquidity bait to lure in longs—so I reminded:
LINK-1.11%
BTC-1.13%
ETH-2.42%
View Original
post-image
  • Reward
  • Comment
  • Repost
  • Share
That pullback just now was pretty brutal. A lot of people, seeing the sharp drop, immediately react by running, but I actually think there’s something here. Because after the sell-off, it didn’t keep breaking down with increased volume—instead, it quickly bounced back. This kind of anti-expectation move is the key.
For this long on $TRUTH , I entered at 0.010718. I’d already been watching this level. What really convinced me to stay was the speed of the repair after the dip. If the chart were truly weak, it wouldn’t give such a clean snapback.
Now the price is already at 0.012264, and the profi
TRUTH5.08%
BTC-1.13%
ETH-2.42%
View Original
post-image
  • Reward
  • Comment
  • Repost
  • Share
Guys, who gets it?! I was still grinding a few days ago before bed, and in the morning when I opened the chart, I was instantly energized 🚀👀
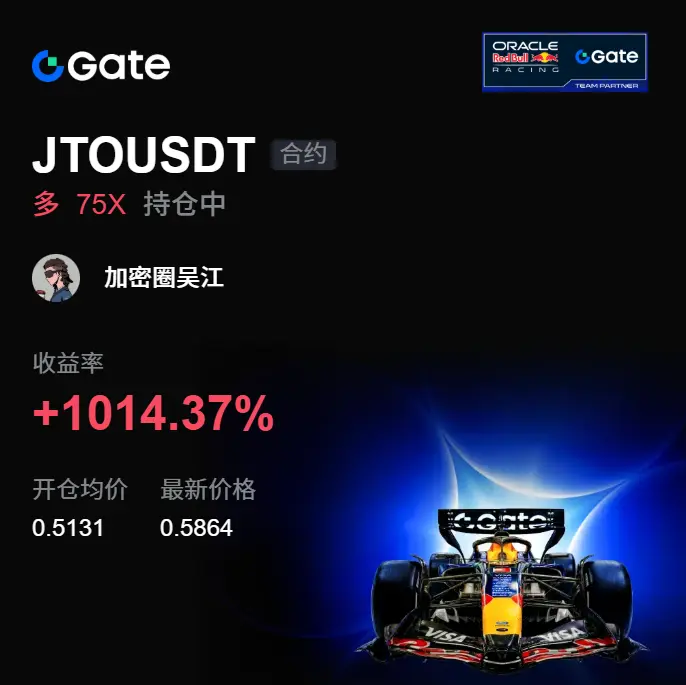
A few days ago at midnight, I watched $JTO . It pulled back, but the key level didn’t break. The bottom was just sideways grinding, and the sell pressure was also noticeably fading. I reminded everyone at the time: when the market hasn’t fully started yet, don’t rush to reject the bulls. If you want to go long, you can open a position and quietly get some orders filled first 📌📈
Now it’s pulled up from 0.5131 to 0.5864—this move of +1014.37% has already
JTO-6.21%
BTC-1.13%
ETH-2.42%
View Original
post-image
  • Reward
  • Comment
  • Repost
  • Share
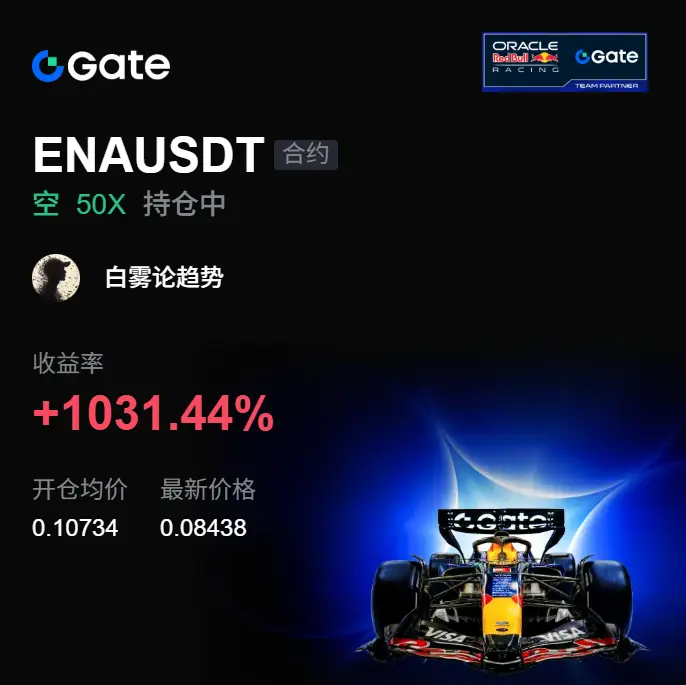
This drop looks very much like the typical pattern of sweeping first and then smashing. The spike at the high point of $ENA to bait longs was too obvious—if you react a little slower, it’s easy to get pulled in by emotions.

At the time, the price kept tugging around the 0.10734 area. On the surface it looked like there might be another push higher, but what I was watching was the follow-through. Once the above-side aggressive buy pressure weakened, the resting orders below were broken through, and the structure became wrong. A lot of people think it’s just normal consolidation—this is exactl
ENA0.63%
BTC-1.13%
ETH-2.42%
View Original
post-image
  • Reward
  • Comment
  • Repost
  • Share
Drop hello 👋 for 250+ Blue tick organic mutuals.
post-image
  • Reward
  • Comment
  • Repost
  • Share
Gate Polymarket has just rolled out a new feature, Real-Time Market Movement Alerts, designed to help users catch large capital flows the moment they happen, without needing to manually scan through every prediction event's order book.
The feature is available starting with app version v8.27.0, and its core function is monitoring large buy and sell transactions across all prediction markets in real time. The system pushes out capital flow signals and sentiment shifts directly to users, so there's no need to sit and watch individual events one by one, any significant trade gets flagged the inst
post-image
  • Reward
  • Comment
  • Repost
  • Share
Understanding Support & Resistance in Crypto
gate liveLIVE
420
live-coin
  • Reward
  • Comment
  • Repost
  • Share
#夏日创作营 US stocks show extreme divergence as inflation cools: Mag7 rushes to safety while the storage sector suffers a brutal selloff
On July 15, the U.S. released June PPI data. The overall reading came in below market expectations, and together with the earlier CPI’s signs of weaker inflation, it offered double confirmation of the trend of sustained easing in U.S. inflation.
After the data was released, market pricing for the probability of the Fed hiking again in September fell below 50%, and short-term rate-hike expectations largely dissipated.
However, on the same day, Fed Governor Wos kep
post-image
  • Reward
  • Comment
  • Repost
  • Share
today markets informations and signals
gate liveLIVE
367
  • Reward
  • Comment
  • Repost
  • Share
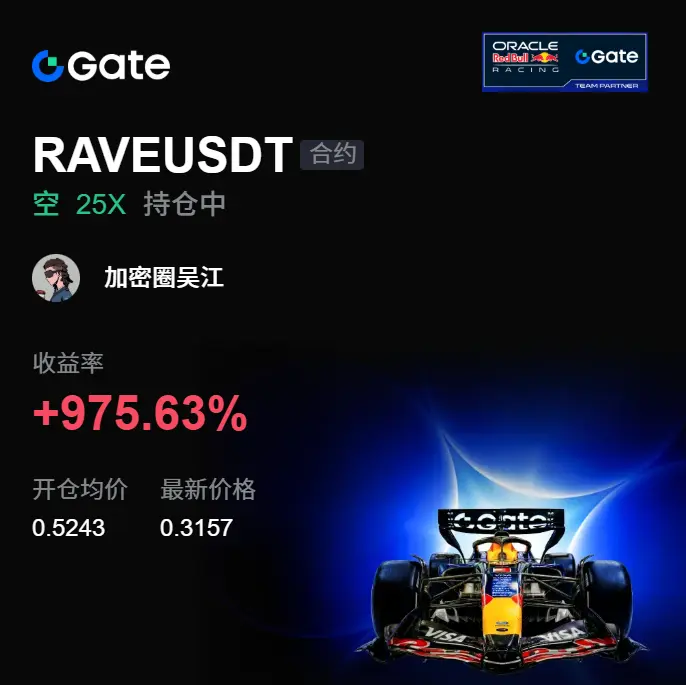
A few days ago I was still hesitating, but today I directly give the answer! 📉🚀 In the last glance before sleep, $RAVE is still hovering near the key level above, and many people watch it as if it’s about to break through. But I actually felt something was off—there’s no follow-through on volume, and the support is also weak 👀

My judgment back then was very straightforward: Don’t get carried away with a volume-less push. If the overhead resistance isn’t consumed, the rebound will only get more likely to turn into a pullback the more it grinds, so I warned to open longs and keep an eye on
RAVE11.70%
BTC-1.13%
ETH-2.42%
View Original
post-image
  • Reward
  • Comment
  • Repost
  • Share
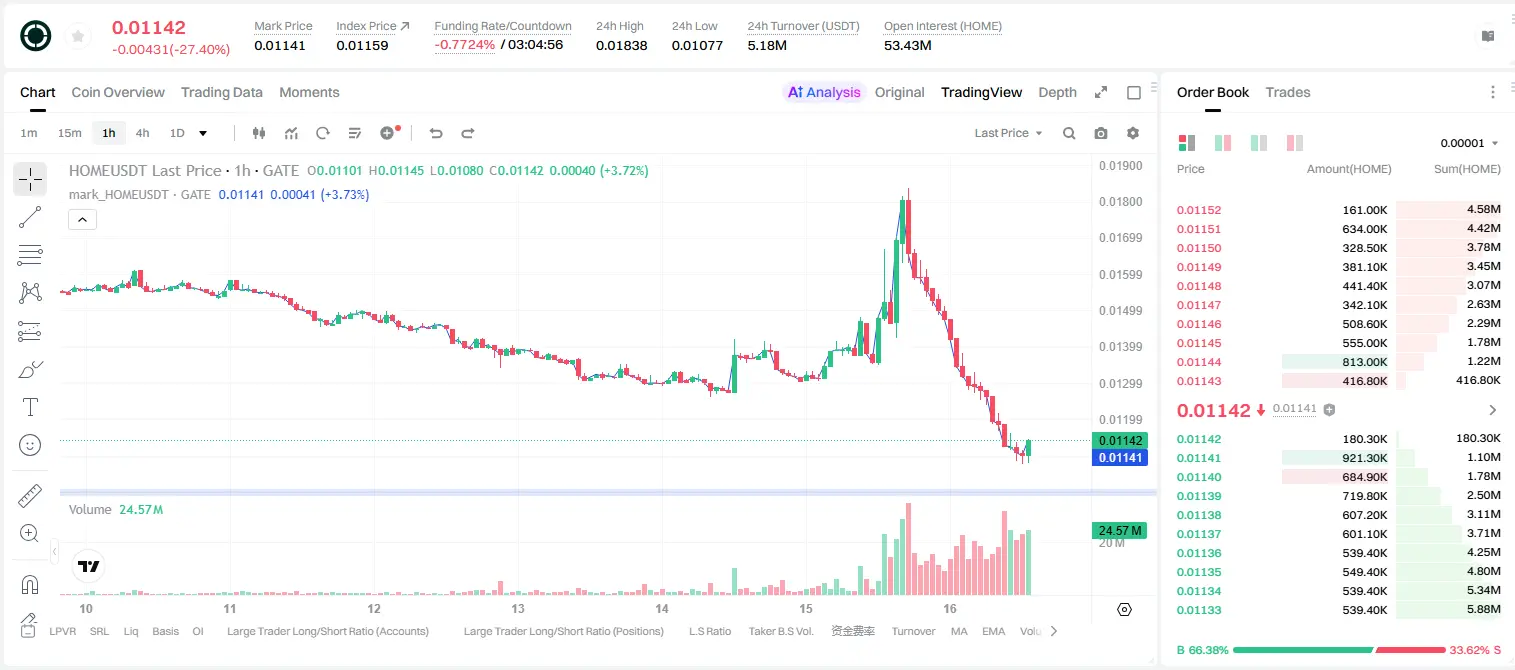
4-hour-level reversal signal—can $HOME /USDT surge higher against the trend?
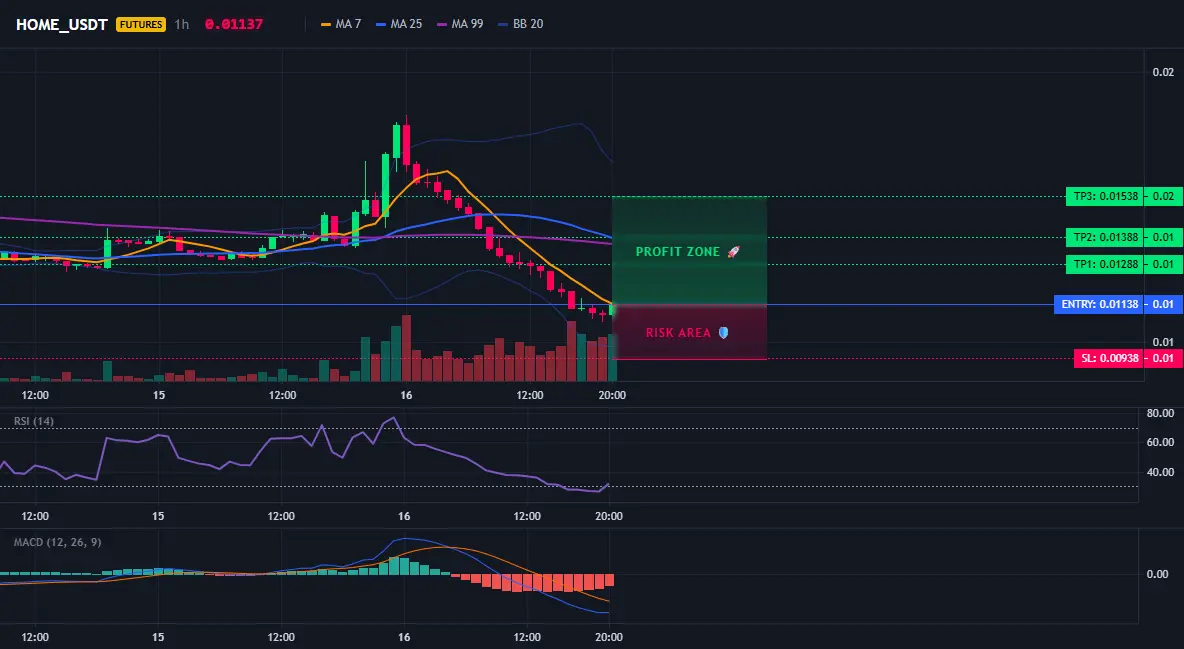
HOME_USDT - LONG
Trading plan:
Entry: 0.01122 – 0.01154
SL: 0.00938
TP1: 0.01288
TP2: 0.01388
TP3: 0.01538
Why focus on this structure?
- The current 4-hour EMA/RSI shows oversold bounce potential; the 15-minute RSI is only 45.25 and has not become overheated yet.
- The daily chart is somewhat bearish, but an 84% high-confidence LONG signal points to short-term bullish momentum.
- Key support is 0.01122; after breaking 0.01154, the target directly points to TP1 at 0.01288.
Discussion:
Will this bounce first tag TP1, o
HOME-26.96%
View Original
post-image
post-image
  • Reward
  • Comment
  • Repost
  • Share
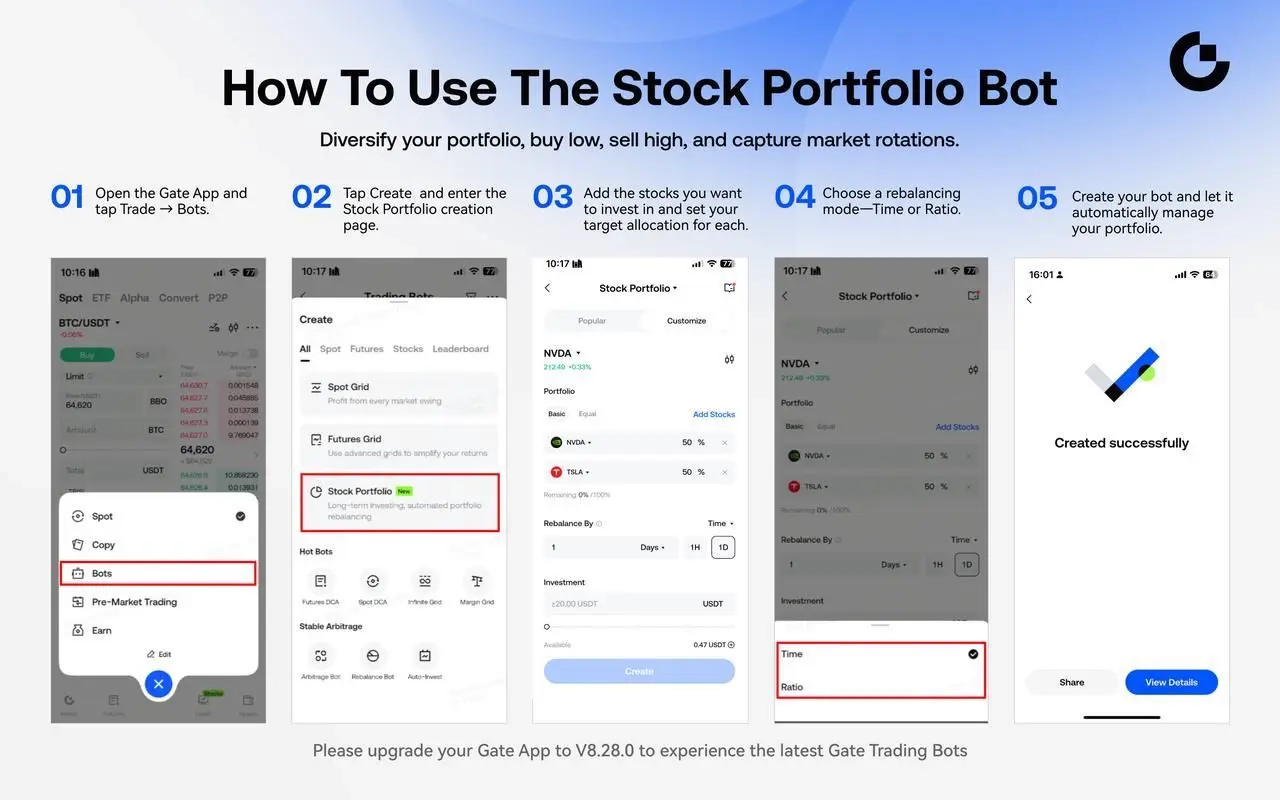
Gate has launched a new Stock Portfolio Bot, giving users a way to build and automatically maintain a diversified equity portfolio across more than 12,500 stocks spanning the US, Hong Kong, and South Korean markets.
The core idea is straightforward, users pick between 2 and 10 stocks and assign each one a target allocation percentage. As prices move and the portfolio's actual weights drift away from those targets, the bot steps in automatically, trimming positions that have grown overweight and adding to ones that have fallen underweight, continuously pulling the portfolio back toward its orig
post-image
  • Reward
  • Comment
  • Repost
  • Share
The most dangerous silver trade may be buying 54.5 simply because it looks like support.
XAGUSDT is approaching the 54.3–54.8 zone, where several technical factors may converge:
• Historical horizontal support
• The origin of the previous rally
• Weekly EMA100
• The lower boundary of the current descending structure
But the daily chart is still forming Lower Highs and Lower Lows, with price trading below the major moving averages.
That means 54.5 is only a potential reaction zone—not an automatic buy signal.
I would only consider a long after price enters 54.3–54.8 and shows evidence t
XAG-3.71%
  • Reward
  • Comment
  • Repost
  • Share
New Tradefi event on Gate io.
Trade cumulative volumes daily to qualify for a successful check in and earn tradefi vouchers daily and usdt.
150 USDx Voucher + Daily Rewards Await
post-image
  • Reward
  • Comment
  • Repost
  • Share
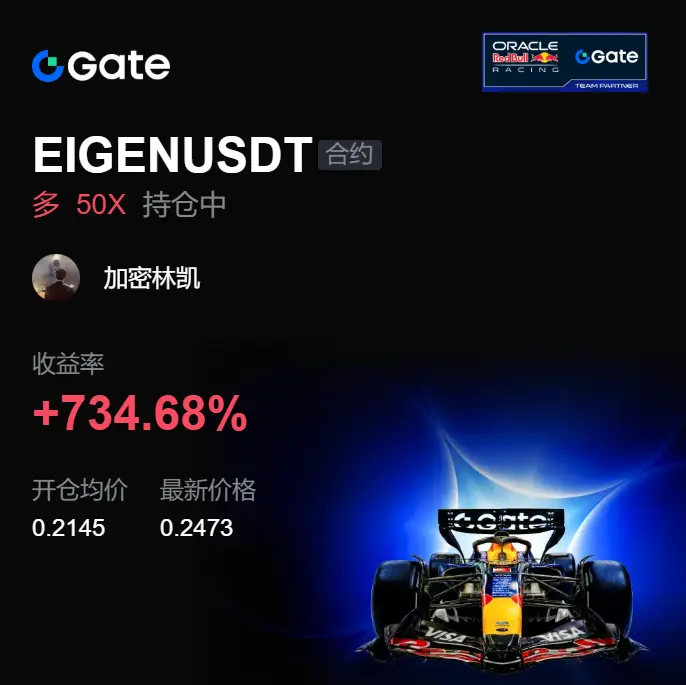
The comfortable part of this trade isn’t that people say they’re bullish only after it pumps—before the move started, the order book already showed the taste of it. $EIGEN has been pushed down ahead of time; on the surface it looks weak, but in reality the bid support at lower levels has been getting firmer and firmer.

I opened a long at 0.2145. Back then, many people were still watching the key levels above. What I was watching instead was whether anyone was stepping in to buy on the pullbacks. The key is right here: every time the price got slammed down, it failed to break through. That cl
EIGEN2.96%
BTC-1.13%
ETH-2.42%
View Original
post-image
  • Reward
  • Comment
  • Repost
  • Share
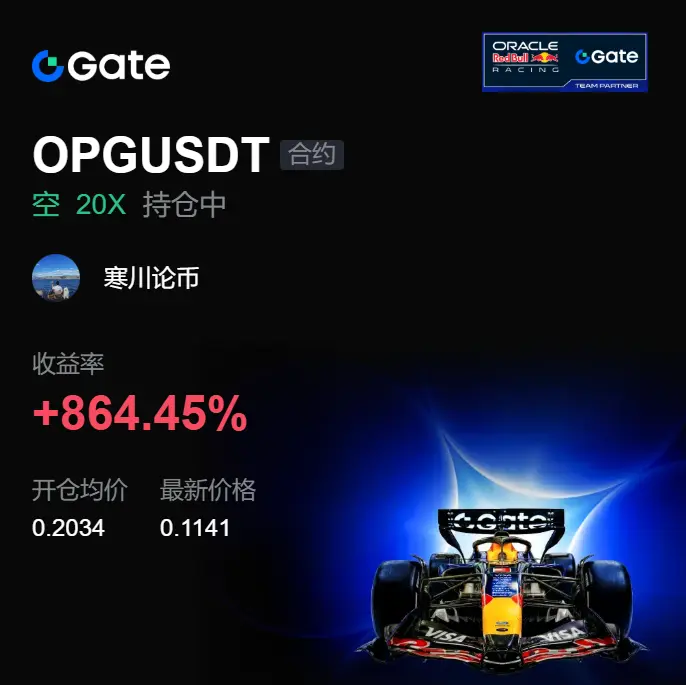
Kept grinding a few days ago, but today it straight up gives the answer! 📢📉 The last look before bed, $OPG was still holding strong sideways at the high, but nobody followed up to buy, and the volume didn’t keep up either. At that time I judged this was more like a bull trap, so don’t rush to exit the short—stay in. Great positions are waiting to be made, not chased into. 👀 When it’s time to take profit, don’t pretend to be calm. Entry position: 0.2034. Now it’s already at 0.1139, and the return is up to +864.45%. This grind wasn’t in vain 🎯🔥 Once the chart breaks and the rhythm changes,
OPG1.24%
BTC-1.13%
ETH-2.42%
View Original
post-image
  • Reward
  • Comment
  • Repost
  • Share
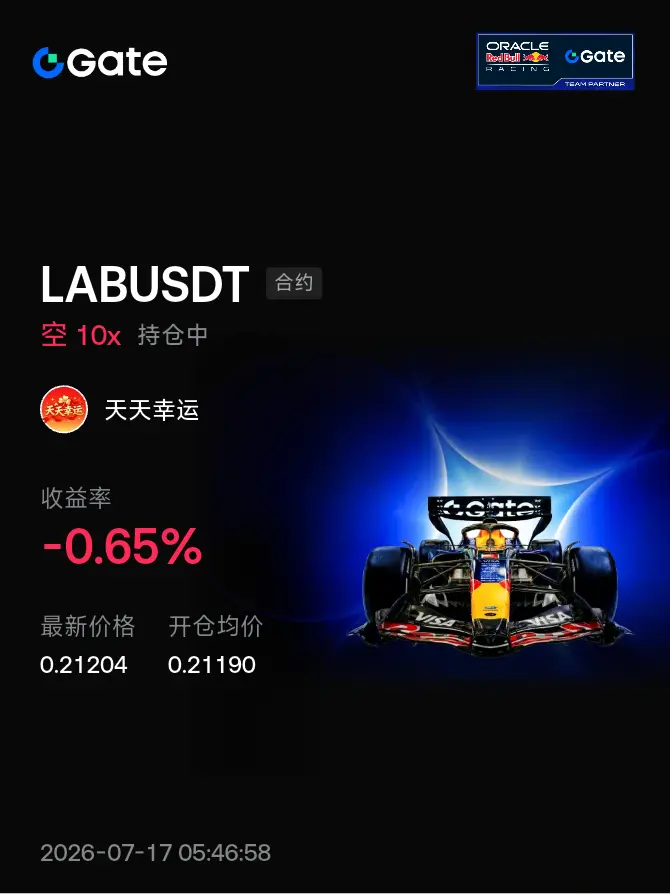
#晒出我的持仓收益#
In this game, I’m not here to look for thrills. If I wanted thrills, I could play other games.
View Original
post-image
[The user has shared his/her trading data. Go to the App to view more.]
  • Reward
  • 1
  • Repost
  • Share
GettingRichDependsOn:
Boss, which one should we buy now?
Load More

Join 40 M users in our growing community

⚡️ Join 40 M users in the crypto craze discussion
💬 Engage with your favorite top creators
👍 See what interests you
  • Pinned