Share crypto content and earn up to 60% commissions through content mining.
placeholder
gatefun
Honestly, this chart really knows how to mess with people. 👀🚨 While everyone is still watching, $PEPE it looks like it’s about to push higher—but the sell pressure above is obvious. The rebound is weak; when it tries to go up, there’s nobody to take it. I told everyone at the time to prioritize the short idea first—don’t get thrown off by a short-term surge.
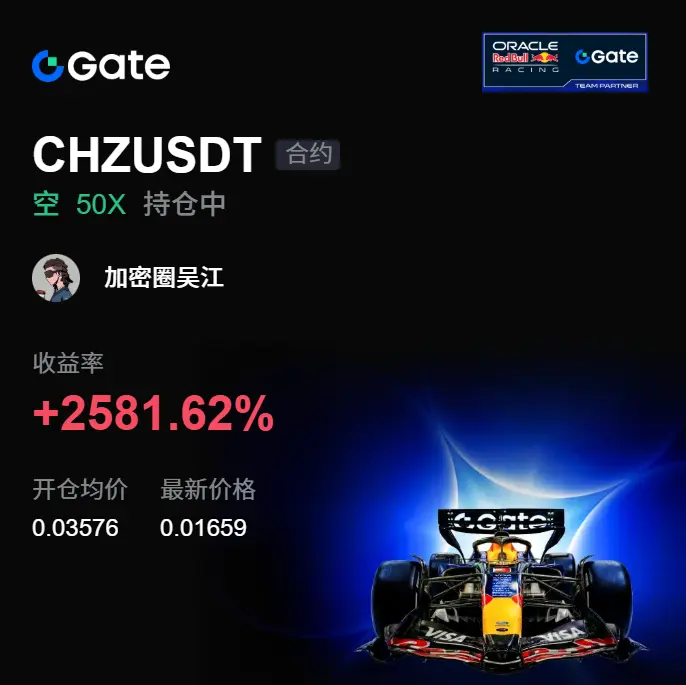
Built from 0.000003779, and now at 0.000002707, +2012.81%—I’ve already got it in hand. No wasted wait—📉✅ this kind of market is afraid that once you understand it, you won’t dare to act, and if you do, you won’t be able to hold.
That’s
PEPE-2.76%
BTC-0.43%
ETH0.22%
View Original
post-image
  • Reward
  • Comment
  • Repost
  • Share
ZEC bullish signal 95%, but RSI is only 39—who’s lying?
$ZEC /USDT - Go LONG
Trading plan:
Entry: 505.26 – 508.92
SL: 489.50
TP1: 520.28
TP2: 529.08
TP3: 542.27
Why focus on this structure?
- 4H EMA bullish alignment, the 1D trend is clearly bullish, but the 15-minute RSI is only 39, indicating the short-term is severely oversold.
- ATR 7.32 suggests volatility may expand; current 507.09 is near the support zone, and the LONG risk-reward is over 1:2.
- Why now? RSI is at a low level + trend resonance—a typical pullback buying window, not chasing after a pump.
Discussion:
Will this wave hit TP1
ZEC2.14%
View Original
post-image
post-image
  • Reward
  • Comment
  • Repost
  • Share
you were not too much.
you were too much
for people
who were too little.
there is a difference.
and one day
someone will need
exactly the ocean
you were told
to shrink. 🌹
post-image
  • Reward
  • Comment
  • Repost
  • Share
Loss aversion: Why do you always rush to sell winning trades, but stubbornly hold onto losing ones?
📈 You’ve just made a little profit—after a slight pullback, you quickly close the position, afraid the gains will fly away.
📉 When you lose money, and price breaks below the support level, you don’t run—instead you hold on tightly, expecting a miracle to happen.
That’s a human weakness: loss aversion. With the same amount lost, the pain is 2.5 times the joy brought by profits.
How to overcome it?
1️⃣ Move the stop-loss: After your profit exceeds a certain percentage, move your stop-loss up to
ETH0.22%
BTC-0.43%
View Original
post-image
  • Reward
  • 2
  • Repost
  • Share
GateUser-7919e6b9:
You’re absolutely right. Last time I locked in profits of 10% and rushed to get out—then it went up another 50%. But the losing trades are trapped and have been held for three months without cutting them yet [facepalm]
View More
Was grinding a few days ago, and today it directly gives the answer! 📉😎 When I opened the chart this morning, I saw that this wave of short positions on $AVAX were cashed out decisively. The mood couldn’t be held down at the highs, and the price finally got hammered lower.
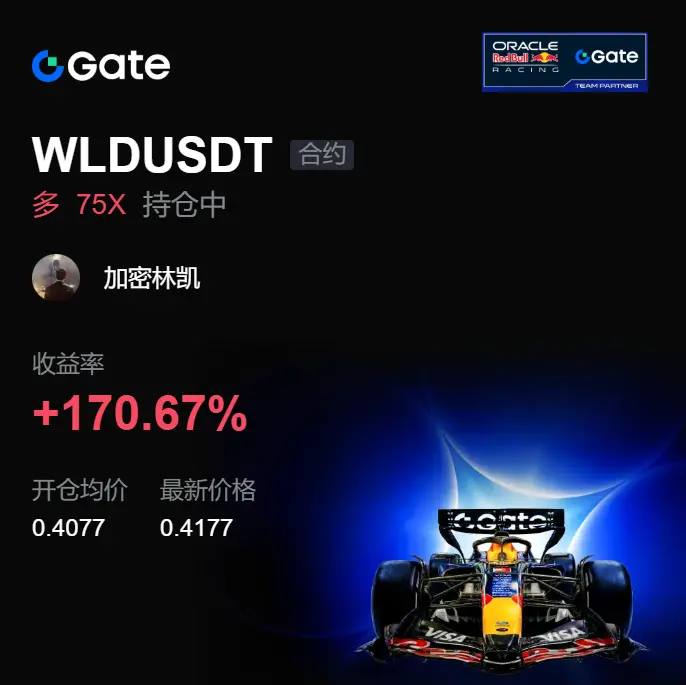
Looking back to a few days ago, when the market hadn’t fully started yet, I noticed it was rebounding without volume and nobody was buying the breakout—so every push felt more and more hollow. That’s why back then I gave the call to open long. From 8.317 to now 6.477, profit +1568.92%🔥🎯
If you understand it, execute—don’
AVAX-3.61%
BTC-0.43%
ETH0.22%
View Original
post-image
  • Reward
  • Comment
  • Repost
  • Share
A few days ago it was still stalling, but today it just gives the answer directly! 📢 $CL This leg of the drop didn’t come out of nowhere. My last look before bed showed price capped and pinned under the overhead pressure, and the volume couldn’t keep up.

At the time, I judged the rebound would be weak—when it ran up, nobody stepped in to buy. So I warned not to fight a long battle at the high levels, and to keep a close eye on the short position. Around 95.78, I got the opportunity; the current price is now 73.9, and +2122.57% has been realized. This profit feels so good to take! 💰📉🎉

CL2.56%
BTC-0.43%
ETH0.22%
View Original
post-image
  • Reward
  • Comment
  • Repost
  • Share
A seemingly ordinary fluctuation is actually hiding a change in direction. The longer $BTC stays sideways before that, the more I pay attention to the strength of the direction it chooses afterward.

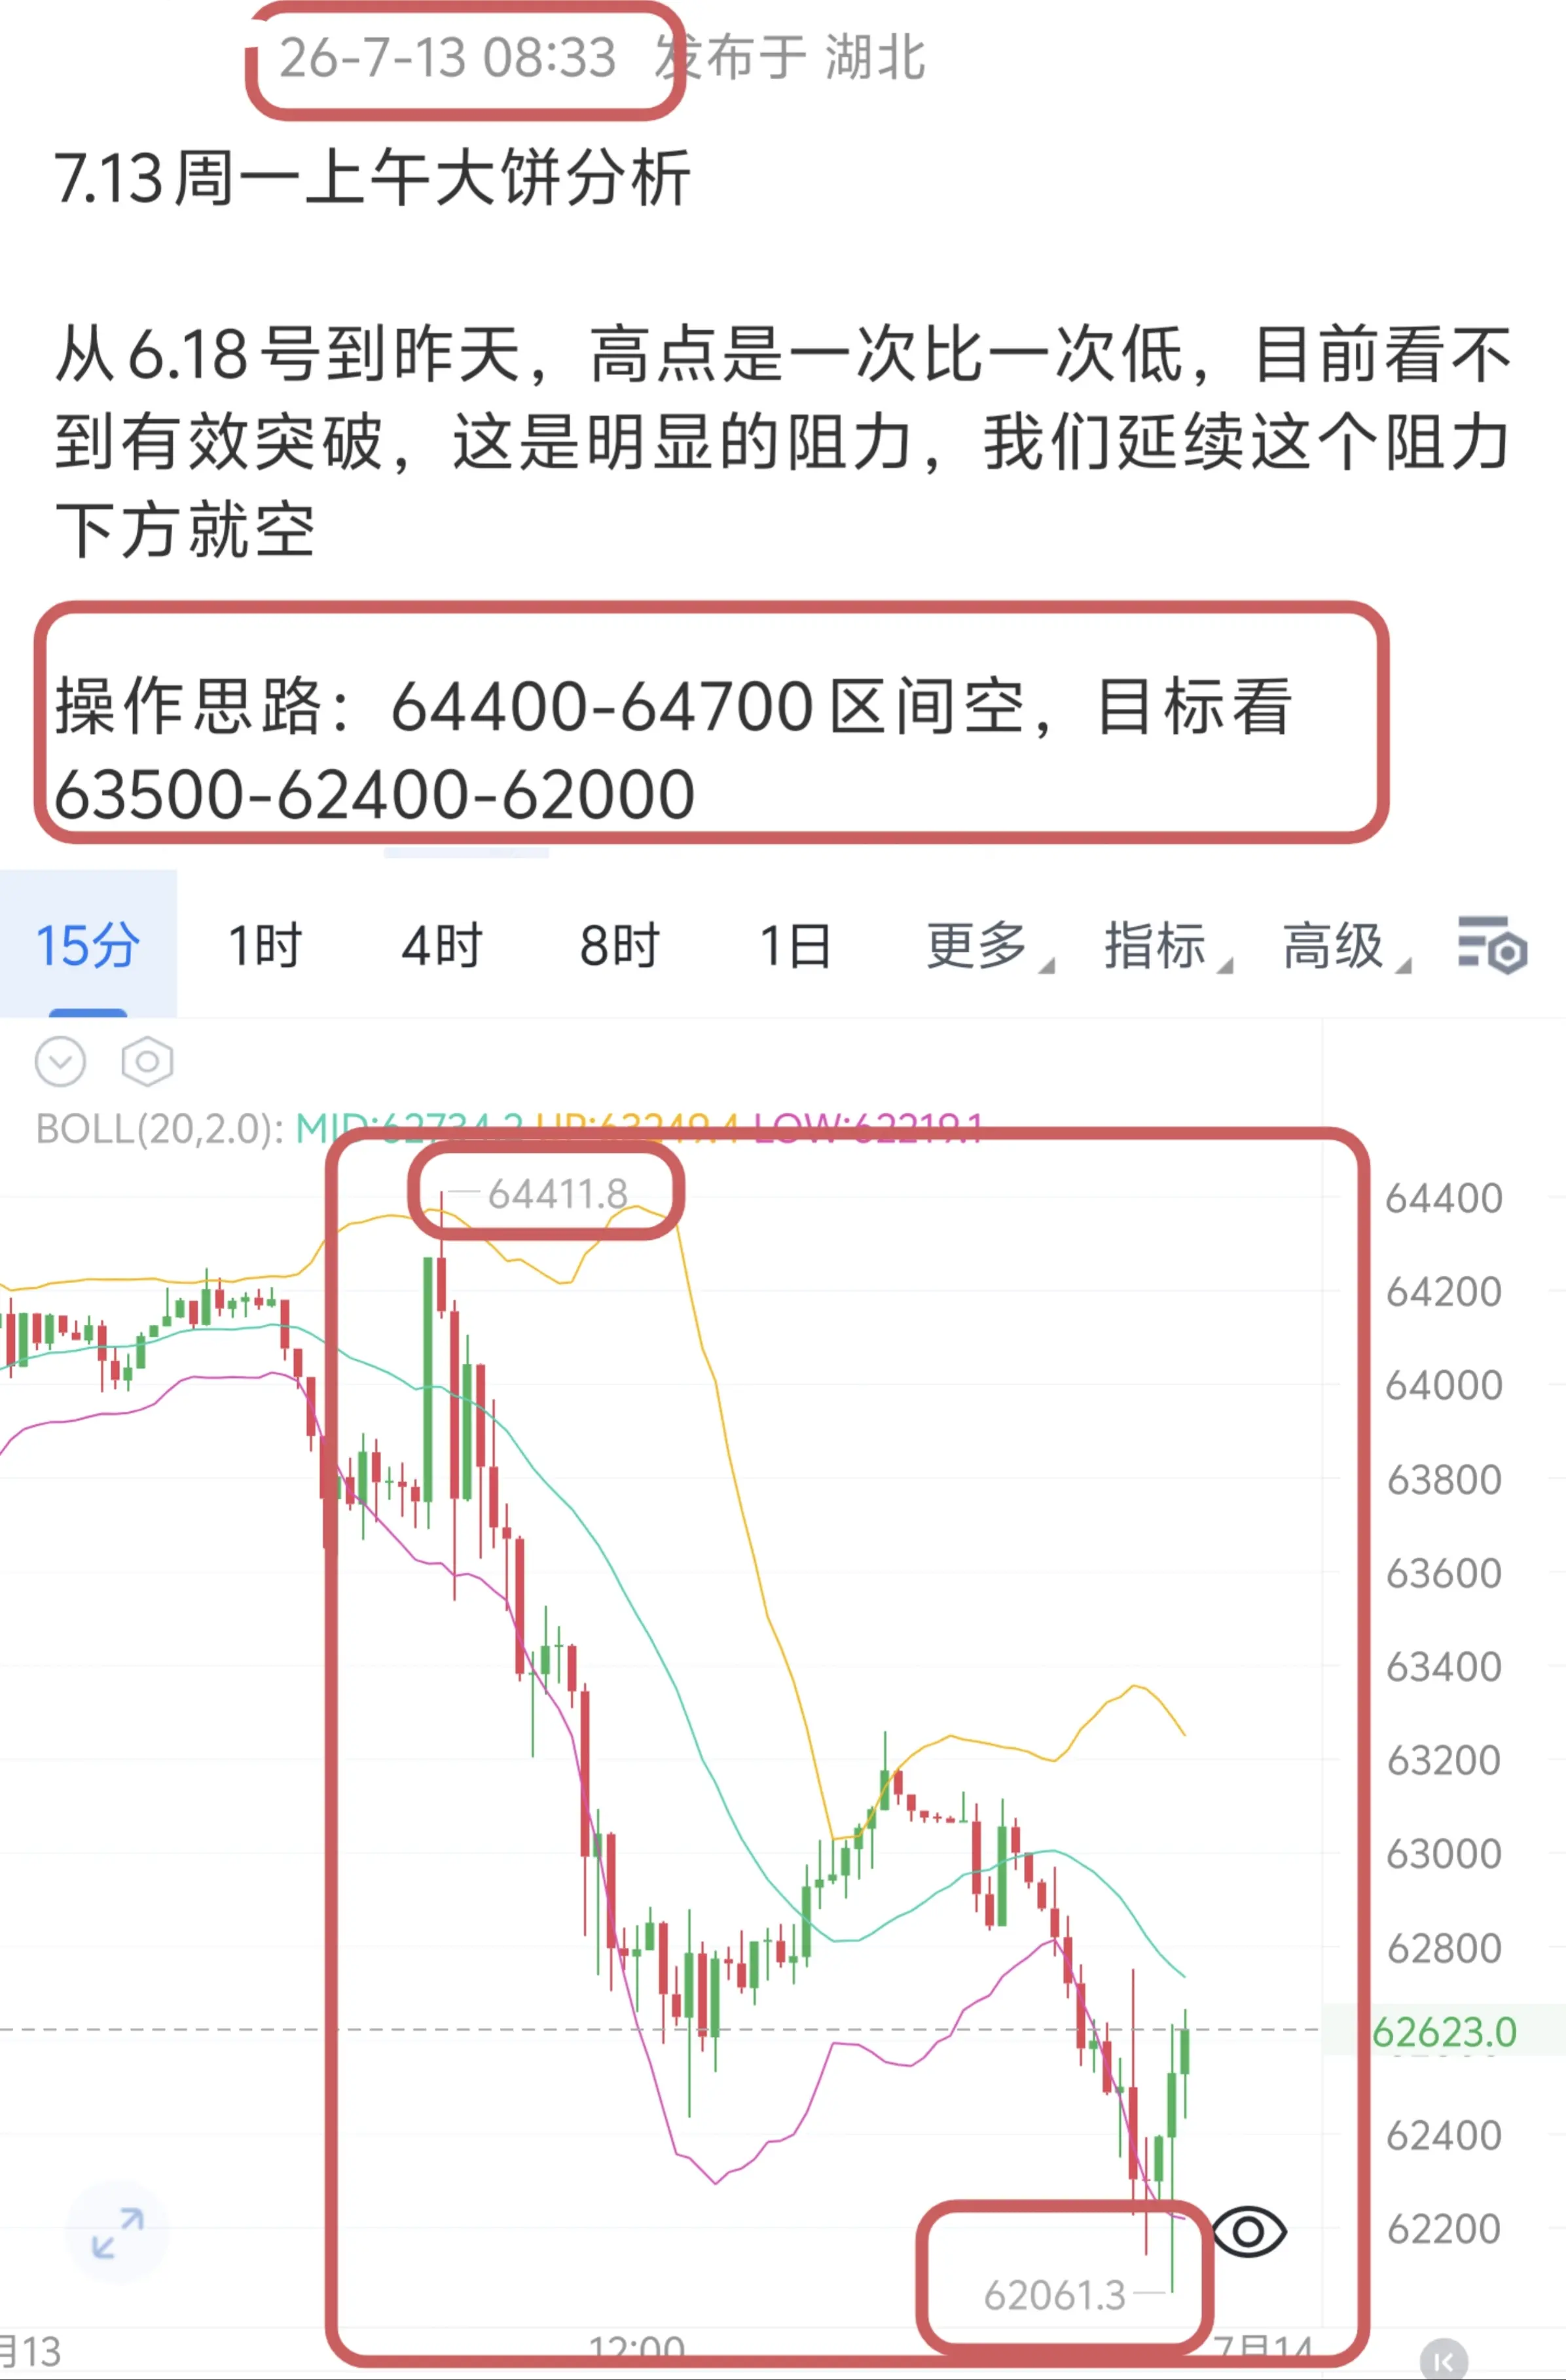
My trading habit is to first look at how it’s being absorbed, then to see whether the breakout is actually effective. The level 62697.3 gave me something to base my observation on. After price pushed to 63935.9, the return rate showed +341.68%, indicating that this rally’s pace has been playing out pretty well.

The clearest feeling during this move is that once price gets out of the hesitation
BTC-0.43%
ETH0.22%
SOL-1.78%
View Original
post-image
  • Reward
  • Comment
  • Repost
  • Share
$BTC ‌Crypto market small-cap positions: complete set of position-splitting formulas (tailored for your $300K–a few ten-thousand U practical use)
I. Core formulas for splitting the total base position (fixed 4-way split; what you usually use)
Total principal = A
Maximum position for trial-and-error per trade = A ÷ 4
Maximum loss per trade (single order) = single position × single-trade stop-loss ratio
Example: total funds 400U
Single entry: 400÷4=100U, strictly do not exceed
II. Trend-following rolling addition (only when the trend is clearly defined; do not add in range-bound condi
BTC-0.43%
View Original
post-image
post-image
  • Reward
  • Comment
  • Repost
  • Share
Swing Trading
gate liveLIVE
1,663
live-coin
  • Reward
  • Comment
  • Repost
  • Share
JUST IN: US strikes Iran for the third time in a week, per US Central Command. If this shifts risk sentiment or sanctions dynamics, traders may react in risk-off moves across crypto markets. $BTC $ETH
BTC-0.41%
ETH0.21%
post-image
  • Reward
  • 1
  • Repost
  • Share
IAmHaifeng:
Breaking news: The U.S. Central Command says the United States has carried out its third strike against Iran within a week. If this changes risk sentiment or sanctions dynamics, traders may react in a risk-off move across the entire crypto market. $BTC $ETH
Guys, who understands this! After this one drops, the chart stops pretending📉🔥. A few days ago before bed it was still grinding at a high level, and a lot of people thought it could still run higher. What I saw at the time was that the resistance above was way too clear, but the volume didn’t keep up—once it went up, nobody was there to take it. The bearish “air” has already shown up$LAYER . Back then, around 0.08946, I gave the idea to open a long, not to chase and fight—wait for it to rebound and lose steam before moving🎯. This morning when I opened the chart, the price was already at 0.0
LAYER-1.34%
BTC-0.43%
ETH0.22%
View Original
post-image
  • Reward
  • Comment
  • Repost
  • Share
Woke up and instantly felt in high spirits! 📉🚀 A few days ago, in the afternoon, $APT was still hovering at a high level. On the surface it looked pretty strong, but in reality the follow-through was clearly insufficient—once it got pulled up, it went soft; the bullish-trap (long-pump bait) flavor is really strong.
I was watching the order book at the time. I saw the overhead pressure keep suppressing everything, and the funds didn’t continue to follow through, so I immediately came up with a long position idea. My entry price was 0.8512, and now it’s already down to 0.6215—the profit shows
APT-1.05%
BTC-0.43%
ETH0.22%
View Original
post-image
  • Reward
  • Comment
  • Repost
  • Share
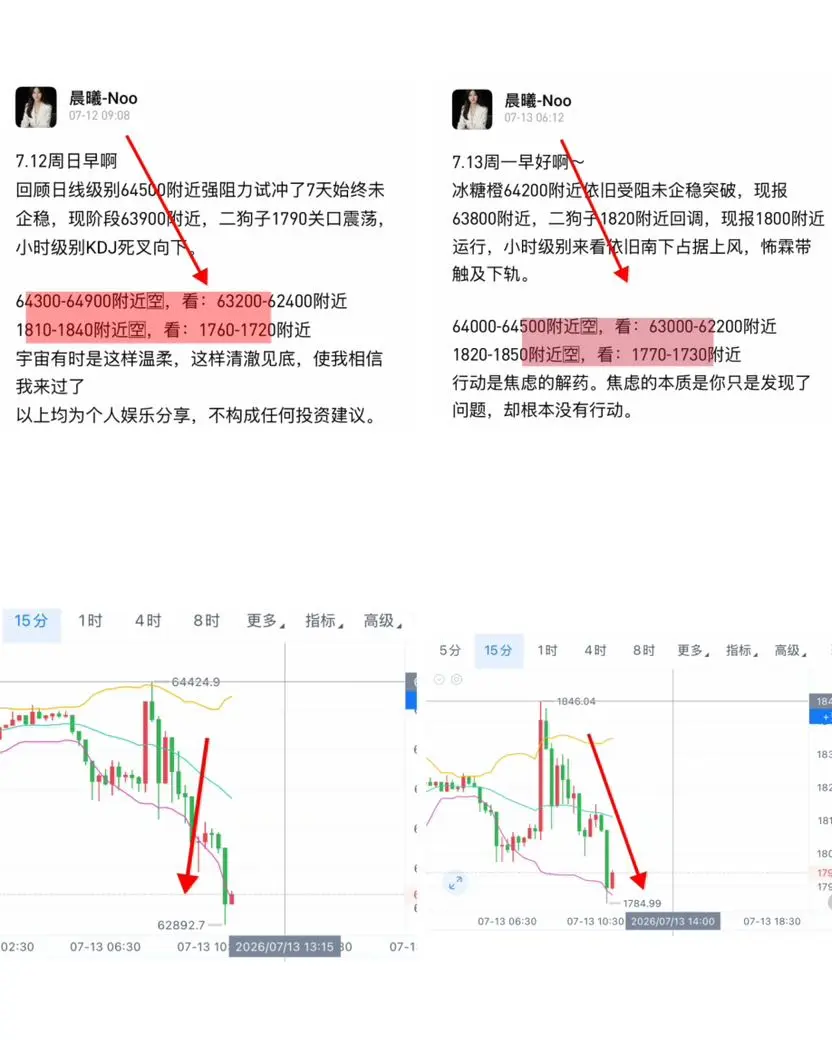
On the weekend, the Ethereum price overall moved out of a period of consolidation and saw a slow upward trend. It peaked around 1829, then made a slight pullback below 1800 in the early morning. From the current chart, the price is trading near the Bollinger Band midline. In the short term, if it can successfully hold above the midline, there will still be a chance to continue the prior uptrend. The weekend trend was relatively choppy—although there was a breakout, it was quickly pressured back into a pullback. For ultra-short-term setups, you can participate with a brief long position near su
ETH0.21%
View Original
post-image
  • Reward
  • Comment
  • Repost
  • Share
$SUI has just dropped very nicely— the grinding consolidation before finally gave direction. My opening position is at 1.0030. Now the price is pushed down to 0.7298, and the current profit is +1310.77%. This isn’t luck—it’s the rhythm coming through after pressure at the high.
Back then, many people only focused on the rebound height. I cared more about whether there was follow-through after the rebound. The result is obvious: every time it rises, it gets pushed back, and the key levels are slowly moving downward—the structure has clearly changed. The key is right here: once the price breaks
SUI-0.91%
BTC-0.43%
ETH0.22%
View Original
post-image
  • Reward
  • Comment
  • Repost
  • Share
Don’t say—this round really gave face. 🚀 A few days ago, at around midnight, it was still repeatedly grinding the base, but today it directly delivered the result—$ALLO the long positions have been cashed out very smoothly.

While it was grinding the base during the session, I watched it closely. There was persistent support from below; as long as the key level held and wasn’t broken, selling pressure didn’t keep expanding. 📌 At the time, I pointed out that you could go long around 0.24014. The key isn’t whether it moves fast—the key is that the position is comfortable enough.

Now the pr
ALLO-9.99%
BTC-0.43%
ETH0.22%
View Original
post-image
  • Reward
  • Comment
  • Repost
  • Share
It exploded! It propped up strong in the high range for half a day, and in the end the bears still pressed it down. 🔥📉 When I opened the chart this morning, $SLX immediately knocked that fake rebound from days ago back to its original shape.

Back a few days ago, when everyone was still watching from the sidelines in the afternoon, I saw SLX rise with a lot of effort—it would soften right after trying to push up, and the buy-side support was clearly insufficient. 👀 With a market like this, I wouldn’t go chase the excitement. Once I saw the overhead resistance wasn’t being broken, I gave t
SLX-5.01%
BTC-0.43%
ETH0.22%
View Original
post-image
  • Reward
  • Comment
  • Repost
  • Share
This round is a classic pattern of first scaring people, then pumping the market. After that initial pullback and retest in $IO , many thought it was going to break down—but the long positions held from 0.16220 to 0.16536. Now it’s up 138.33%, and the chart directly flushed out the panic sellers.
What really caught my attention is that after the drop, it didn’t continue to sell off with heavy volume. Instead, it quickly recovered, which suggests there are buyers underneath. Most people, seeing a sharp drop, only think about running—but trading can’t just look at the surface. After sweeping one
IO-2.87%
BTC-0.43%
ETH0.22%
View Original
post-image
  • Reward
  • Comment
  • Repost
  • Share
Crypto market rallies against weak stock market trends, with altcoin optimism heating up ahead of th
gate liveLIVE
2,196
live-coin
  • Reward
  • Comment
  • Repost
  • Share
Too ruthless! After this dump, my screen even feels clearer. 🚨📉 A few days ago, before bed $MON was still hard-up at the high end. A lot of people saw the bounce and wanted to rush in. At the time, I wasn’t focused on whether it would rise—I was focused on whether anyone would be there to catch it.
Before the board fully kicked off, every time MON surged it always lacked a breath, and volume didn’t keep up. The moment the overhead pressure got touched, it turned soft 👀 So at that time I judged the bounce more like a bull trap, and I followed the plan to open a long around 0.02670.
Now the
MON-3.48%
BTC-0.43%
ETH0.22%
View Original
post-image
  • Reward
  • Comment
  • Repost
  • Share
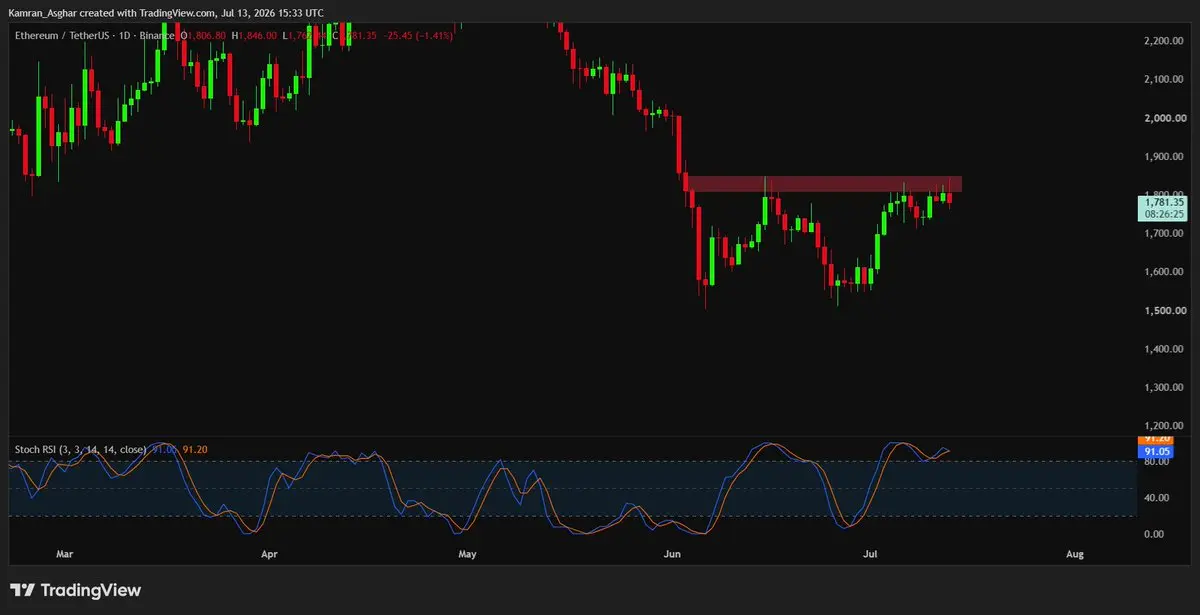
🚨 ETH Looks Ready for the Next Big Move! Don't trade blindly—follow for high-probability crypto setups. 📈
ETH/USDT (4H) Technical Analysis
Ethereum is trading around $1,786, consolidating just below a key resistance zone. Price remains above the MA30 ($1,771), showing that the overall trend is still bullish despite short-term weakness. However, the MA5 and MA10 are flattening, suggesting buyers need fresh momentum for a breakout.
📊 Key Levels
Support: $1,775 – $1,765
Major Support: $1,740
Resistance: $1,800 – $1,820
Breakout Target: $1,860 – $1,900
📈 Indicators
MACD: Bullish momentum is fa
ETH0.21%
post-image
  • Reward
  • Comment
  • Repost
  • Share
Load More

Join 40 M users in our growing community

⚡️ Join 40 M users in the crypto craze discussion
💬 Engage with your favorite top creators
👍 See what interests you
  • Pinned