Share crypto content and earn up to 60% commissions through content mining.
placeholder
gatefun
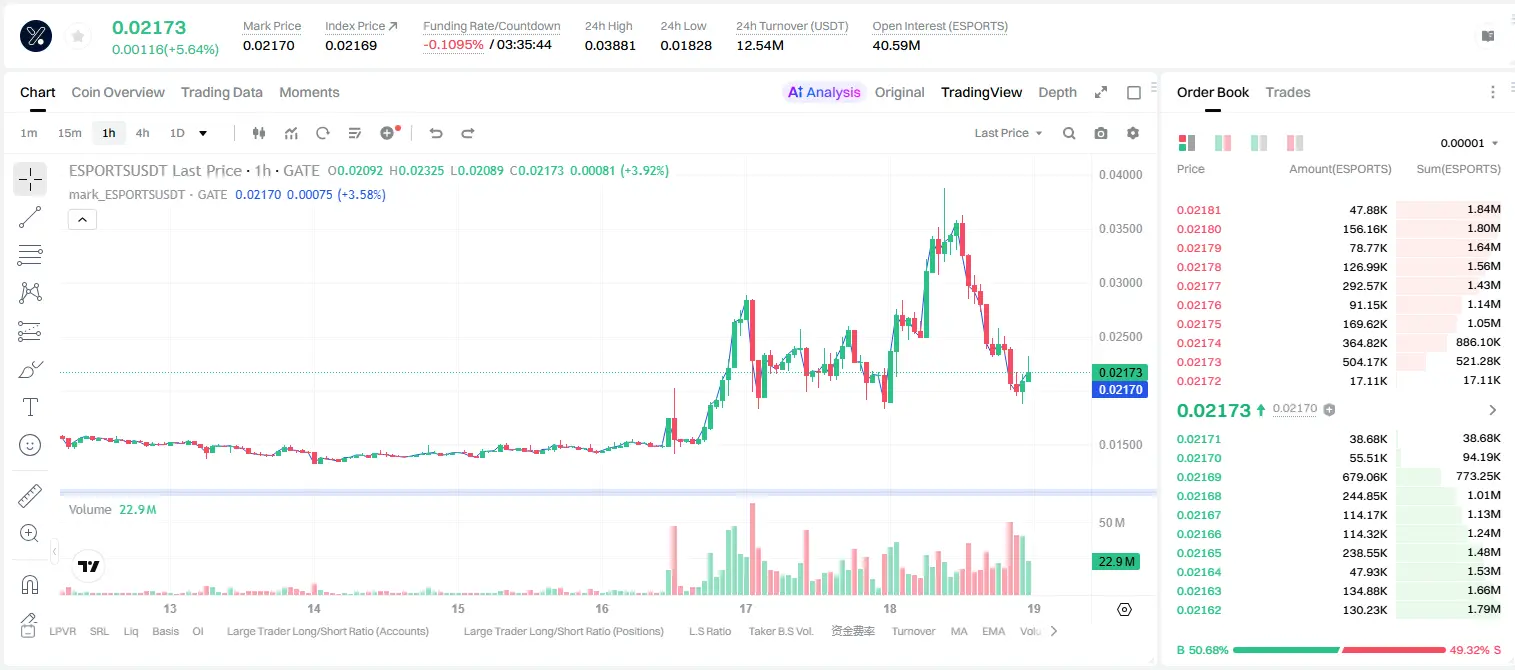
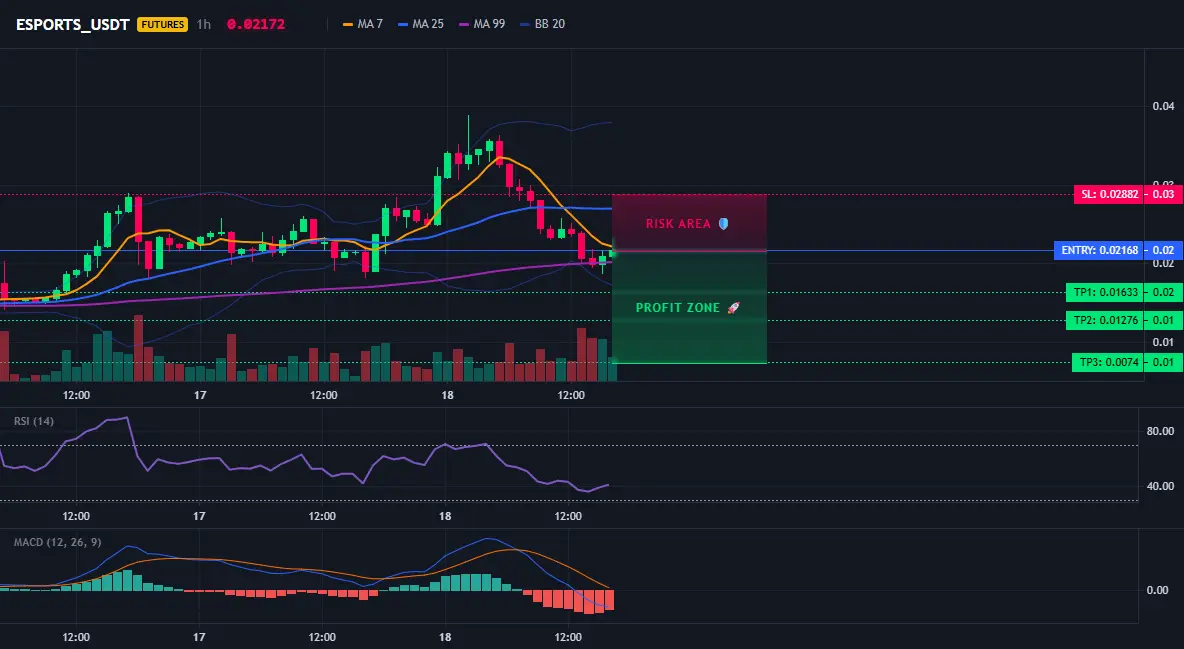
$ESPORTS /USDT 4-hour short signal 95% confidence—who’s getting ready in ambush?
$ESPORTS /USDT - SHORT
Trading plan:
Entry: 0.02094 – 0.02242
SL: 0.02882
TP1: 0.01633
TP2: 0.01276
TP3: 0.00740
Why focus on this structure?
- 4-hour short trend confirmation; the 1-day chart remains bearish, with clear EMA suppression.
- RSI on the 15-minute timeframe is 44.25; it hasn’t hit oversold yet, and there’s still room for downside.
- Target TP1 0.01633, TP2 0.01276, stop loss 0.02882; the risk-reward ratio is better than 1:3.
- Around 0.02168 currently—if it breaks below 0.02094, the probability of acc
ESPORTS48.16%
View Original
post-image
post-image
  • Reward
  • Comment
  • Repost
  • Share
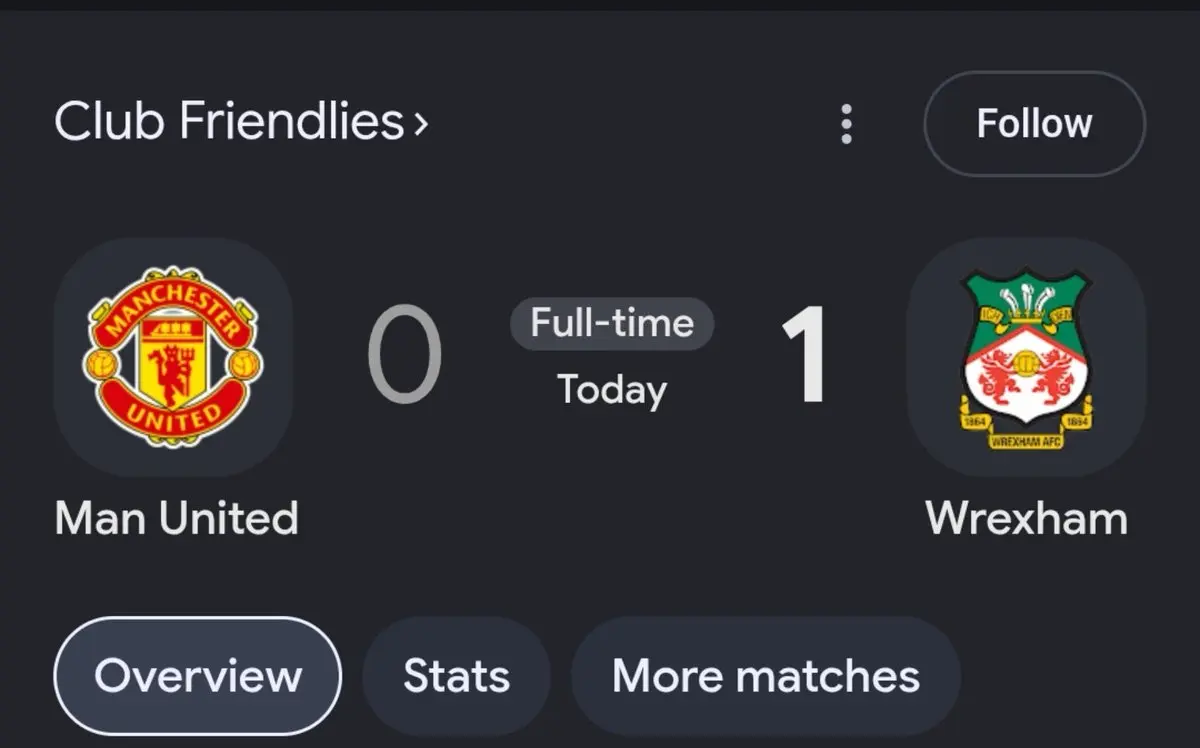
Manchester United, season never start oooo
post-image
  • Reward
  • Comment
  • Repost
  • Share
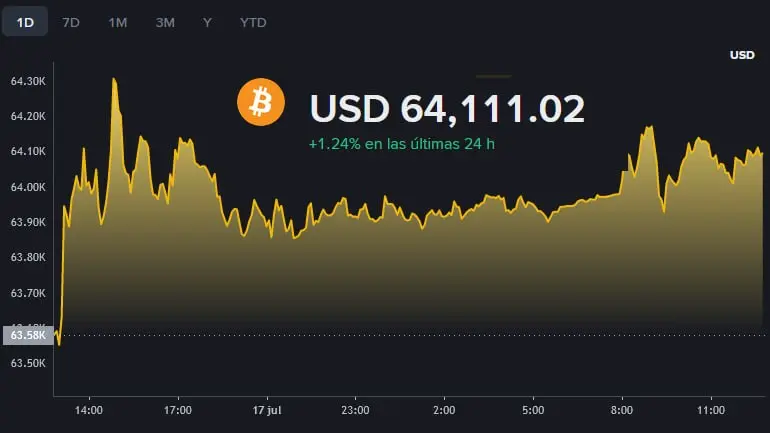
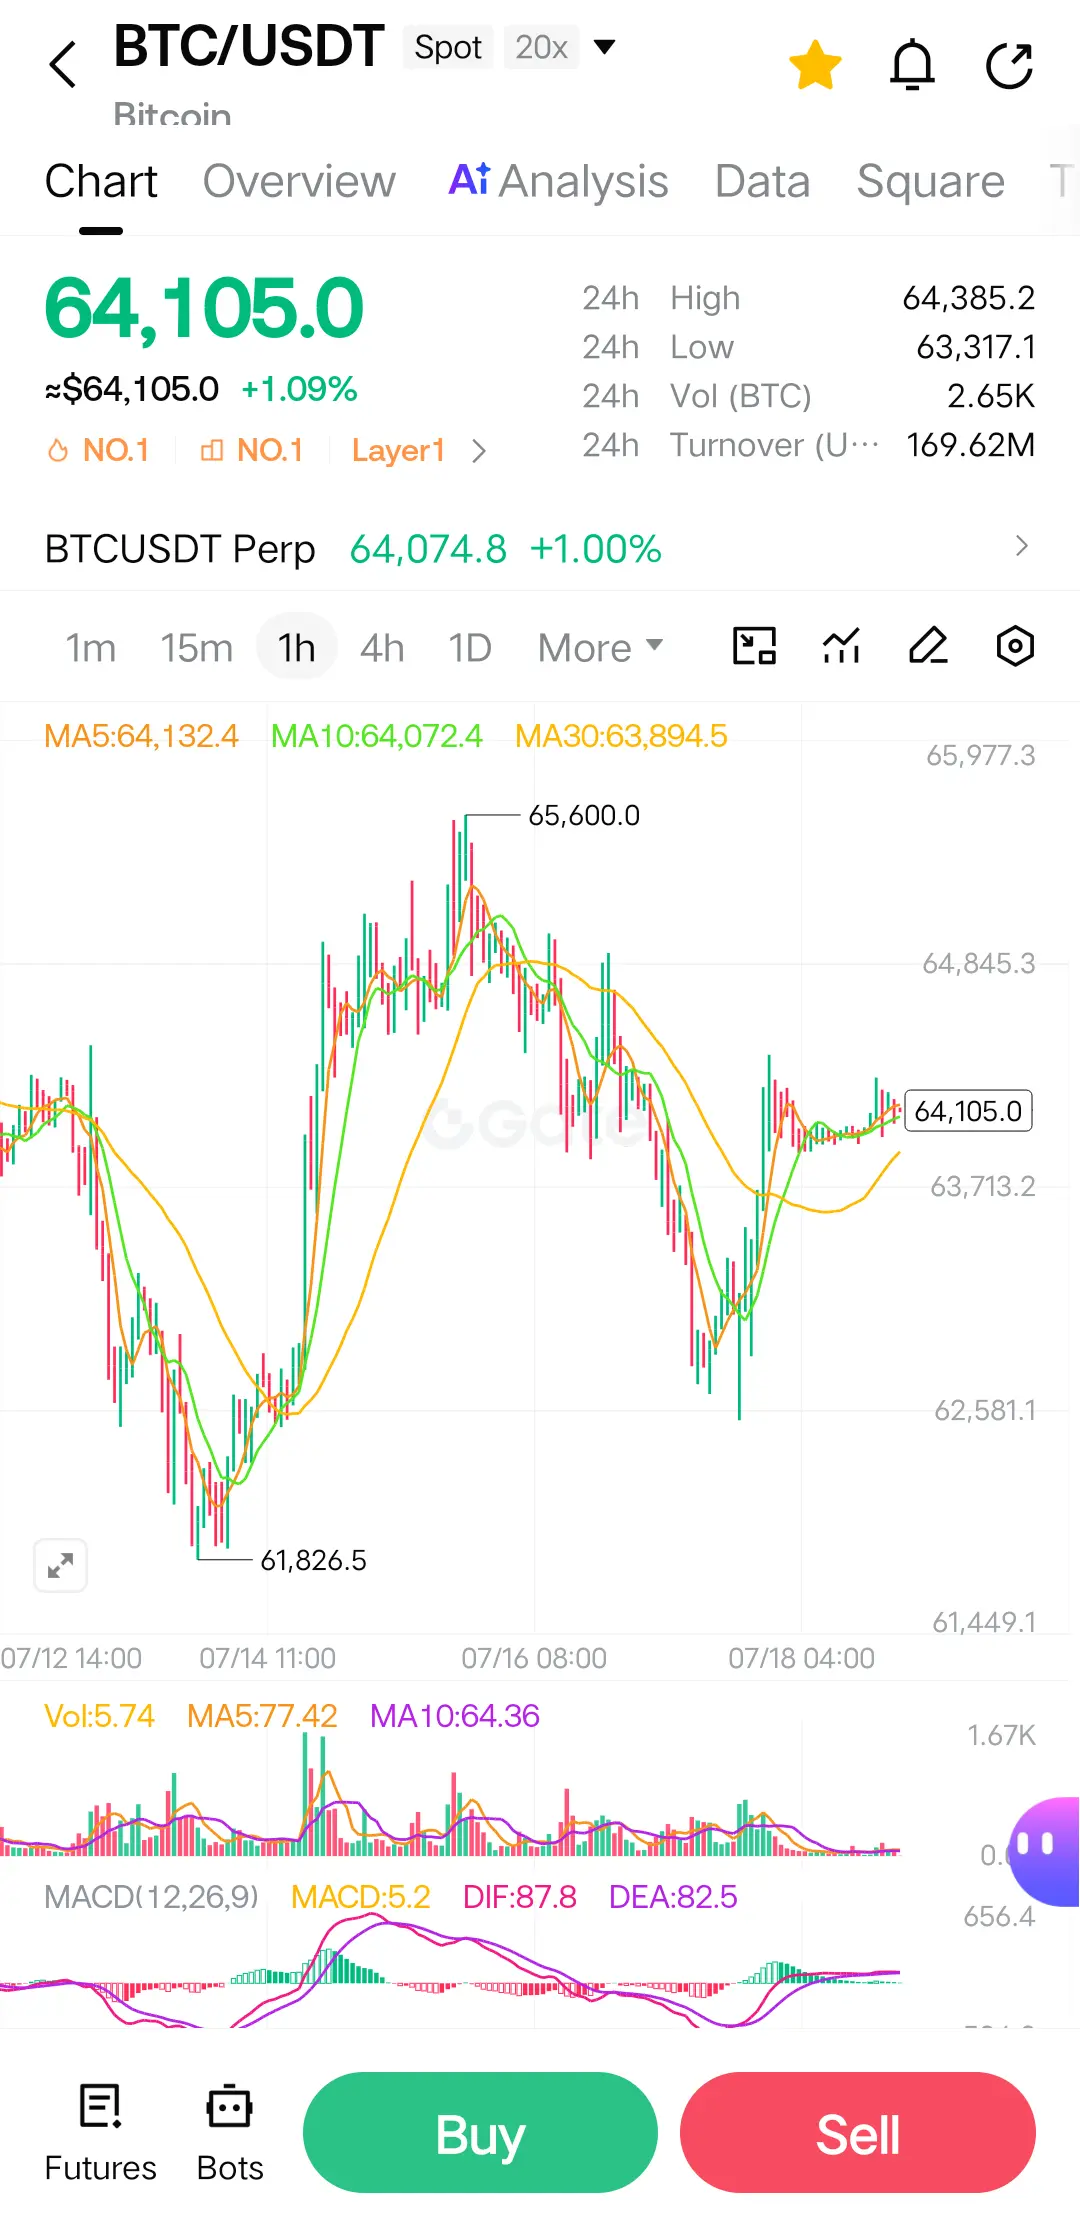
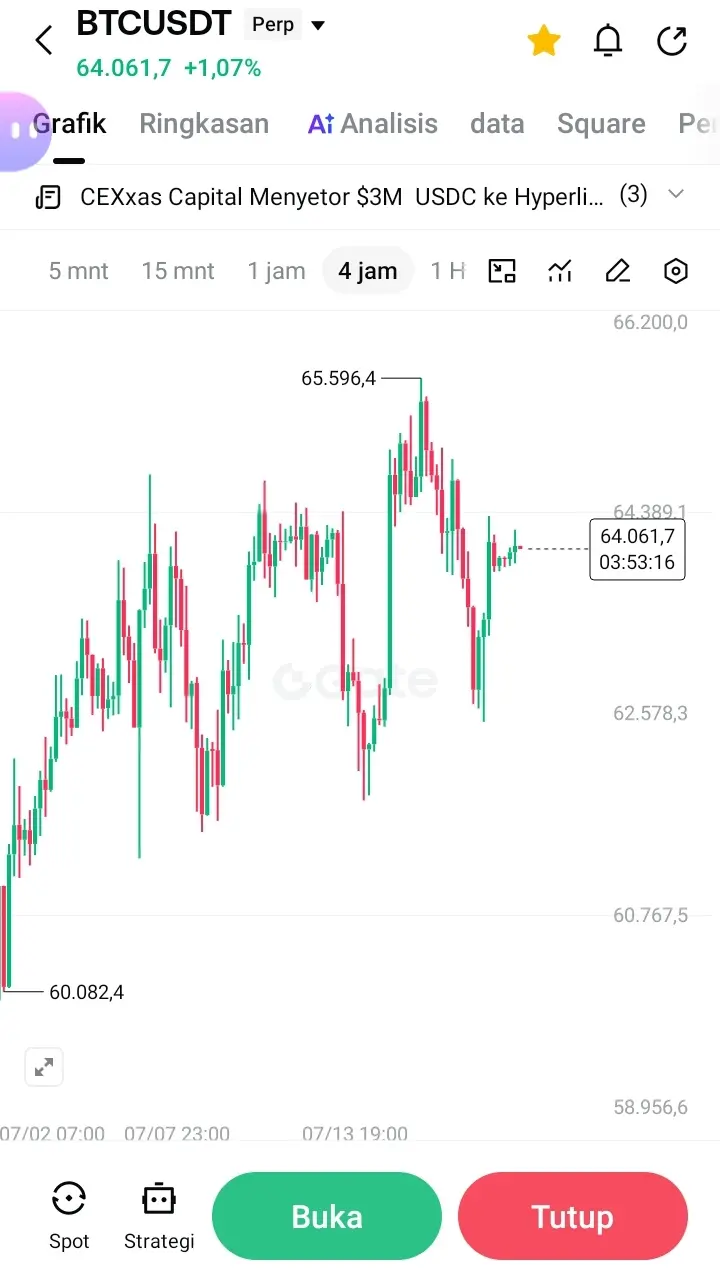
📈 Bitcoin is back near $64K.
The key levels to watch:
1. Hold above $64K → $65.7K becomes likely.
2. Lose $64K → Monday could bring a deeper pullback.
3. Weekend moves often trap traders.
bitcoin:native
BTC0.42%
post-image
  • Reward
  • Comment
  • Repost
  • Share
Tonight’s CPI: Full Coverage · Analysis
gate liveLIVE
3,922
  • Reward
  • 4
  • Repost
  • Share
MSTF30:
2026 GOGOGO 👊
View More
🚨 WAIT... WAIT... STOP SCROLLING! 🚨
🔥 $BTC /USDT is holding strong! Bulls have reclaimed control above the SuperTrend, and buyers continue defending higher levels. A breakout above resistance could ignite the next rally. Don't FOMO—trade the confirmation! 📈
🚸 BTC/USDT 🔰 LEVERAGE: 1X–20X
🚀 LONG
✅ ENTRY: $64,000 – $64,120
🎯 TARGETS 1️⃣ $64,350 2️⃣ $64,650 3️⃣ $65,000 4️⃣ $65,500
🛑 STOP LOSS: $63,780
📊 Market Snapshot 💰 Current Price: $64,106.04 📈 24H Change: +1.09% 🚀 24H High: $64,387.99 📉 24H Low: $63,312.01
⚡ Key Level: A sustained move above $64,400 could accelerate bullish mome
BTC0.41%
post-image
  • Reward
  • Comment
  • Repost
  • Share
Abraxas Capital boosts shorts, depositing 3M USDC into Hyperliquid and dialing BTC and ETH short exposure higher. [no ticker] $BTC $ETH
HYPE-1.81%
BTC0.41%
ETH-0.14%
post-image
  • Reward
  • Comment
  • Repost
  • Share
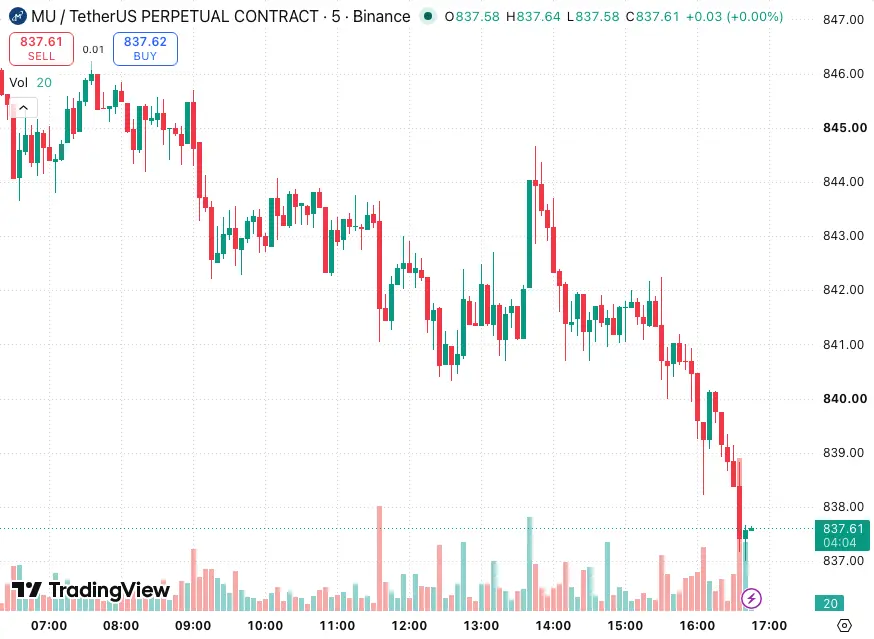
$MU Keep shorting. Right now, everyone across the market is shouting “buy the dip”—and at this point, it could very well be a trap. Sell-side pressure has already started to build. The 4-hour short structure is still intact, and the daily price has been clearly rejected in the range of 838.38 to 839.13. The 15-minute RSI is currently around 30—if the bears can hold, there may still be room for further downside. Although the 15-minute volume is only about 0.47x of expectations, the real sell pressure has already shown up. I think you can watch for short opportunities in the 838.38 to 839.13 ar
MU-6.45%
View Original
post-image
  • Reward
  • Comment
  • Repost
  • Share
🚀 Gate DEX Integrates With Robinhood Chain: A New Step for On-Chain Trading
The integration of Gate DEX with Robinhood Chain marks an interesting development in the growing connection between centralized crypto platforms, decentralized exchanges, and blockchain ecosystems.
As the crypto industry continues to evolve, interoperability is becoming increasingly important. Users want faster access to more assets, deeper liquidity, and smoother trading experiences across different networks.
This integration could help bring more attention to on-chain trading and expand the potential reach of the Ro
MULTI1.43%
ETH-0.14%
SOL-0.22%
BNB0.83%
post-image
post-image
  • Reward
  • Comment
  • Repost
  • Share
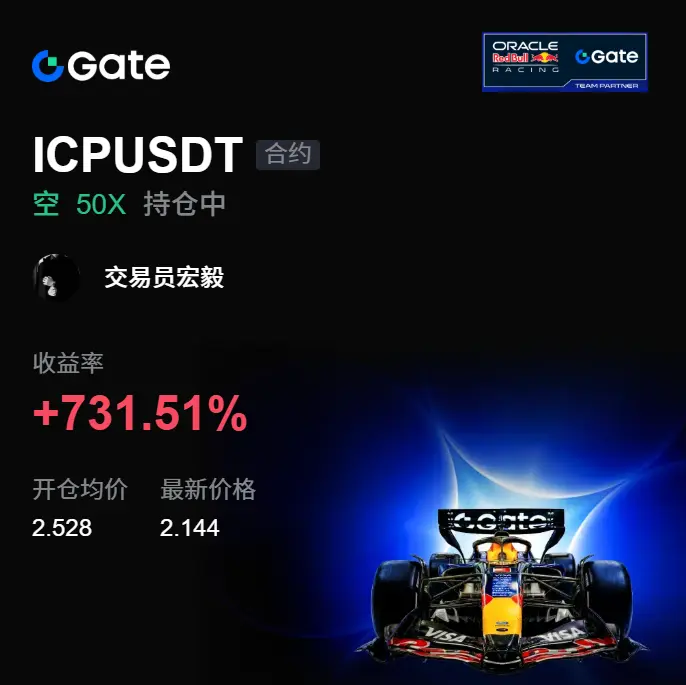
The hardest part of the chart isn’t that it fell—it's that before it dropped, it was acting especially like it was about to break out. $ICP A few days ago it churned back and forth near the highs. A lot of people got swept up by those few upward thrusts, but I wasn’t watching the size of the move—I was watching whether anyone would step in to take it after it surged. The answer was obvious: nobody did.
The key is right here: after ICP hit around 2.528, every time price probed upward, it got pushed back down. As a result, the rebound strength kept weakening, and at this level I’d rather stand
ICP-0.37%
BTC0.41%
ETH-0.14%
View Original
post-image
  • Reward
  • Comment
  • Repost
  • Share
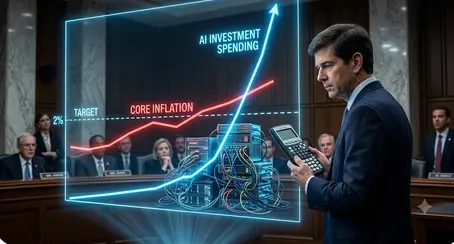
#WarshSaysFedDecidesIfAIInflation
The Fed's AI Dilemma: When Technology Becomes Monetary Policy
Kevin Warsh walked into the Senate Banking Committee this week carrying a paradox that's keeping every central banker awake at night. The man tasked with taming inflation just admitted that the biggest investment boom in modern history artificial intelligence will push prices higher. But here's the twist: he doesn't think it counts as inflation. At least, not yet.
The distinction matters more than most people realize. When Warsh told senators that AI-driven investment is "the most striking feature"
post-image
post-image
  • Reward
  • Comment
  • Repost
  • Share
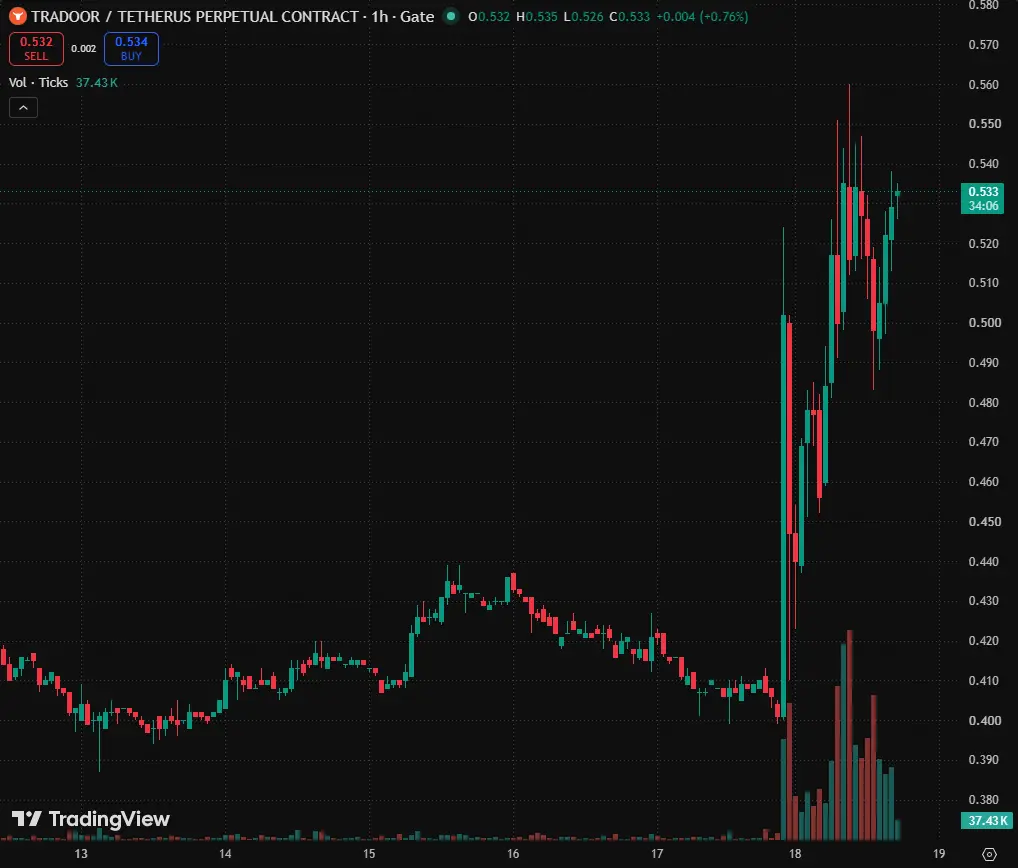
$TRADOOR | 1h | Short Setup
Bias: Short
Entry Zone: 0.528 to 0.538
Stop Loss: 0.546
Targets:
TP1: 0.512
TP2: 0.498
TP3: 0.486
Invalidation:
Close above 0.546
Why This Setup:
I’m shorting into a strong impulse move that is stalling under the recent high. Price has already rejected the 0.54 area multiple times, and I’m looking for a loss of momentum followed by a pullback toward the breakout support.
TRADOOR30.81%
post-image
  • Reward
  • Comment
  • Repost
  • Share
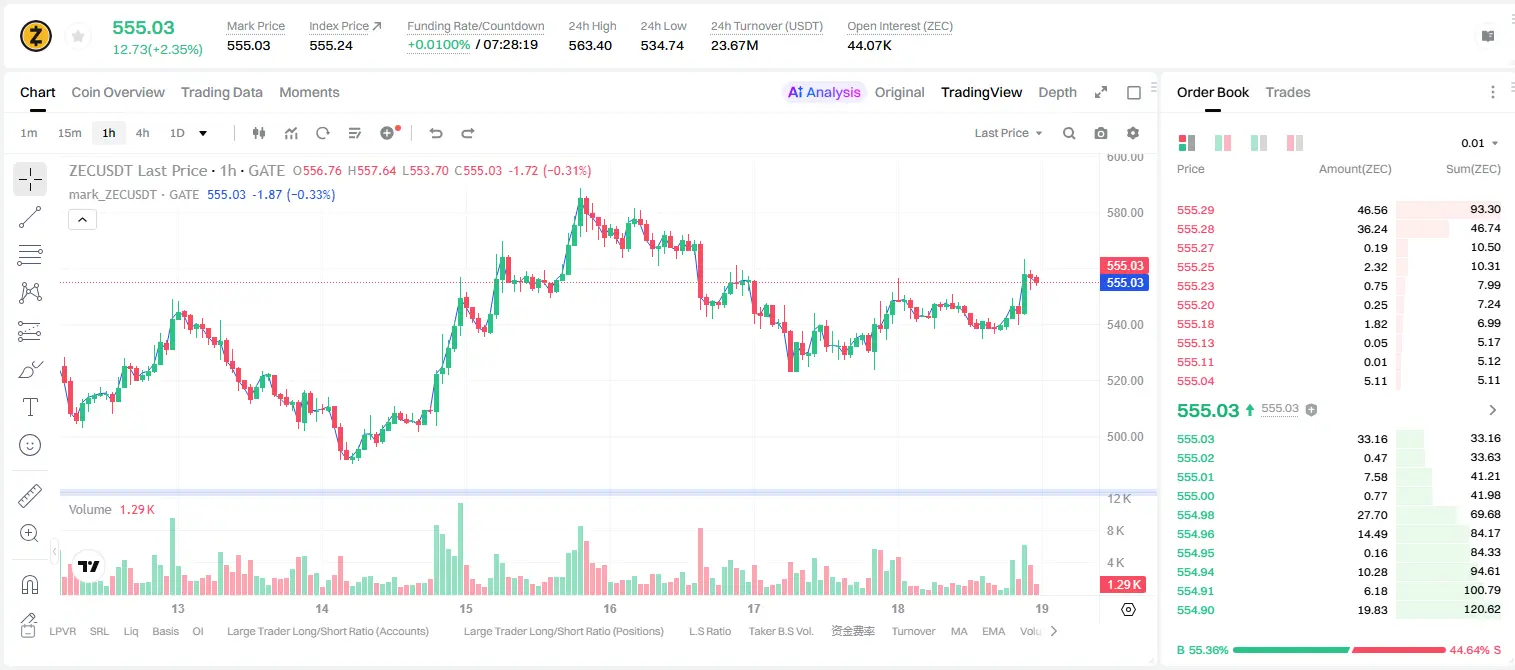
ZEC bulls have a 95% win rate—are you in?
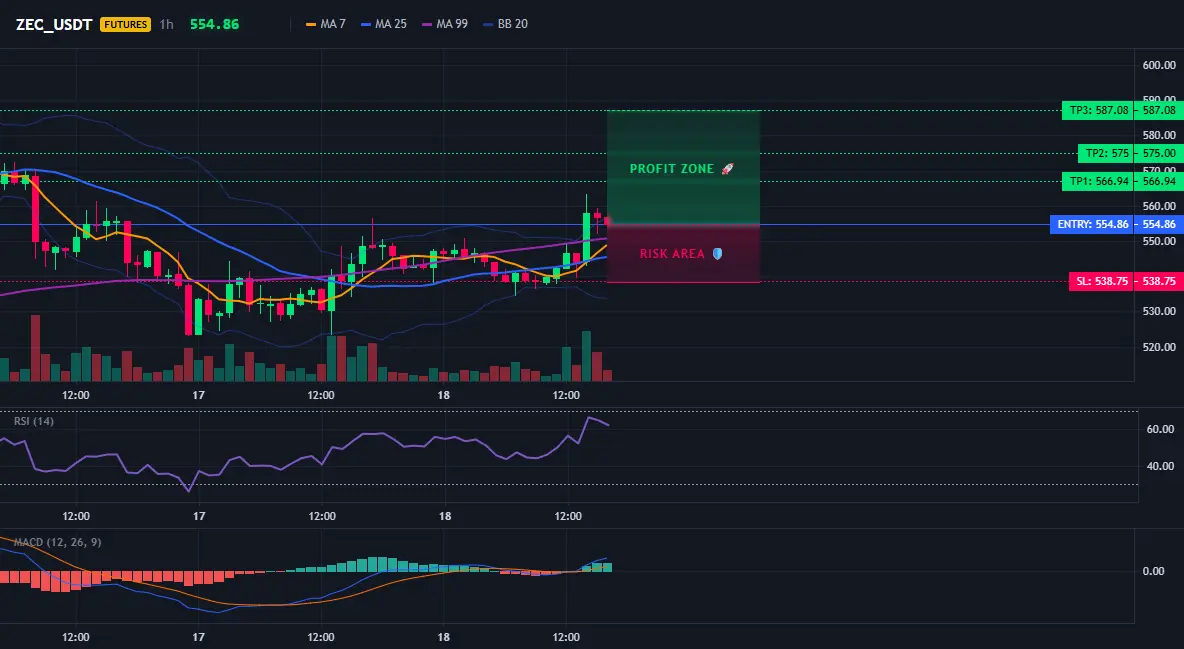
$ZEC /USDT - Go LONG
Trading plan:
Entry: 553.18 – 556.54
SL: 538.75
TP1: 566.94
TP2: 575.00
TP3: 587.08
Why watch this structure?
- The 1D trend is clearly bullish; the 4H signal is “Armed,” with an entry range of 553.18–556.54.
- RSI on 15m is 63.83, not overheated—still room to the upside; 1H ATR is only 6.7, with controllable volatility.
- Enter now: TP1 at 566.94 (+2.2%), TP2 at 575.00; stop-loss at 538.75 (-2.9%); risk-reward is excellent.
- Why now? The signal is confirmed, the trend hasn’t weakened—waiting will only make you miss the best entry
ZEC-0.10%
View Original
post-image
post-image
  • Reward
  • Comment
  • Repost
  • Share
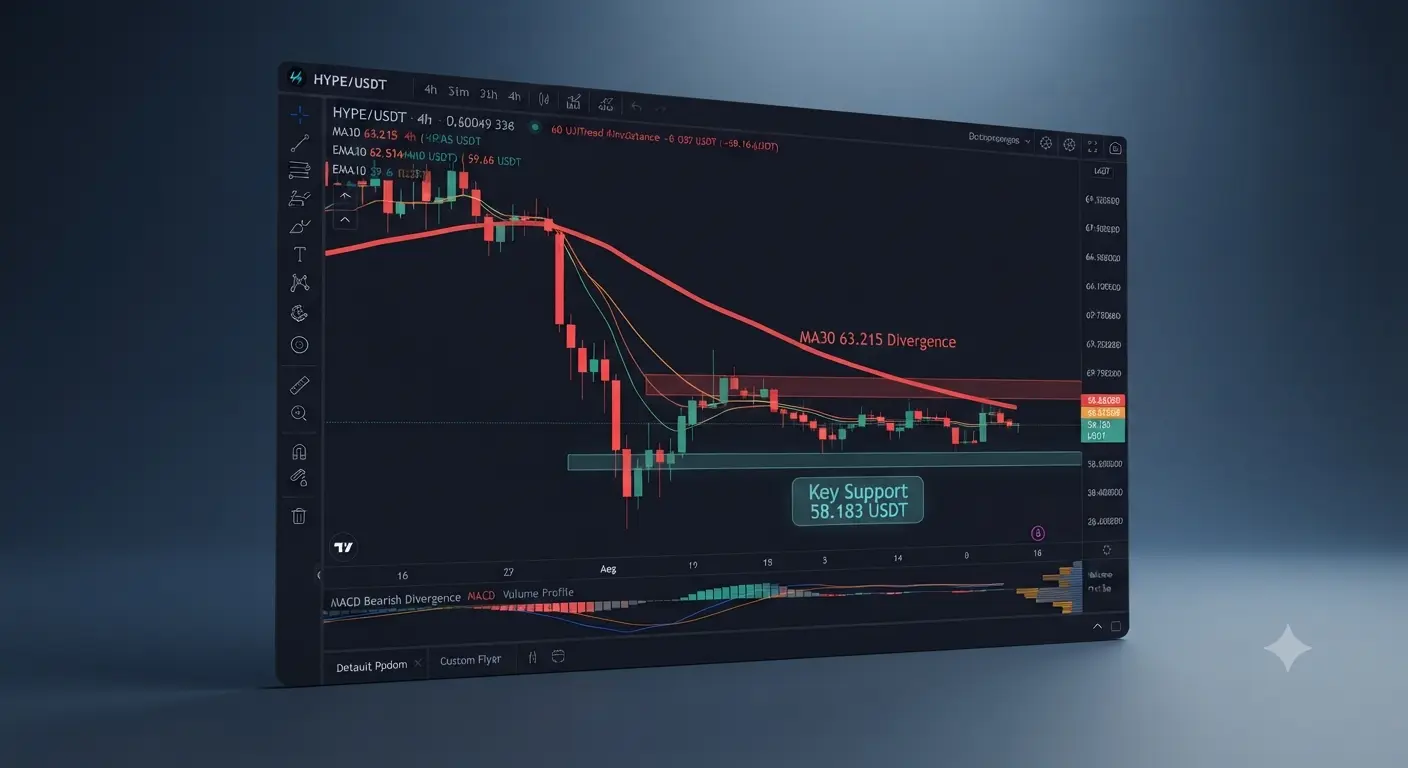
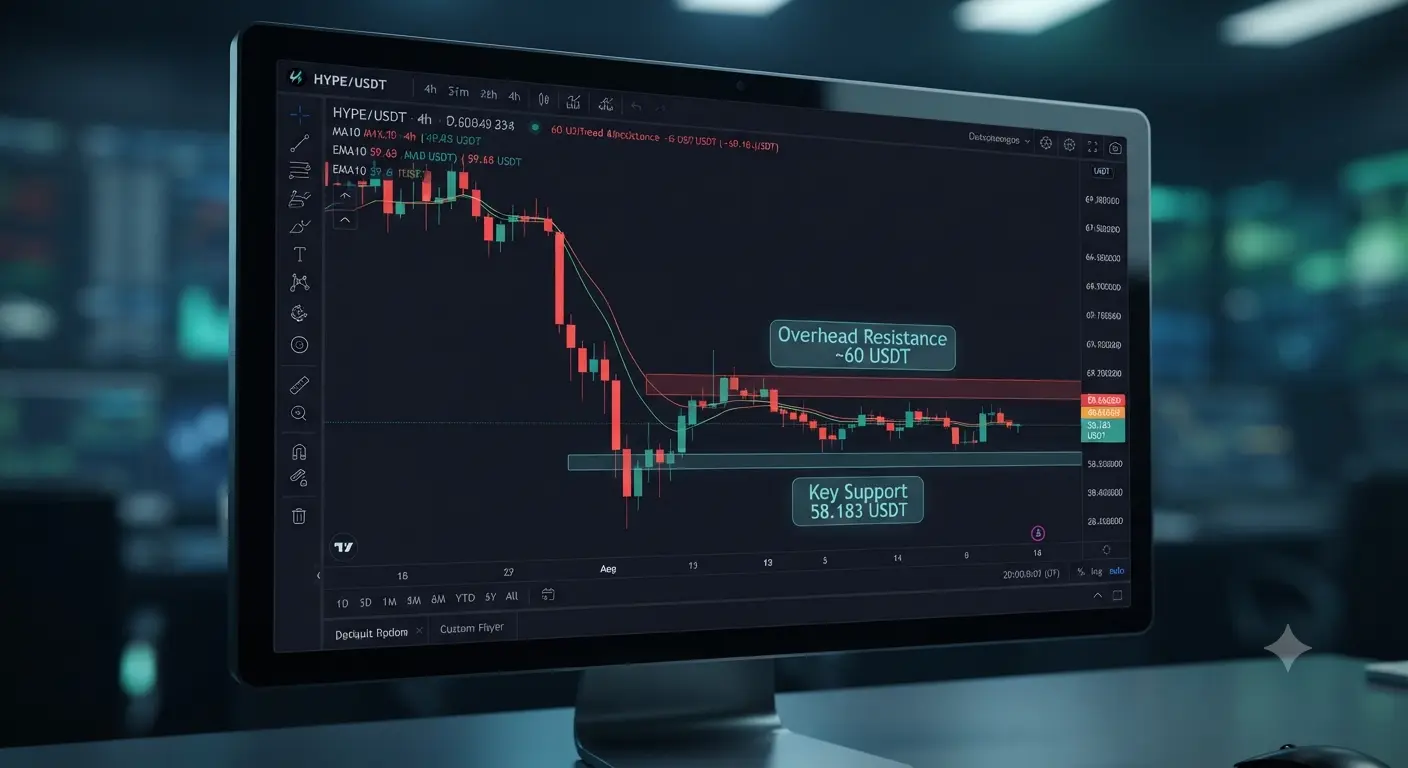
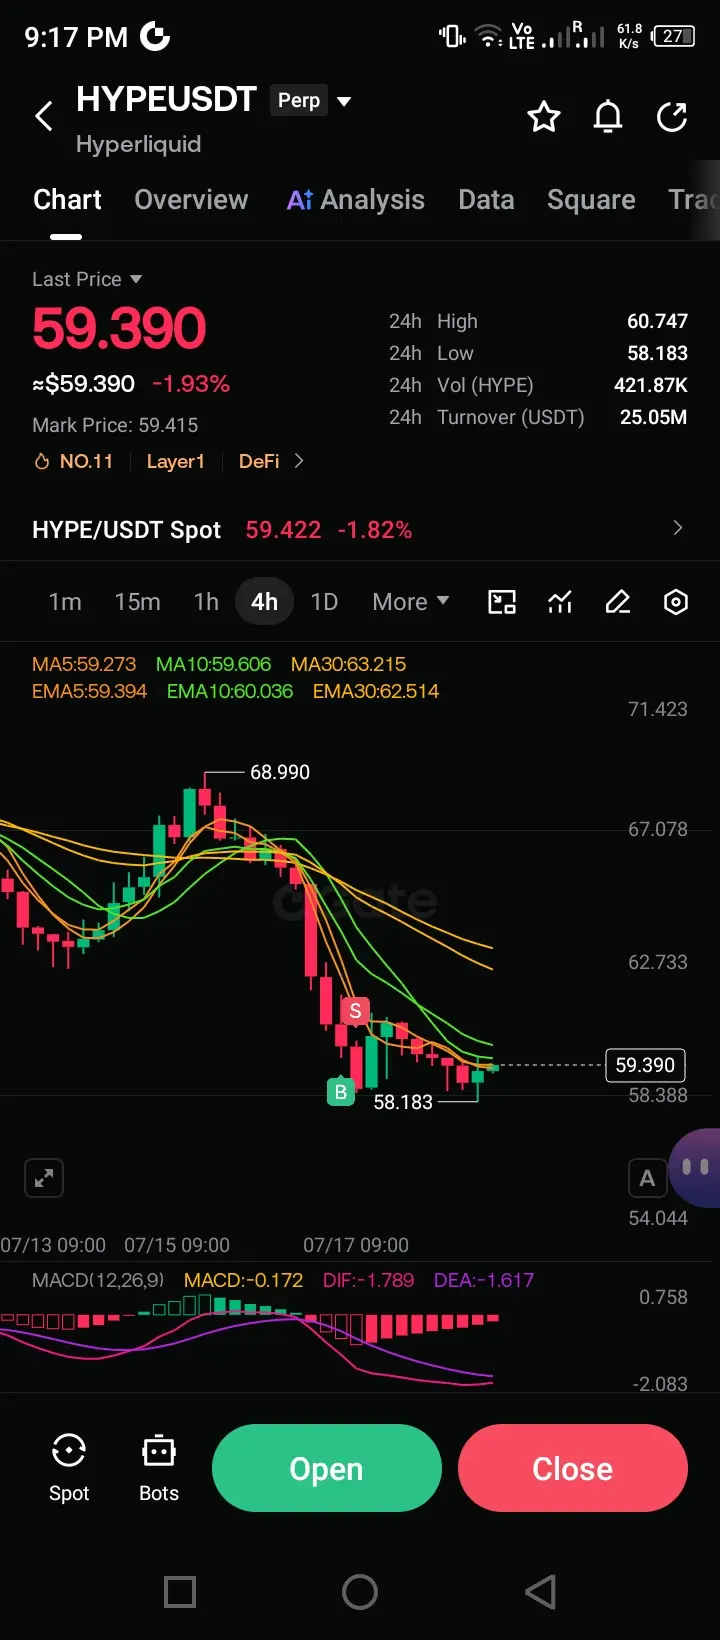
HYPE/USDT Under Pressure, Is a Recovery Beginning or Is More Downside Ahead? A Professional 4H Market Analysis
Market Update (18 July 2026)
HYPE/USDT is trading near 59.390 USDT on the 4-hour timeframe, according to the provided Gate.io chart. The market remains under pressure following a strong decline from the recent swing high around 68.990 USDT. Although selling pressure has dominated the trend, recent candles indicate that buyers are attempting to defend the lows around 58.183 USDT. At the time reflected in the screenshot, price is moving within a relatively narrow range after a sharp dec
post-image
post-image
post-image
  • Reward
  • 4
  • Repost
  • Share
BlurHunter:
Every time I see these long-winded analyses, I get a headache. One sentence: if it’s fallen a lot, it’s an opportunity—but don’t rush to bottom-pick.
View More
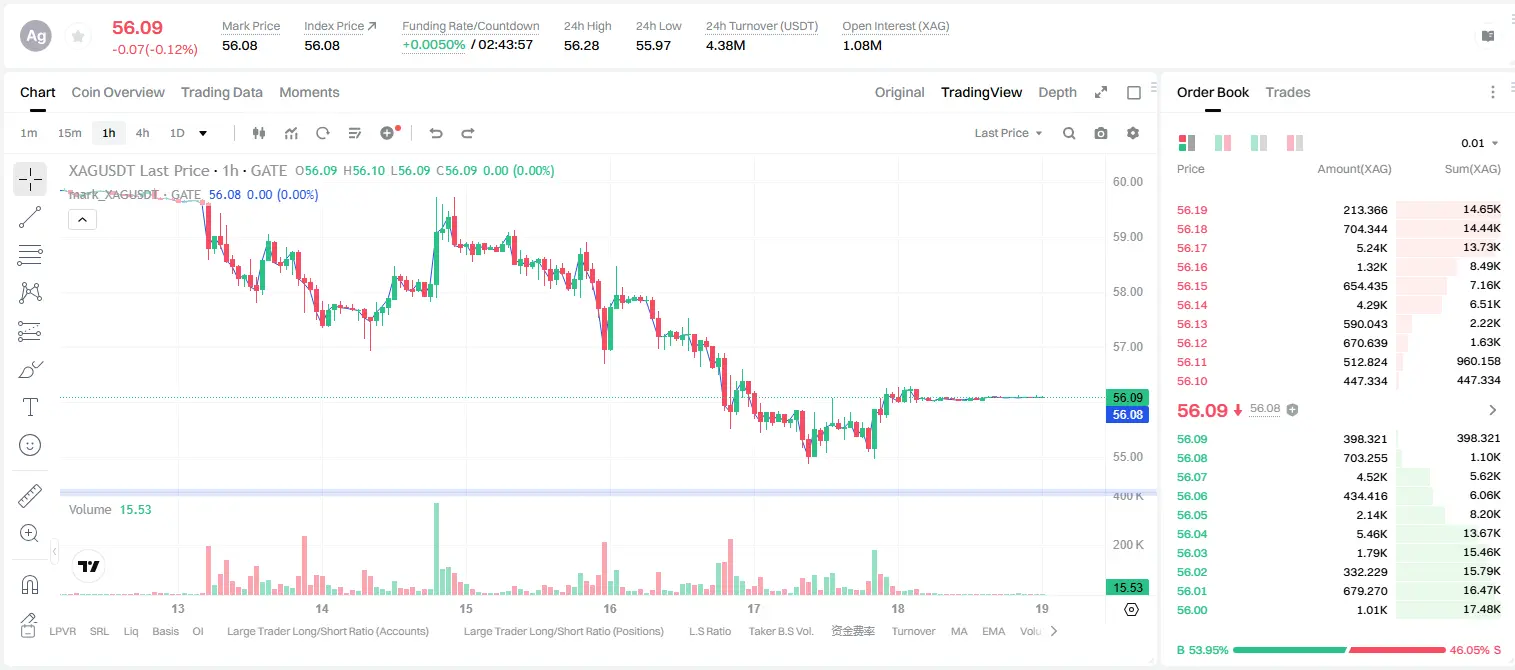
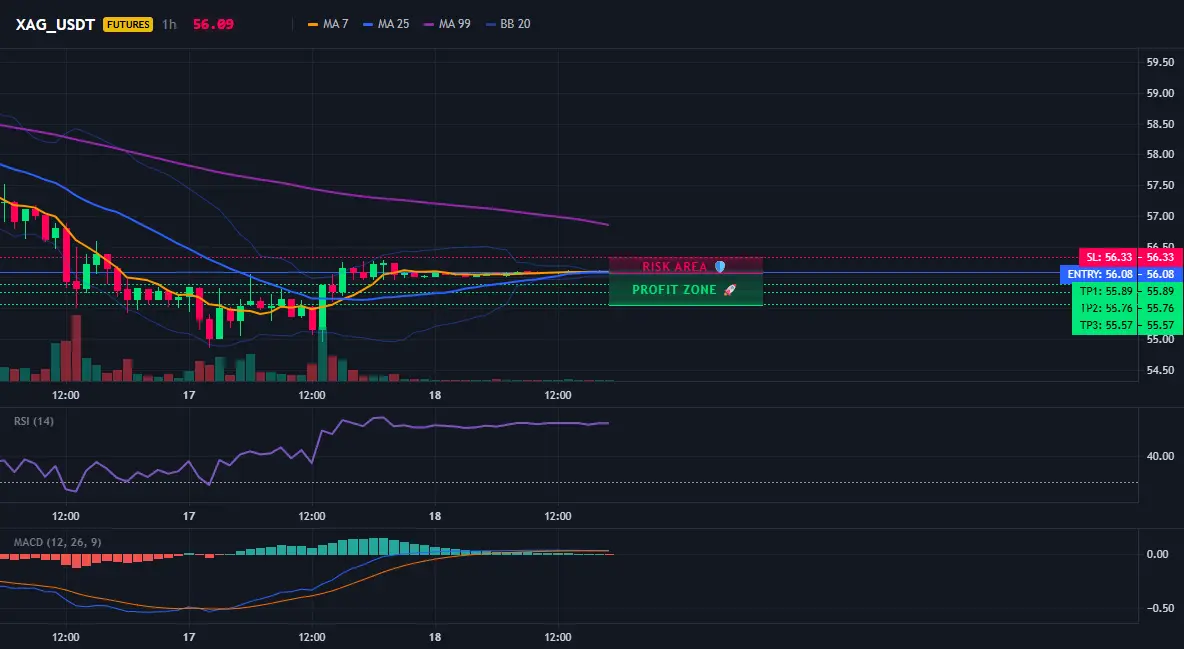
Silver $XAG /USDT at 56.08—is this a bull-trap for a long entry, or a true breakdown confirmation?
XAG_USDT - SHORT
Trading plan:
Entry: 56.05 – 56.11
SL: 56.33
TP1: 55.89
TP2: 55.76
TP3: 55.57
Why focus on this structure?
- 4-hour SHORT signal, confidence 55.4%, not high but worth trying-and-error
- 1-day trend is range-bound; current 56.08 is right near the EMA, RSI 15m 52.7 is not extreme
- Why now? The entry zone 56.05-56.11 is extremely narrow, and the stop loss is only 0.25%, with an attractive risk-reward ratio
- TP1 55.89, TP2 55.76—if it breaks down, selling pressure accelerates
XAG-0.12%
View Original
post-image
post-image
  • Reward
  • Comment
  • Repost
  • Share
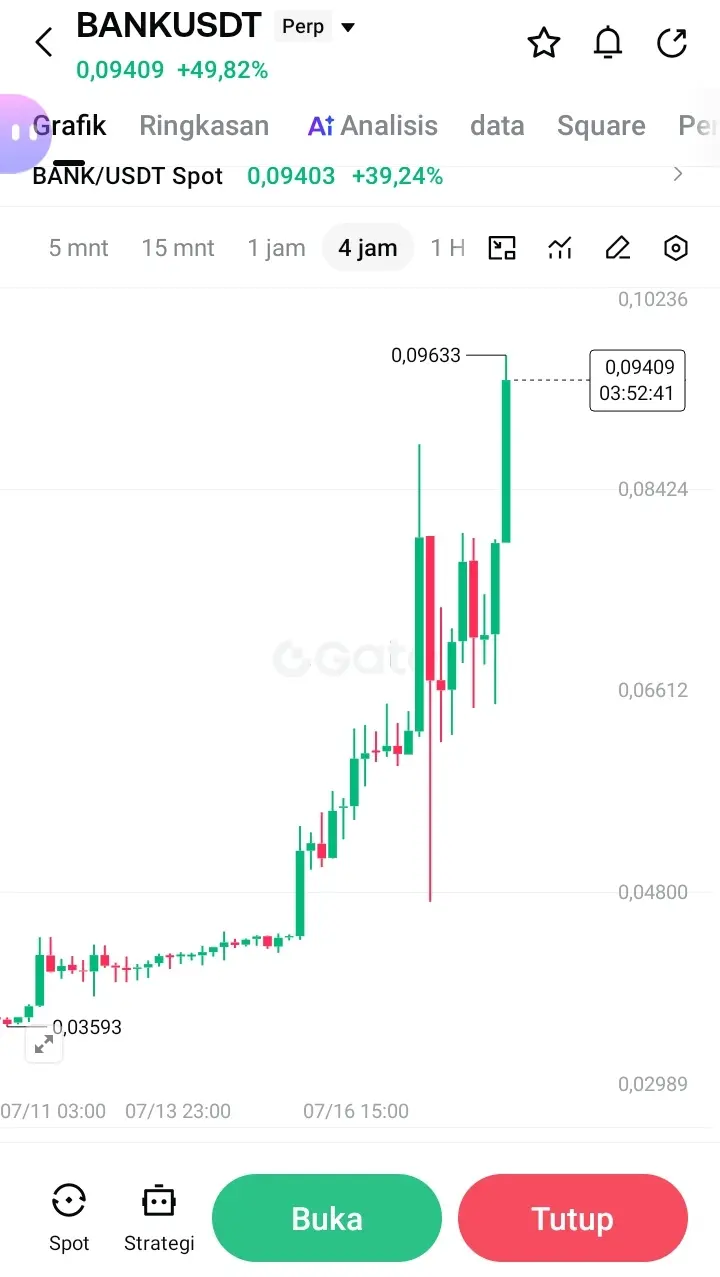
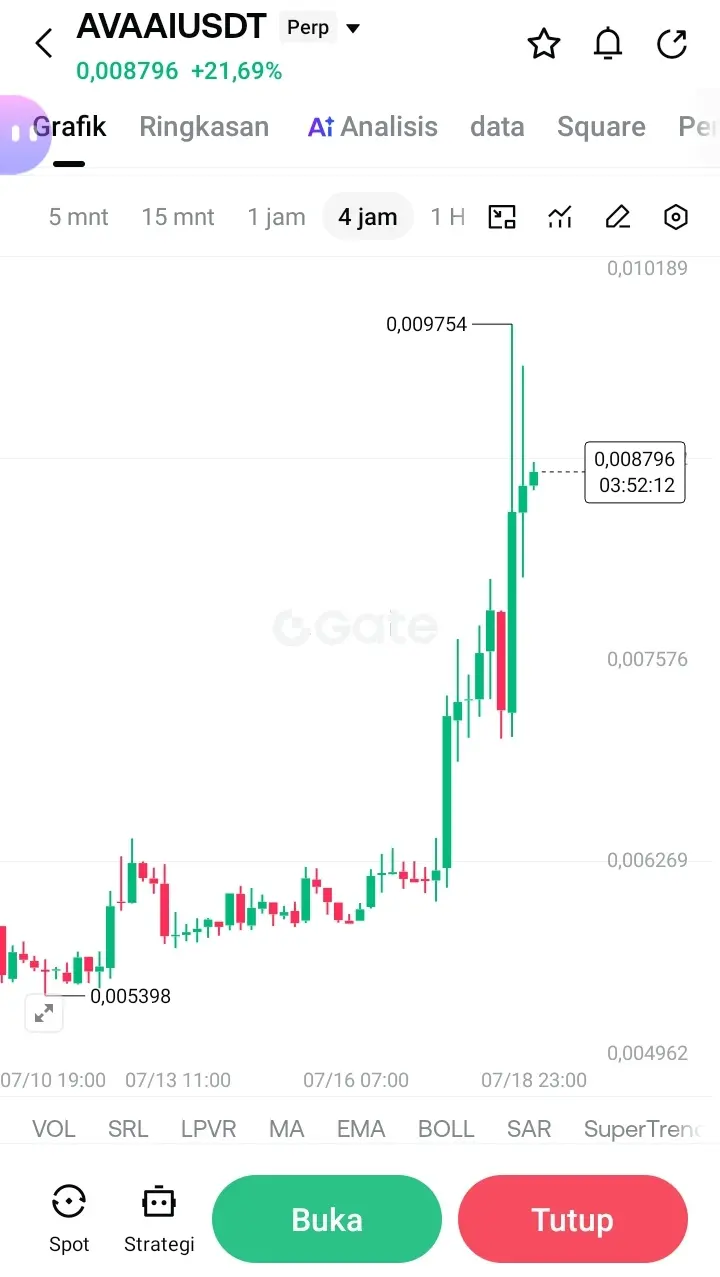
#ETHStandsAbove1900
🌍 Oil Price Rise Dominates the Main Headlines… But the Real Story Might Be Where the Next Flow of Capital Goes.
Markets often react first and think later. The latest oil price surge has triggered worries about inflation, central bank policy, and global growth. While many traders focus on the spike itself, experienced investors know that the bigger opportunities usually lie in understanding where liquidity moves after the initial reaction.
Higher energy prices can reshape expectations across every major asset class. Rising inflation concerns may support defensive assets li
BTC0.41%
BANK51.24%
AVAAI23.84%
View Original
post-image
post-image
post-image
  • Reward
  • Comment
  • Repost
  • Share
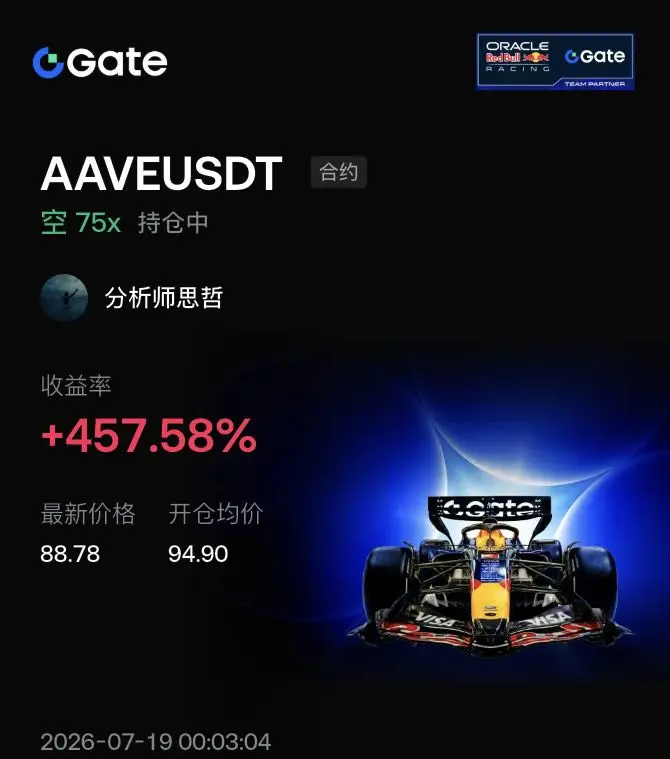
Oh my, $AAVE as expected—it slid down on schedule. Back around the 94.90 level, the order book had already shown clear signs of weakness. The buy side tried to push up, but it was especially feeble. The main force completely didn’t support the market; sell pressure came wave after wave. I immediately reminded everyone in the base camp to set up short positions.
Now the price is down to 88.78, and overall profits are up 457.58%!
If you’ve already entered, remember to lock in most of your profits first—taking profit of 70% is the safer move. Hold the remaining position to keep betting on a furt
AAVE-2.71%
BTC0.41%
ETH-0.14%
View Original
post-image
  • Reward
  • Comment
  • Repost
  • Share
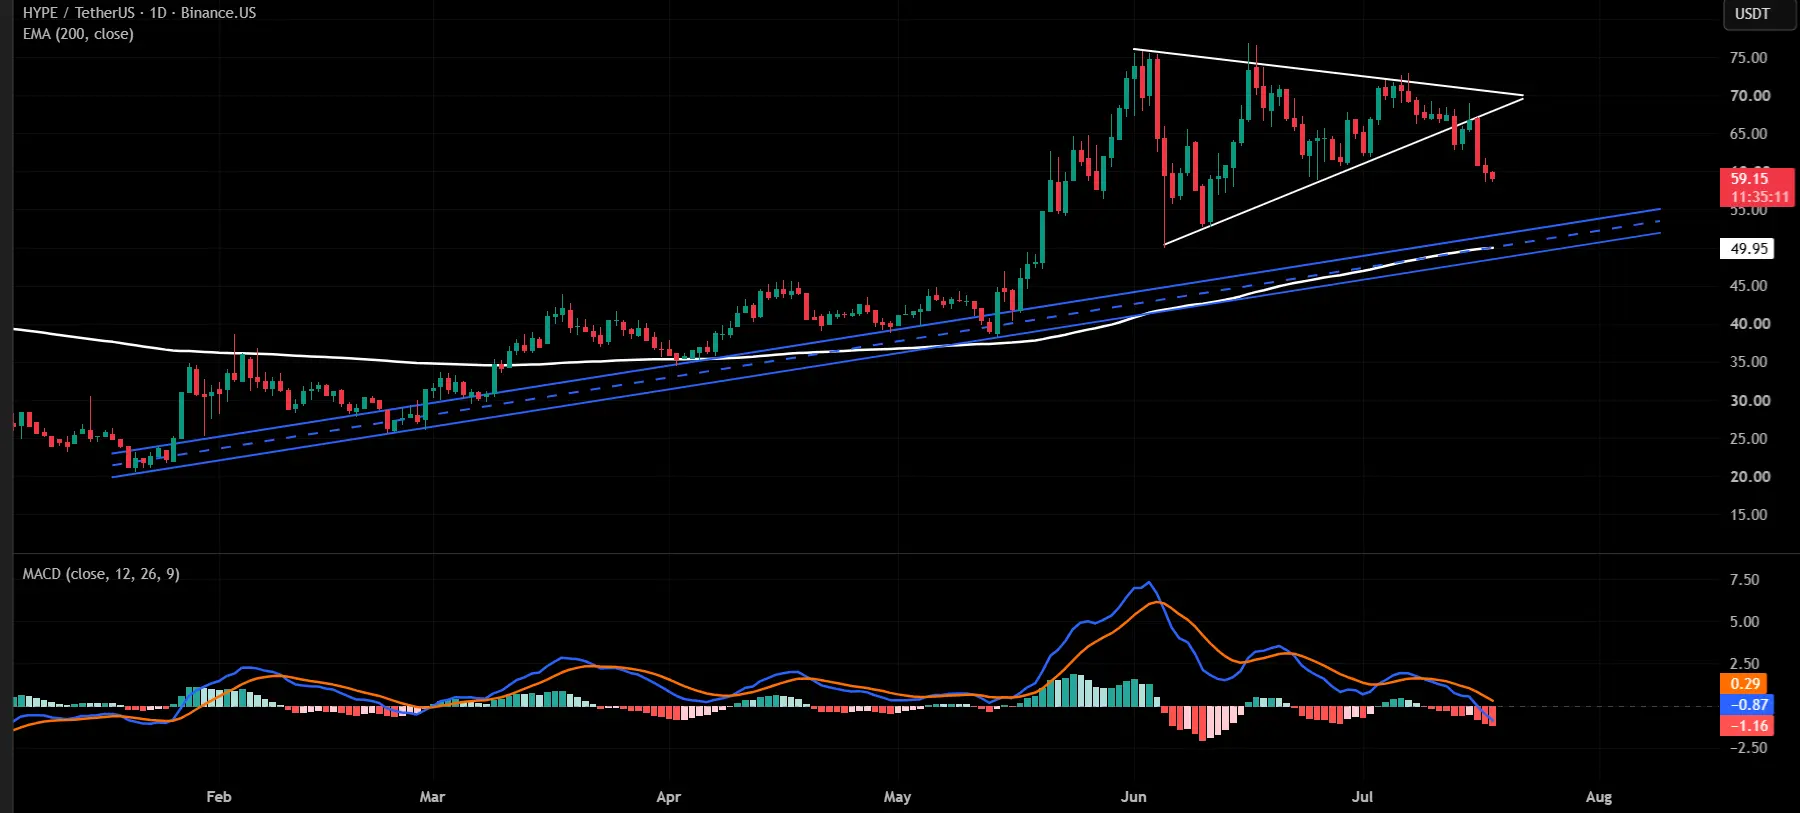
$HYPE ‌ has officially broken its bullish market structure.
Momentum is weakening, while the higher timeframe support zone is still below current price.
The first major area to watch is around $50.
That's where the ascending trendline meets the 200 EMA, creating a potential confluence zone for buyers.
If the decline continues, this could be the first area where meaningful demand appears.
#PreIPOsSeason2OpenAISubscription
#GateDEXIntegratesWithRobinhoodChain
HYPE-1.81%
post-image
  • Reward
  • 3
  • Repost
  • Share
KeykeeperK:
From the chart/market display, HYPE’s rally structure has already broken, and momentum is also fading. However, near the $50 level below, there is a resonance support where a trendline and the 200EMA meet, which may draw in buyers. But if it breaks down, be careful—there could be an even deeper pullback. It’s recommended to wait and observe first, and only enter after stabilization is confirmed.
View More
[New Streemer] Bitcoin Price Prediction
gate liveLIVE
738
  • Reward
  • Comment
  • Repost
  • Share
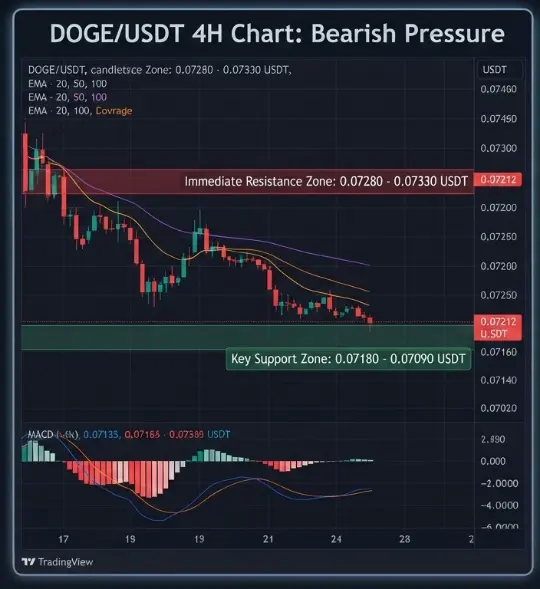
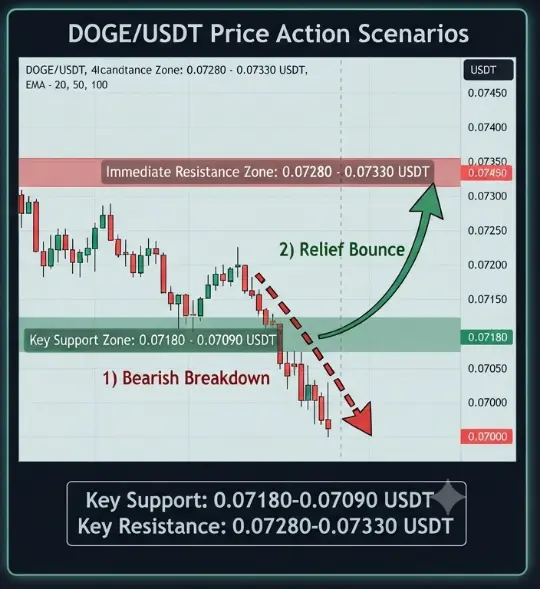
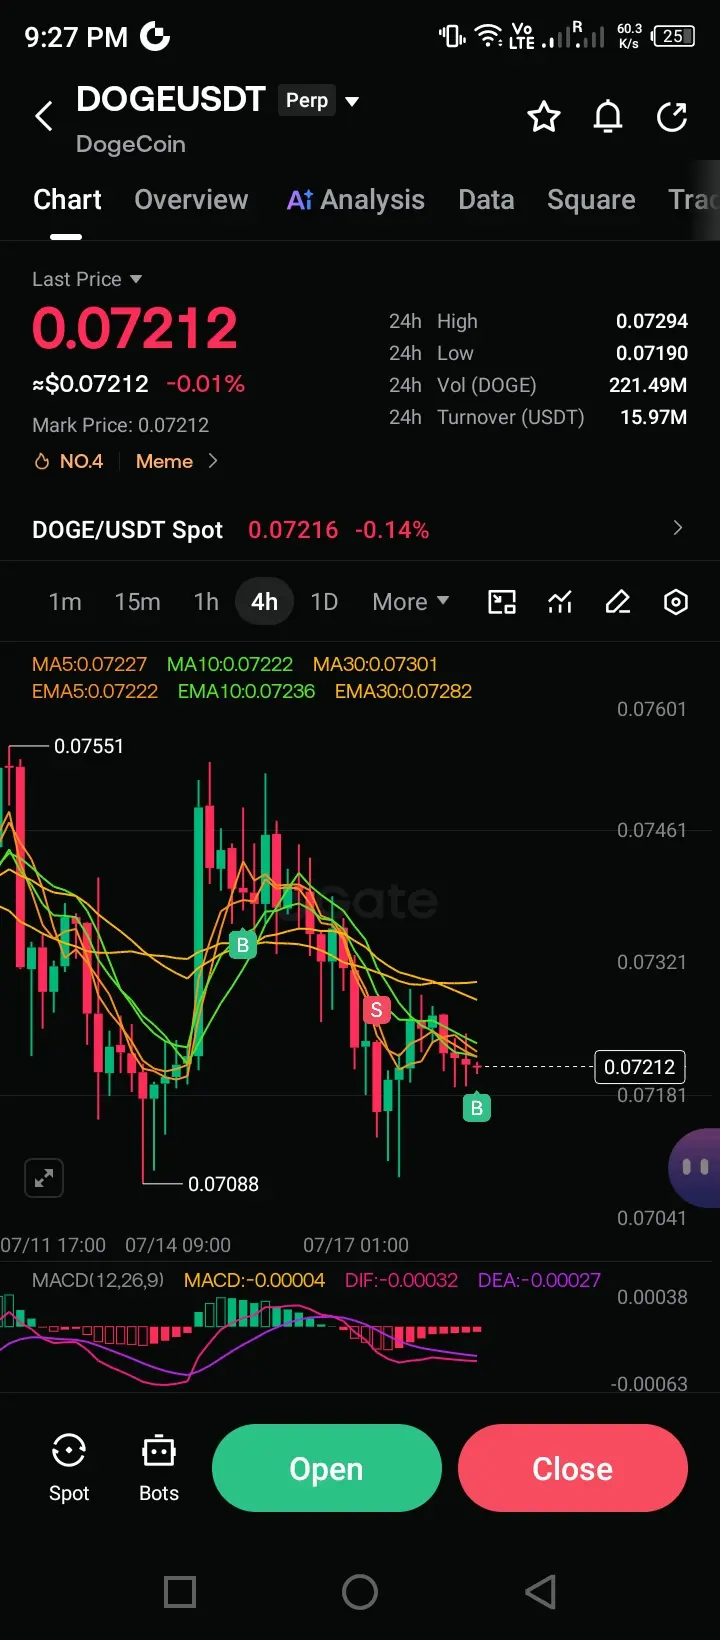
DOGE/USDT Market Update, Bears Still Hold the Short Term Trend
Dogecoin is currently trading around 0.07212 USDT on the 4 hour timeframe, showing continued weakness after failing to hold above recent resistance. Price remains below the major moving averages, indicating that sellers still have the upper hand. The MACD also remains in bearish territory, suggesting that downside momentum has not completely faded.
The most important support zone is around 0.07180 to 0.07090. If this area breaks with strong selling volume, DOGE could extend its decline toward 0.07000 or even lower. On the upside, b
DOGE-0.75%
BTC0.42%
post-image
post-image
post-image
  • Reward
  • 6
  • Repost
  • Share
OnChainDrifter:
With such an obvious bearish trend and the MACD still in a dead-cross area, hard-holding long positions is just handing over money, bro.
View More
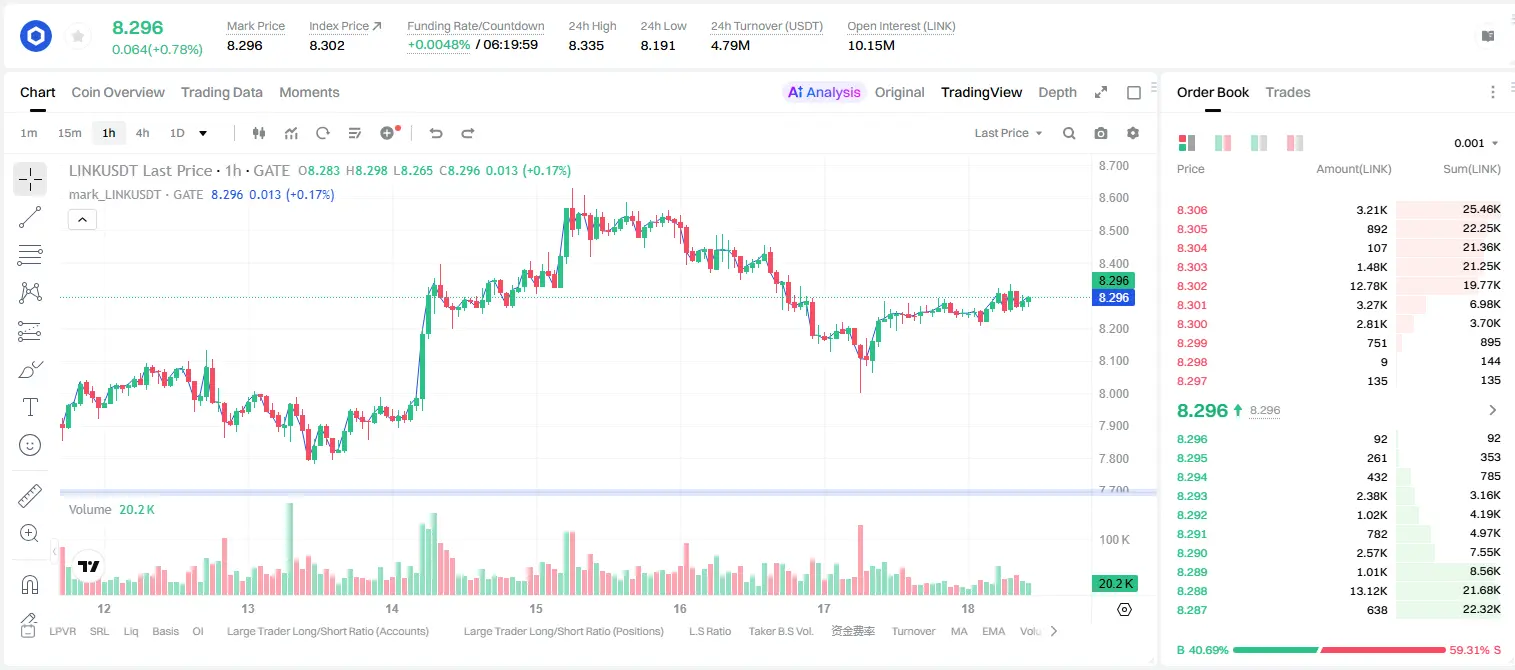
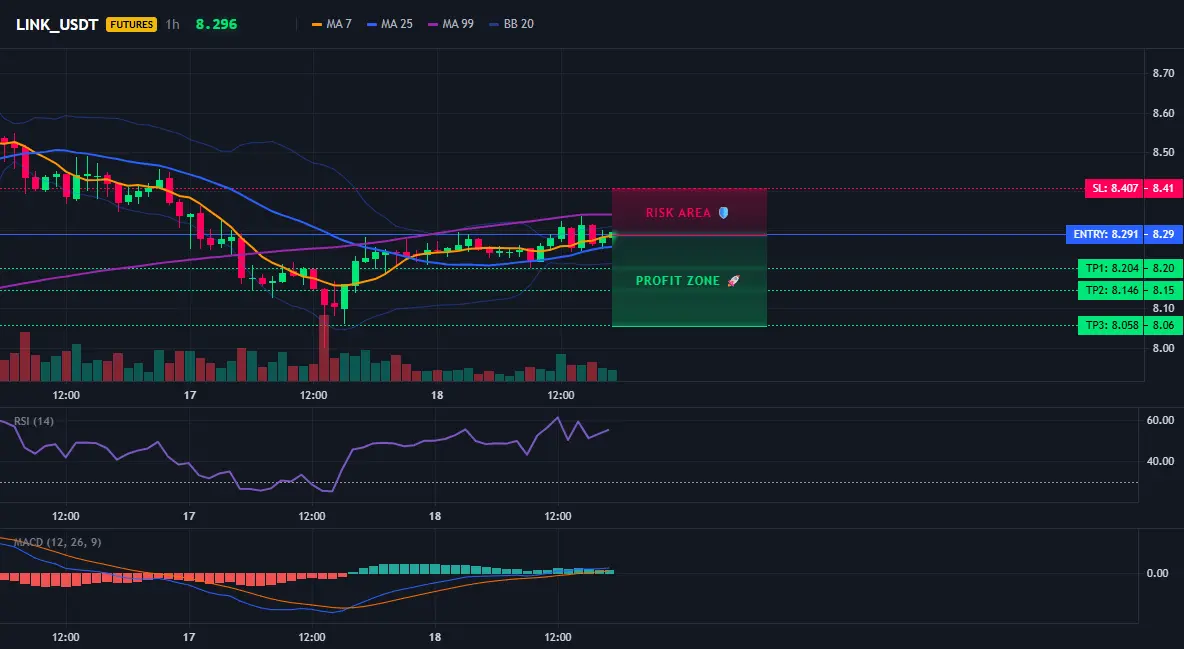
LINK Longs are lying in wait at 8.291, but 4H-level signals are calling it bearish?
$LINK /USDT - SHORT sell
Trading plan:
Entry: 8.279 – 8.303
SL: 8.407
TP1: 8.204
TP2: 8.146
TP3: 8.058
Why focus on this structure?
- The daily indicates a range-bound chop, but the 4H direction is clearly bearish, with the bulls-bears divide widening.
- The 1H reference price is 8.291; RSI (15M) is only 56.08, with insufficient rebound momentum.
- Price is currently in a tight range of 8.279–8.303, waiting for breakout confirmation.
- Why now? The short TP1 is at 8.204, just 1% from the current price, with a h
LINK0.25%
View Original
post-image
post-image
  • Reward
  • Comment
  • Repost
  • Share
Load More

Join 40 M users in our growing community

⚡️ Join 40 M users in the crypto craze discussion
💬 Engage with your favorite top creators
👍 See what interests you
  • Pinned