


134Ceros
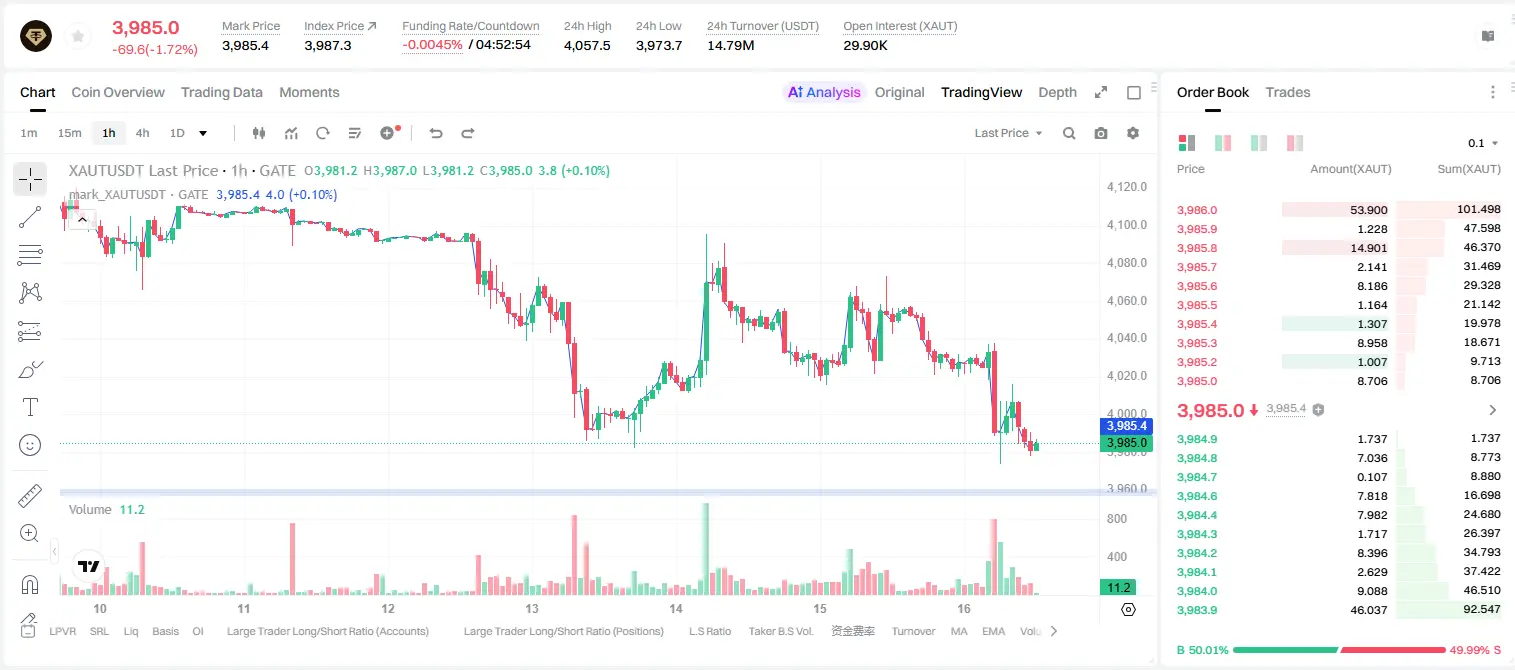
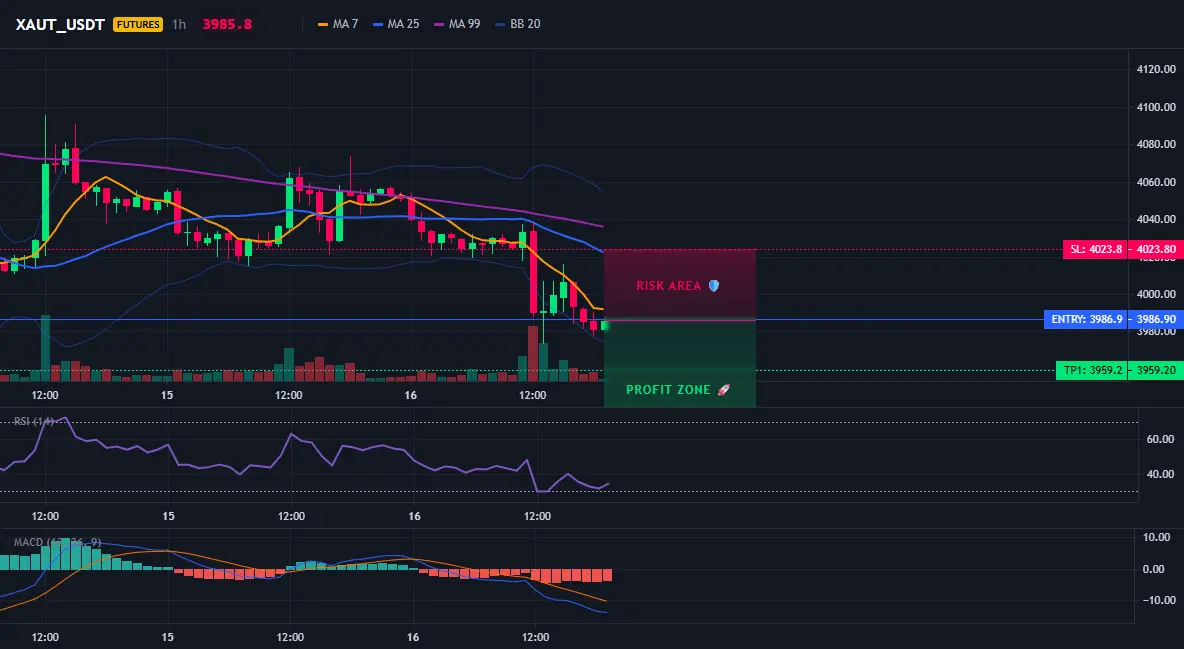
XAUTの4時間のショート罠がちょうど設置されたよ、君はやるの?
$XAUT /USDT - 売り(SHORT)
取引計画:
エントリー: 3983.1 – 3990.7
SL: 4023.8
TP1: 3959.2
TP2: 3940.8
TP3: 3913.2
なぜこの構造に注目するの?
- 4時間足のショートシグナルで、確信度95%、1Dのトレンドは明確に下落。
- 現在値3986.9はエントリーエリア付近で、RSI(15分足)は42.92。弱さはあるが、売られ過ぎには未到達。
- ATR(1時間)は15.36で、ボラティリティは十分。TP1 3959.2はすぐそこ、TP2 3940.8には余地がある。
- なぜ今なの?ショートの勢いはまだ衰えておらず、EMAの抑制下での反発は即ショートポイント。
議論:
このショートは先にTP2まで到達する?それともEMA反発で損切りになる?
$XAUT /USDT - 売り(SHORT)
取引計画:
エントリー: 3983.1 – 3990.7
SL: 4023.8
TP1: 3959.2
TP2: 3940.8
TP3: 3913.2
なぜこの構造に注目するの?
- 4時間足のショートシグナルで、確信度95%、1Dのトレンドは明確に下落。
- 現在値3986.9はエントリーエリア付近で、RSI(15分足)は42.92。弱さはあるが、売られ過ぎには未到達。
- ATR(1時間)は15.36で、ボラティリティは十分。TP1 3959.2はすぐそこ、TP2 3940.8には余地がある。
- なぜ今なの?ショートの勢いはまだ衰えておらず、EMAの抑制下での反発は即ショートポイント。
議論:
このショートは先にTP2まで到達する?それともEMA反発で損切りになる?
XAUT-1.66%
- 報酬
- いいね
- コメント
- リポスト
- 共有
言うな、今回は本当に面子をくれた。📉🔥 ここ数日前の午後の板はまだ高値圏で横に張り付いて強く見えて、多くの人がまだ上に行けると思ってた。俺の見立てでは逆に違和感があった:リバウンドに出来高がなく、売り圧が出た瞬間に押し潰された。
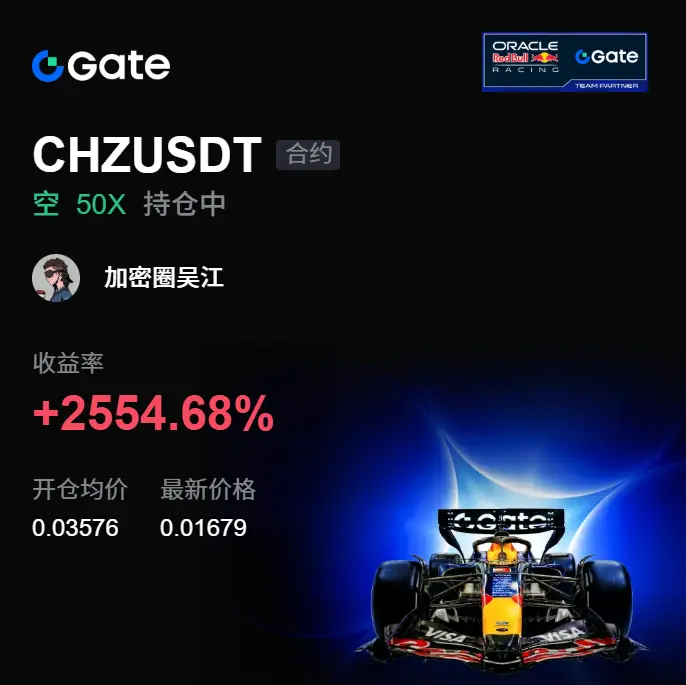
板がまだ完全に始動していない頃、$CHZ は上に突っ込むたびにあと一口足りない感じだった。当時はショートのリズムで見るように提示して、ロングは参考として 0.03576 。ただ闇雲に弱気なだけじゃなくて、承接(露怯)を待っていた👀📌
いま価格が 0.01679 まで来て、利回りは+2554.68%。この局面はすぐに利確して、握り方がとても気持ちいい。前で忍耐強く待ってた人も、この一口の肉を食べられた✅💰🎯
これがリズム。
追いかけると、殴られやすい。
ポジションの動きはシンプル。ショートはまず 80%🛑 を決済して、大部分を先に袋へ入れる。残り20% はコスト価格で保護して、さらに下がるなら利益を走らせる。反発が来ても、長居はしない📢
乗り遅れたなら追うな⚠️ 次の明確なシグナルを待て。押し目で戻るのを確認して、次のもっと楽な位置を待て。チャンスはずっとある。ちょっとした衝動で心を乱さない🔔
$BTC $ETH
原文表示板がまだ完全に始動していない頃、$CHZ は上に突っ込むたびにあと一口足りない感じだった。当時はショートのリズムで見るように提示して、ロングは参考として 0.03576 。ただ闇雲に弱気なだけじゃなくて、承接(露怯)を待っていた👀📌
いま価格が 0.01679 まで来て、利回りは+2554.68%。この局面はすぐに利確して、握り方がとても気持ちいい。前で忍耐強く待ってた人も、この一口の肉を食べられた✅💰🎯
これがリズム。
追いかけると、殴られやすい。
ポジションの動きはシンプル。ショートはまず 80%🛑 を決済して、大部分を先に袋へ入れる。残り20% はコスト価格で保護して、さらに下がるなら利益を走らせる。反発が来ても、長居はしない📢
乗り遅れたなら追うな⚠️ 次の明確なシグナルを待て。押し目で戻るのを確認して、次のもっと楽な位置を待て。チャンスはずっとある。ちょっとした衝動で心を乱さない🔔
$BTC $ETH
- 報酬
- いいね
- コメント
- リポスト
- 共有
目が覚めたら即気分が冴えた!📉😎 朝、板を開いてみたら、$COLLECT のこのショートがついに答えを出してくれた。数日前の午後、みんなが様子見してたとき、俺は上のあの反発のところをずっと見ていた。明らかに出来高が追いついていなかった。何度上に突っ込んでも、あと一歩足りない感じだった。当時の価格は0.05581あたりで、俺が提示したのはロング開き。ロジックはシンプルだ。反発が弱い、受け皿が足りない、上の売り圧がずっと続いている。感情で無理にロングを追うと、踏み上げで含み損を抱えやすいからな。👀📌 いま0.05013まで打たれて、損益率は+188.39%。車に乗ってる連中はたぶん全員笑いが止まらないだろ。今回のリズムを踏めて、無駄に徹夜したわけじゃない。✅🔥💰 肉を食うべきときに、落ち着いてるふりするな。儲かってるときに一番怖いのは、突然上頭になることだ。ポジションはここで粘らない。まず80%を決済。🎯 残り20%は建値保護。もしこの先もさらに下げるなら、利確は利が勝手に伸びるように任せていく。反発して戻ってきても、利益を気まずくするな。🛑 乗り遅れたやつは追うな。⚠️ いい位置は待てば出てくる。追いかけて引き出すものじゃない。次の、はっきりしたシグナルを待って、新しい構造が出てから動け。🔔 $BTC $ETH
原文表示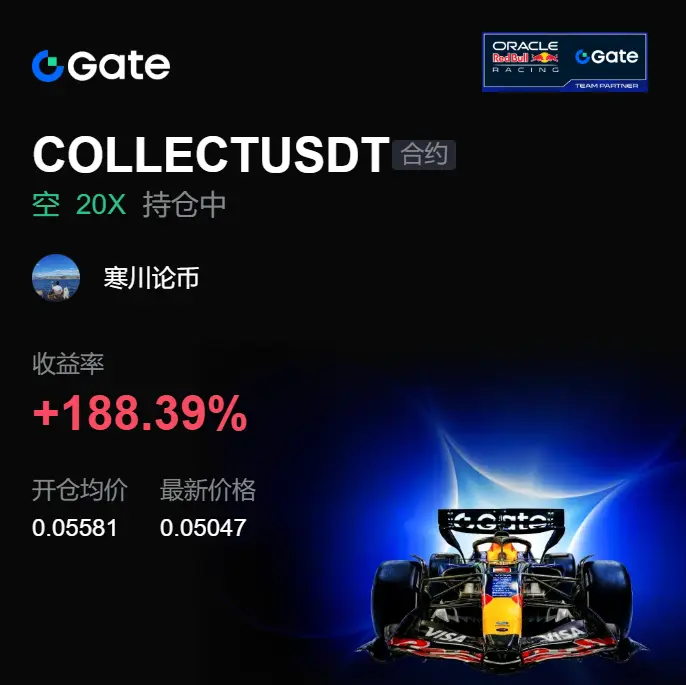
- 報酬
- いいね
- コメント
- リポスト
- 共有
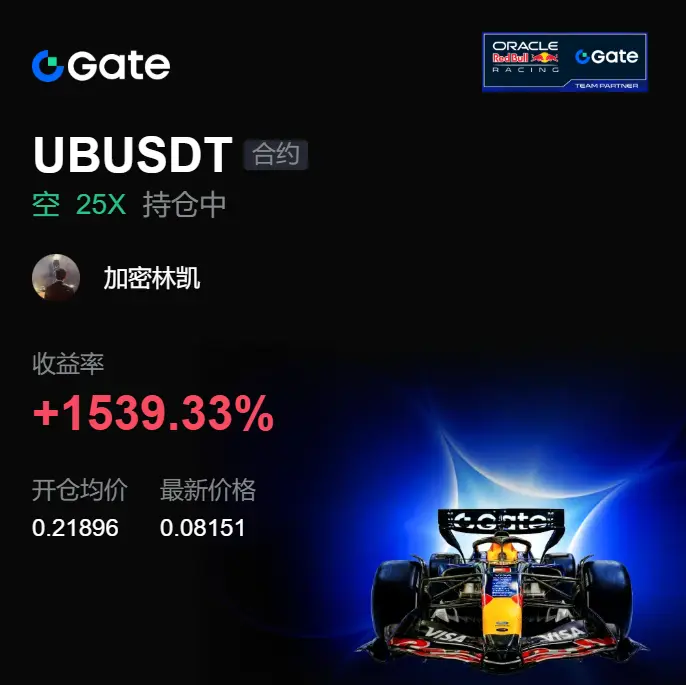
この一連の空売り(空單)がついに約定しました。前半は高値圏でずっと押さえつけられて動かなかったので、ここはもう違和感があると感じていました。
$UB が0.21896付近でチャンスをくれたとき、私が本当に注目したのは一本の陰線ではなく、リバウンドがますます弱くなっていく点、そして買い支え(承接)が明らかに追いついていないことでした。多くの人がまださらに強引に引き上げ(ラ盤)が続くのを待っていましたが、私は上の売り圧が緩んでいるかどうかを見ていました。すると板の反応がとてもはっきりしていて、0.08142まで上がったところで、空売り側の余地が放出され、現在の利益は+1540.78%です。
この手の相場で最も怖いのは、途中で小さな戻り(小反抽)に脅かされて飛ばされることですが、一度リズムが変われば、もう強気(ロング)の発想で見てはいけません。今ポジションを持っている兄弟たちは、利益がすでにかなり大きいので、82:18の割合で段階的に処理できます。まず一部を確保し、その後は保護ラインで延伸を見てください。
まだ入っていない人は急がなくていいです。リバウンドは追いかけて買わないこと、逃したら追いかけて空売りもしないこと。次のチャンスをもっと気持ちよく待ちましょう。
$BTC $ETH
原文表示$UB が0.21896付近でチャンスをくれたとき、私が本当に注目したのは一本の陰線ではなく、リバウンドがますます弱くなっていく点、そして買い支え(承接)が明らかに追いついていないことでした。多くの人がまださらに強引に引き上げ(ラ盤)が続くのを待っていましたが、私は上の売り圧が緩んでいるかどうかを見ていました。すると板の反応がとてもはっきりしていて、0.08142まで上がったところで、空売り側の余地が放出され、現在の利益は+1540.78%です。
この手の相場で最も怖いのは、途中で小さな戻り(小反抽)に脅かされて飛ばされることですが、一度リズムが変われば、もう強気(ロング)の発想で見てはいけません。今ポジションを持っている兄弟たちは、利益がすでにかなり大きいので、82:18の割合で段階的に処理できます。まず一部を確保し、その後は保護ラインで延伸を見てください。
まだ入っていない人は急がなくていいです。リバウンドは追いかけて買わないこと、逃したら追いかけて空売りもしないこと。次のチャンスをもっと気持ちよく待ちましょう。
$BTC $ETH
- 報酬
- いいね
- コメント
- リポスト
- 共有
家族のみんな誰かわかる!この一本は本当に気分が上がったよ📉🔥 何日か前、寝る前のチャートはまだ必死に耐えてたのに、$AVAX は上に何度か突っ込んでもあと一口が足りなかった。俺はその時「見かけの上昇に騙されるな」って言った。上には強い押さえがはっきりあって、出来高も👀 みんなが様子見してる間、俺が見てたのは“受け止め不足”。高値を突いても買い手が誰も繋がない。だんだんと釣り上げの匂いが濃くなってきた。だから空売りの方針はそのまま、9.148あたりでチャンスが来たら迷わず🎯 結果、今朝盤面を開いたら答えが来てた!9.148から6.588まで一直線で叩き落とされ、現在の利益は+1984.86% 。この“肉”を食うのが気持ちいい✅💰 これがリズムだ。不安定に擦られても平気、先に焦るのが一番ダメ。運用はまず80%を利確、大部分は手中に入れて📌 残り20%は取得単価で保護。さらに下がるなら利益を走らせる。戻ってきても、利益を吐き戻さないで🛑 乗り遅れた人は追わない⚠ 追いかけて追突するとメンタルが乱れやすい。次の“明確なシグナル”を待って、押し目の戻りで確認してから見ればいい。市場は機会に欠かない、足りないのは忍耐だけ🔔 $BTC $ETH
原文表示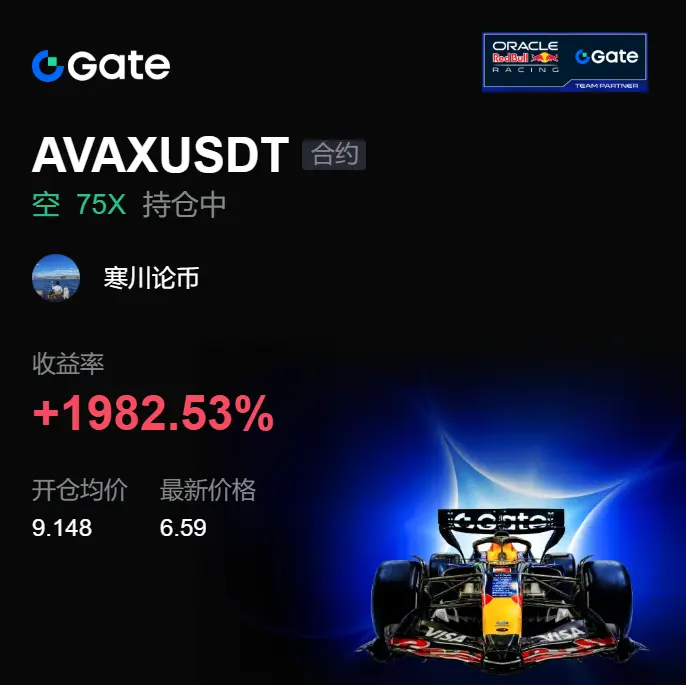
- 報酬
- いいね
- コメント
- リポスト
- 共有
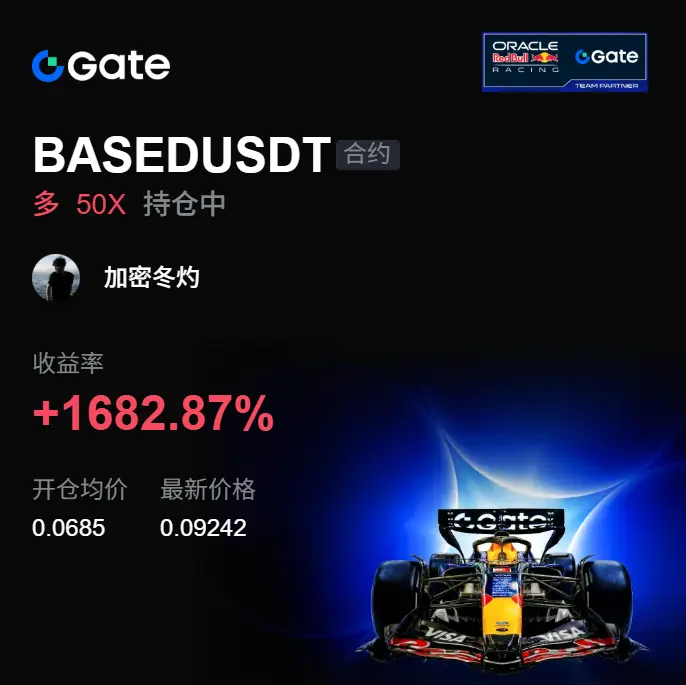
一度目覚めてそのまま精神が冴えた!📈 数日前の午後 $BASED もまだレンジの中でモミモミしてた。チャートが完全に始動してない段階で、俺が見てたのは「それが上がったかどうか」じゃない。「戻り(押し)をした後にちゃんと受け止められてるか」🎯
その時、0.06850 付近から買い板が強くなり始めて、底での横ばいが崩れない。資金がこっそり入ってきてるような匂いがしたから、俺は「ロング」と提示した。この位置で大事なのは興奮じゃなくて忍耐だ👀
肉を食う時間になったら、平然としてるフリはするな。
理解したら実行。最後の一歩で迷うな。
今は0.09242に来て、利益がそのまま+1682.87%まで到達。リズムを踏めると気持ちいい🔥 この波は派手なことしてない。待つべき時は待つ、乗るべき時は乗る😎
ポジションの方は先に80%を利確して懐に入れる✅ 残り20%は取得単価で保護して、これからも突き進むならそのまま走らせる。利益に情は絡めるな💰
乗り遅れたやつは追いかけて追突するな⚠️ 後から追うとメンタルが崩れやすい。次の一発は、戻りの確認が取れてから動け📢 良い場所で待って出てくるのを待つのであって、追いかけて出てくるものじゃない。
$BTC $ETH
原文表示その時、0.06850 付近から買い板が強くなり始めて、底での横ばいが崩れない。資金がこっそり入ってきてるような匂いがしたから、俺は「ロング」と提示した。この位置で大事なのは興奮じゃなくて忍耐だ👀
肉を食う時間になったら、平然としてるフリはするな。
理解したら実行。最後の一歩で迷うな。
今は0.09242に来て、利益がそのまま+1682.87%まで到達。リズムを踏めると気持ちいい🔥 この波は派手なことしてない。待つべき時は待つ、乗るべき時は乗る😎
ポジションの方は先に80%を利確して懐に入れる✅ 残り20%は取得単価で保護して、これからも突き進むならそのまま走らせる。利益に情は絡めるな💰
乗り遅れたやつは追いかけて追突するな⚠️ 後から追うとメンタルが崩れやすい。次の一発は、戻りの確認が取れてから動け📢 良い場所で待って出てくるのを待つのであって、追いかけて出てくるものじゃない。
$BTC $ETH
- 報酬
- いいね
- コメント
- リポスト
- 共有
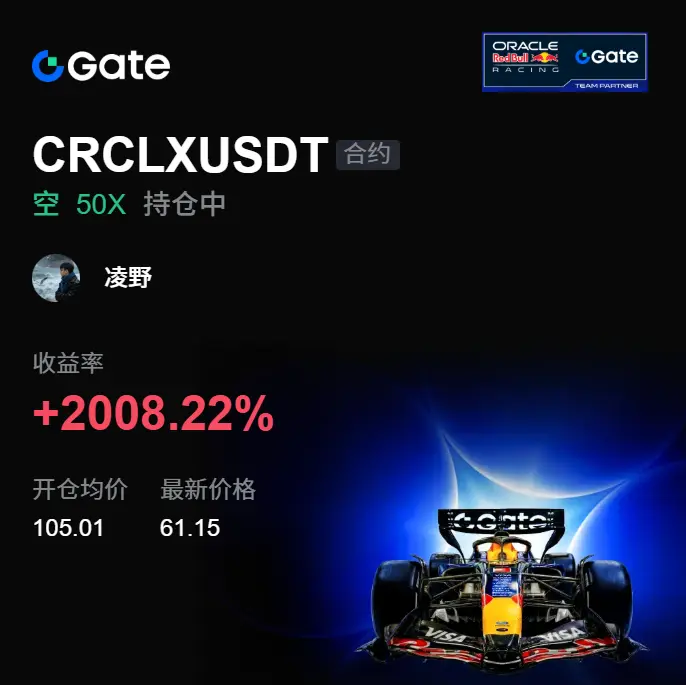
数日前まだ研いでたのに、今日は直接答えを出す!📉🚀 寝る前の最後の一目、$CRCLX はまだ高値圏で横たわるように見せて強い装いをしてるけど、毎回の上昇にはあと一口気が足りない。俺はそのときずっと受け(つなぎ)のところを見てて、見れば見るほど誘い込み(だまし上げ)に見えた。
105.01 付近のあのリバウンドは、出来高が合ってなかった。上の重要なラインがきっちり上から押さえられてる 📌👀。俺の判断としては、さらに上へ強引に突っ込む余地が気持ち悪い。だから追いかけて買うなと注意して、位置に来たらロングする。
今の現値は61.22。105.01から下りて、利回りはすでに+2008.22% 。気持ちいい、リズムもちゃんと掴めてる ✅🔥。この肉は焦らず急がず食えばいい。
これがリズムだ。
儲かってるときに一番怖いのは、急に頭に上がること。
取引では長居しない。まず80% を利確 💰。残り20%は取得単価での保護として、さらに下げてきたらそれを走らせる。リバって戻っても、利益を不快にしないように 🎯🛑
乗り遅れたなら追うな 🚨。いい位置は出てくる。待ってから出ればいいので、追いかけて買って出るものじゃない。次の明確なシグナルを待つ。次のもっと気持ちいい位置で手を出す 🔔
$BTC $ETH
原文表示105.01 付近のあのリバウンドは、出来高が合ってなかった。上の重要なラインがきっちり上から押さえられてる 📌👀。俺の判断としては、さらに上へ強引に突っ込む余地が気持ち悪い。だから追いかけて買うなと注意して、位置に来たらロングする。
今の現値は61.22。105.01から下りて、利回りはすでに+2008.22% 。気持ちいい、リズムもちゃんと掴めてる ✅🔥。この肉は焦らず急がず食えばいい。
これがリズムだ。
儲かってるときに一番怖いのは、急に頭に上がること。
取引では長居しない。まず80% を利確 💰。残り20%は取得単価での保護として、さらに下げてきたらそれを走らせる。リバって戻っても、利益を不快にしないように 🎯🛑
乗り遅れたなら追うな 🚨。いい位置は出てくる。待ってから出ればいいので、追いかけて買って出るものじゃない。次の明確なシグナルを待つ。次のもっと気持ちいい位置で手を出す 🔔
$BTC $ETH
- 報酬
- いいね
- コメント
- リポスト
- 共有
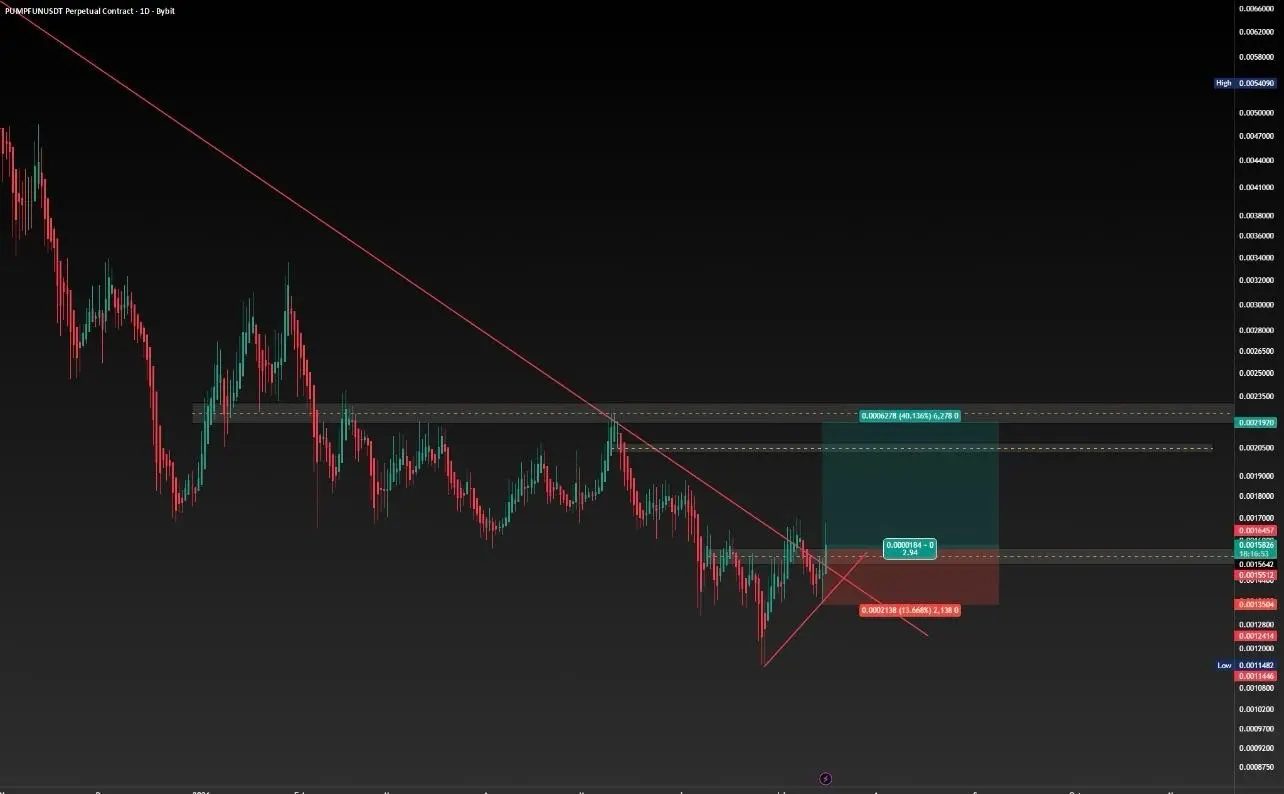
$PUMP は、長期間にわたる切り下げ高と継続的な売り圧力の後、重要な技術的水準に接近しています。
現在、価格は主要なあらゆる回復の試みを退けてきたトレンドラインをテストしています。ブレイクアウトは重要な第一歩になり得ますが、本当の確認は、買い手がブレイクアウトの水準より上を維持し、近くのレジスタンス帯を奪回できるかどうかです。
構造の転換が成功すれば、需要が供給を上回り始めていることを示唆し、回復フェーズから蓄積(アキュムレーション)への移行を意味する可能性があります。
いつも通り、確証は予想よりも重要です。リスク管理は、いかなる市場状況でも欠かせません。
#CXMTPreIPOContractIgnitesCommunity #SummerCreationCamp #PreIPOsSeason2OpenAISubscription
現在、価格は主要なあらゆる回復の試みを退けてきたトレンドラインをテストしています。ブレイクアウトは重要な第一歩になり得ますが、本当の確認は、買い手がブレイクアウトの水準より上を維持し、近くのレジスタンス帯を奪回できるかどうかです。
構造の転換が成功すれば、需要が供給を上回り始めていることを示唆し、回復フェーズから蓄積(アキュムレーション)への移行を意味する可能性があります。
いつも通り、確証は予想よりも重要です。リスク管理は、いかなる市場状況でも欠かせません。
#CXMTPreIPOContractIgnitesCommunity #SummerCreationCamp #PreIPOsSeason2OpenAISubscription
PUMP4.74%
- 報酬
- 4
- 4
- リポスト
- 共有
TwoFactorFreak:
テクニカル的には期待できそうですが、急いで追わず、確認できてから判断しましょう。もっと見る
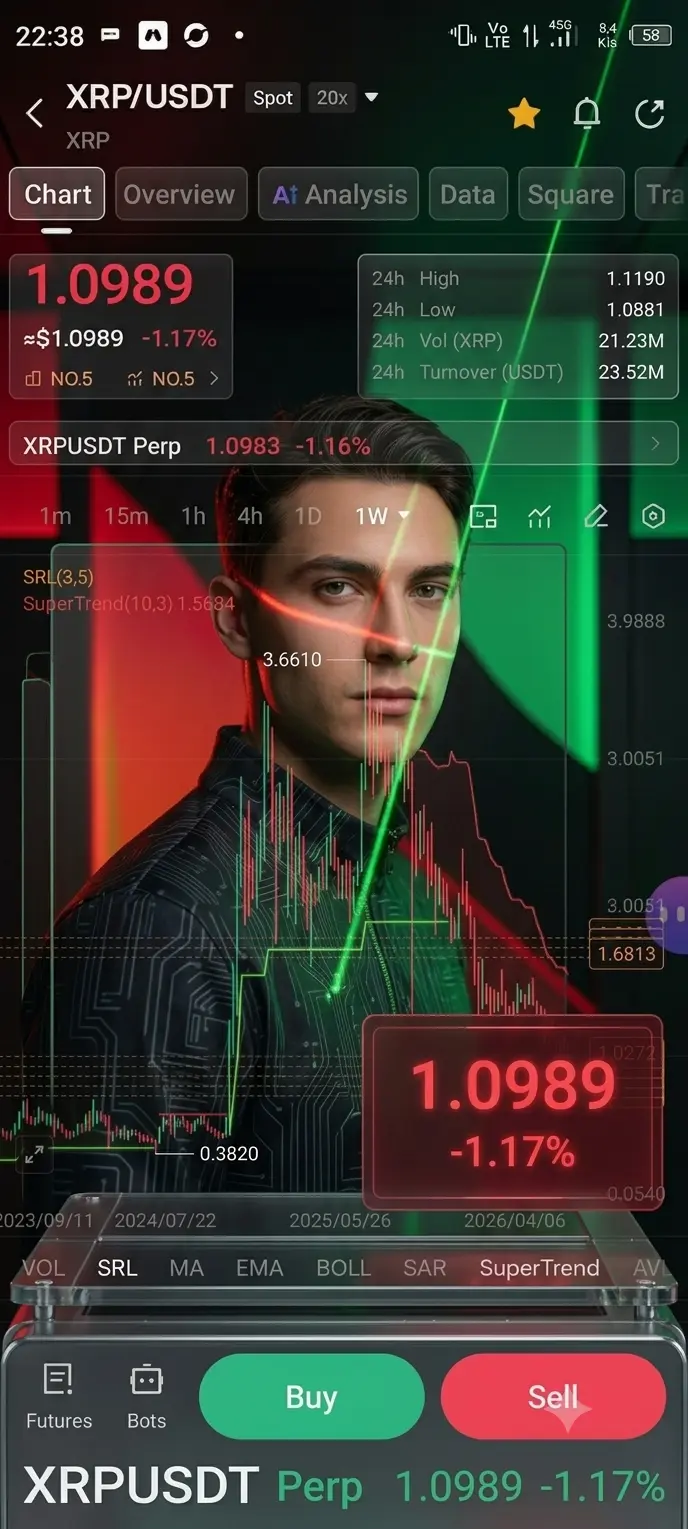
$XRP は約$1.11のあたりで、きついレンジのタイトなもみ合いを維持しており、短期的な勢いの不足に対して中期の堅実な触媒が混在しているという見方は、現状を捉える上で妥当だ。
最も直近のファンダメンタル触媒は確認できており、しかも本当に新しいニュースだ。T. Rowe Priceは本日7月16日、NYSE ArcaにてActive Crypto ETF(ティッカーTKNZ)を立ち上げた。これは、市場に登場した初のアクティブ運用型のマルチトークン・スポット暗号資産ETFであり、これまで主流だった単一アセットのパッシブ商品とは明確に異なる。XRPは、ビットコイン、イーサ、Solanaなどと並んで当該ファンドの組入れ可能資産として確認されている。これにより、暗号市場でのモメンタムやローテーションに基づいて、固定インデックスを追うのではなく、デジタル資産を5〜15銘柄の範囲で保有し、ウェイトを能動的に調整できる。T. Rowe Priceは運用する顧客資産が1.89兆ドルあるため、これほどの規模の運営会社のファンドにおいてXRPが明示的に組入れ対象として適格であること自体が、真に機関投資家向けのアクセス地点と言える。もっとも、ファンド内での実際のXRP配分は、固定または保証されたものではなく、ポートフォリオ・マネージャーの継続的な判断に左右される。
強気の中期シナリオのもう一つの柱である
最も直近のファンダメンタル触媒は確認できており、しかも本当に新しいニュースだ。T. Rowe Priceは本日7月16日、NYSE ArcaにてActive Crypto ETF(ティッカーTKNZ)を立ち上げた。これは、市場に登場した初のアクティブ運用型のマルチトークン・スポット暗号資産ETFであり、これまで主流だった単一アセットのパッシブ商品とは明確に異なる。XRPは、ビットコイン、イーサ、Solanaなどと並んで当該ファンドの組入れ可能資産として確認されている。これにより、暗号市場でのモメンタムやローテーションに基づいて、固定インデックスを追うのではなく、デジタル資産を5〜15銘柄の範囲で保有し、ウェイトを能動的に調整できる。T. Rowe Priceは運用する顧客資産が1.89兆ドルあるため、これほどの規模の運営会社のファンドにおいてXRPが明示的に組入れ対象として適格であること自体が、真に機関投資家向けのアクセス地点と言える。もっとも、ファンド内での実際のXRP配分は、固定または保証されたものではなく、ポートフォリオ・マネージャーの継続的な判断に左右される。
強気の中期シナリオのもう一つの柱である
XRP-1.11%
- 報酬
- いいね
- コメント
- リポスト
- 共有

- 報酬
- いいね
- コメント
- リポスト
- 共有
この板が一翻った瞬間、ショートがそのまま決済してきた!📉😎
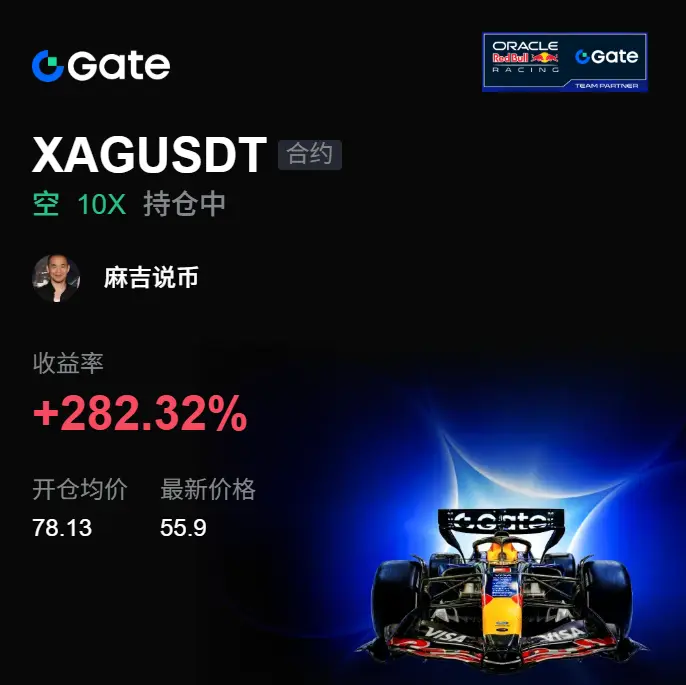
寝る前の最後の一目も私は $XAG を見ていて、高値圏で上がりも下がりもしない状態だった。見た目はかなり硬いが、実際は一段突くとすぐ崩れる。出来高がついてこないうえ、受け(買い支え)も足りない。上側の抑えがずっと押し続けていて、この構造は私は追わない。
数日前の明け方、XAG を監視していたとき、リバウンドが毎回押し戻されているのを見た。買い板に継続性がない👀 その時点で、今回の動きは高値での誘い(多頭を煽る)により近いと判断し、計画どおり 78.13 付近で ロング を仕込んだ。
今は 78.13 から 55.87 まで来て、利回りは +282.45%。無駄に待ったわけじゃない、ちょうどいい掴み方ができた🔥✅
お金は、衝動で稼ぐものじゃない。
処理では長居しない。まず 80%💰 を利確し、残り20%は原価で守る🎯 さらに叩きに来るなら利益は利益として自分で伸ばさせて、反発が戻ってきても獲得したリズムを崩さない。
いい位置は出てきたものだ。追いかけて取るものじゃない。⚠️
乗り遅れた人は追わないで、次の明確なシグナルを待つ。いったんの押し戻しを確認してから、もっと気持ちいい位置で探そう📌
$BTC $ETH
原文表示寝る前の最後の一目も私は $XAG を見ていて、高値圏で上がりも下がりもしない状態だった。見た目はかなり硬いが、実際は一段突くとすぐ崩れる。出来高がついてこないうえ、受け(買い支え)も足りない。上側の抑えがずっと押し続けていて、この構造は私は追わない。
数日前の明け方、XAG を監視していたとき、リバウンドが毎回押し戻されているのを見た。買い板に継続性がない👀 その時点で、今回の動きは高値での誘い(多頭を煽る)により近いと判断し、計画どおり 78.13 付近で ロング を仕込んだ。
今は 78.13 から 55.87 まで来て、利回りは +282.45%。無駄に待ったわけじゃない、ちょうどいい掴み方ができた🔥✅
お金は、衝動で稼ぐものじゃない。
処理では長居しない。まず 80%💰 を利確し、残り20%は原価で守る🎯 さらに叩きに来るなら利益は利益として自分で伸ばさせて、反発が戻ってきても獲得したリズムを崩さない。
いい位置は出てきたものだ。追いかけて取るものじゃない。⚠️
乗り遅れた人は追わないで、次の明確なシグナルを待つ。いったんの押し戻しを確認してから、もっと気持ちいい位置で探そう📌
$BTC $ETH
- 報酬
- いいね
- コメント
- リポスト
- 共有
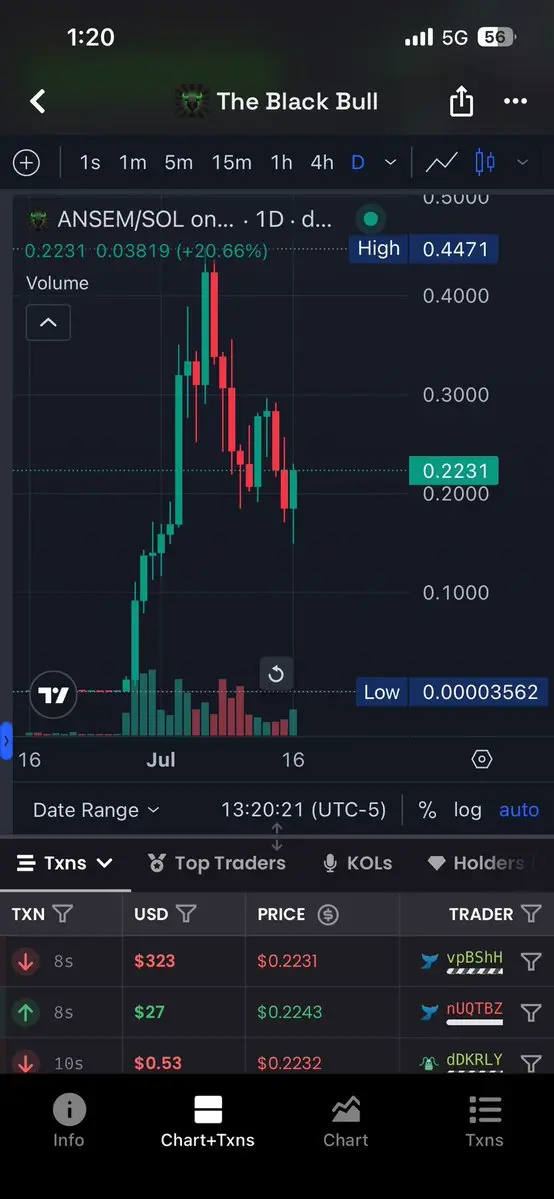
$ANSEM の底部は
これはおそらく、二度とこれほど安く見かけることはないでしょう
原文表示これはおそらく、二度とこれほど安く見かけることはないでしょう
- 報酬
- いいね
- コメント
- リポスト
- 共有
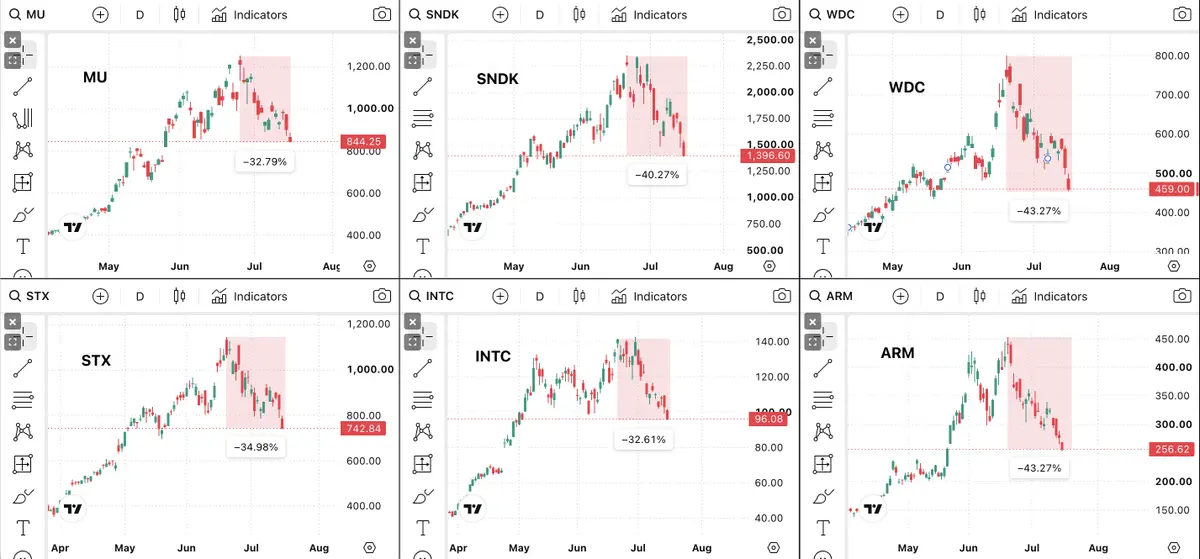
高値からのメモリ株の大幅下落
$MU -32.79%
$SNDK -40.27%
$WDC -43.27%
$STX -34.98%
$INTC -32.61%
$ARM -43.27%
これは、各企業が売上高を上回ったときです。これが市場の仕組みです。
AI株では、FRB議長ウォーシュの発言後に圧力がさらに強まりました:
「私たちは、この拡張がどの程度まで経済に恩恵をもたらすのか、まだ把握できていません。とはいえ、少なくとも私の見立てでは、今後は少なくとも“AI投資”と呼ばれているものが、すぐに“投資”と呼ばれるようになるのは避けられないように思えます。それでも、経済にとって新しい機会が生まれることで、政策立案者には新たな課題が生じます。」
原文表示$MU -32.79%
$SNDK -40.27%
$WDC -43.27%
$STX -34.98%
$INTC -32.61%
$ARM -43.27%
これは、各企業が売上高を上回ったときです。これが市場の仕組みです。
AI株では、FRB議長ウォーシュの発言後に圧力がさらに強まりました:
「私たちは、この拡張がどの程度まで経済に恩恵をもたらすのか、まだ把握できていません。とはいえ、少なくとも私の見立てでは、今後は少なくとも“AI投資”と呼ばれているものが、すぐに“投資”と呼ばれるようになるのは避けられないように思えます。それでも、経済にとって新しい機会が生まれることで、政策立案者には新たな課題が生じます。」
- 報酬
- いいね
- コメント
- リポスト
- 共有
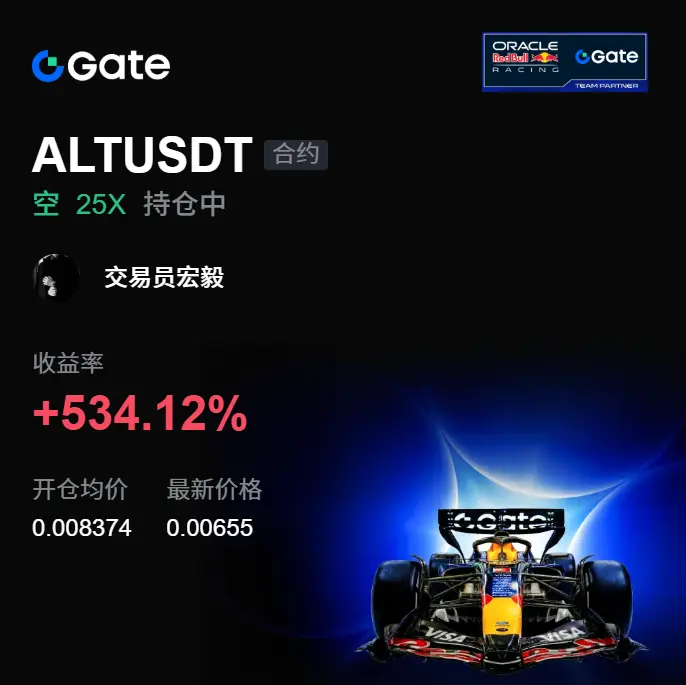
この下落はついに出尽くしました。$ALT 今回は単なる下落ではなく、高値圏での圧力に耐えられた後の売り方による回収です。
先ほどの値動きで一番迷惑なのは、ずっと気持ちよく下がらず、何度も上に引っ張ってくるところです。赤い線を見ると追いかけたくなる人も多い。私は当時、どれだけ上がったかではなく、上昇した後にそこに留まれるかを見ていました。結果は明らかで、ALT は毎回重要な水準に近づくと叩き戻され、構造がはっきり変わりました。
私は 0.008374 付近で買い(ロング)をしました。本当に気づかせてくれたのは、リバウンドがますます短くなり、売り圧だけがどんどん重くなっている点でした。現在価格が 0.006552 まで来ており、この含み益はすでに +534.12% です。値動きの余地がかなり直接的に放出されています。
この利益が出たら私は無理に欲張りません。80/20 で分割処理する方が気楽です。まずは大部分をロックして、残りは保護ラインに沿って様子を見ます。乗れなかった人は焦らなくていいです。逃したら逃したで追わず、次のチャンスを待ちましょう。
$BTC $ETH
原文表示先ほどの値動きで一番迷惑なのは、ずっと気持ちよく下がらず、何度も上に引っ張ってくるところです。赤い線を見ると追いかけたくなる人も多い。私は当時、どれだけ上がったかではなく、上昇した後にそこに留まれるかを見ていました。結果は明らかで、ALT は毎回重要な水準に近づくと叩き戻され、構造がはっきり変わりました。
私は 0.008374 付近で買い(ロング)をしました。本当に気づかせてくれたのは、リバウンドがますます短くなり、売り圧だけがどんどん重くなっている点でした。現在価格が 0.006552 まで来ており、この含み益はすでに +534.12% です。値動きの余地がかなり直接的に放出されています。
この利益が出たら私は無理に欲張りません。80/20 で分割処理する方が気楽です。まずは大部分をロックして、残りは保護ラインに沿って様子を見ます。乗れなかった人は焦らなくていいです。逃したら逃したで追わず、次のチャンスを待ちましょう。
$BTC $ETH
- 報酬
- いいね
- コメント
- リポスト
- 共有
言うなよ、空売り勢この波は本当にリズムを叩き出してる!🔥📉
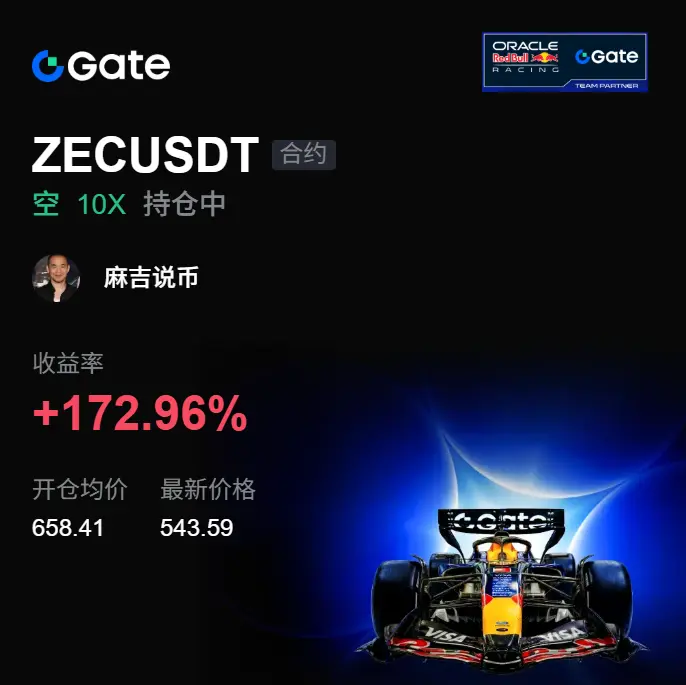
数日前の深夜 $ZEC はまだ高値圏で横になってすり減らしてたんだけど、見た目は痛くもかゆくもないように見えても、細部はもうかなり怪しくなってた。リバウンドは一度として強くならず、出来高も追いつかない。上から押されると一気に弱くなる、この相場なら私は下落まで待ってから実現(取りこぼさない)するほうがいい。
相場がまだ完全に立ち上がってないとき、ZECが上がってるのに 👀 を受け止める人がいなかったのを見て、その時点で「誘い込み(見せ玉)寄りの味が濃い」と判断した。だから追いかけては行かず、658.41 付近で ロング を仕掛けた。
今の価格は 543.56、利回り表示は+173.47%。前半は本当にじわじわ削ってから、出てきてもちゃんと旨い 🎯💰
落とすときは落として、きっちり確定だ。
この取引の処理は難しくない。まず 80% を利確(クローズ)して、残り 20% はコスト価格まで移して保護 ✅📌。さらに叩き売りが来ても利益を走らせる。反発して戻ってきても、リズムを崩さない。
一部のお金は、衝動で稼ぐものじゃない。⚠️
乗り遅れたなら追わないで。追いかけると追突事故みたいにやられやすい。次のラウンドで、はっきりした構造が出るまで忍耐して待て。シグナルが出たら動く 🔔
$BTC $ETH
原文表示数日前の深夜 $ZEC はまだ高値圏で横になってすり減らしてたんだけど、見た目は痛くもかゆくもないように見えても、細部はもうかなり怪しくなってた。リバウンドは一度として強くならず、出来高も追いつかない。上から押されると一気に弱くなる、この相場なら私は下落まで待ってから実現(取りこぼさない)するほうがいい。
相場がまだ完全に立ち上がってないとき、ZECが上がってるのに 👀 を受け止める人がいなかったのを見て、その時点で「誘い込み(見せ玉)寄りの味が濃い」と判断した。だから追いかけては行かず、658.41 付近で ロング を仕掛けた。
今の価格は 543.56、利回り表示は+173.47%。前半は本当にじわじわ削ってから、出てきてもちゃんと旨い 🎯💰
落とすときは落として、きっちり確定だ。
この取引の処理は難しくない。まず 80% を利確(クローズ)して、残り 20% はコスト価格まで移して保護 ✅📌。さらに叩き売りが来ても利益を走らせる。反発して戻ってきても、リズムを崩さない。
一部のお金は、衝動で稼ぐものじゃない。⚠️
乗り遅れたなら追わないで。追いかけると追突事故みたいにやられやすい。次のラウンドで、はっきりした構造が出るまで忍耐して待て。シグナルが出たら動く 🔔
$BTC $ETH
- 報酬
- いいね
- コメント
- リポスト
- 共有
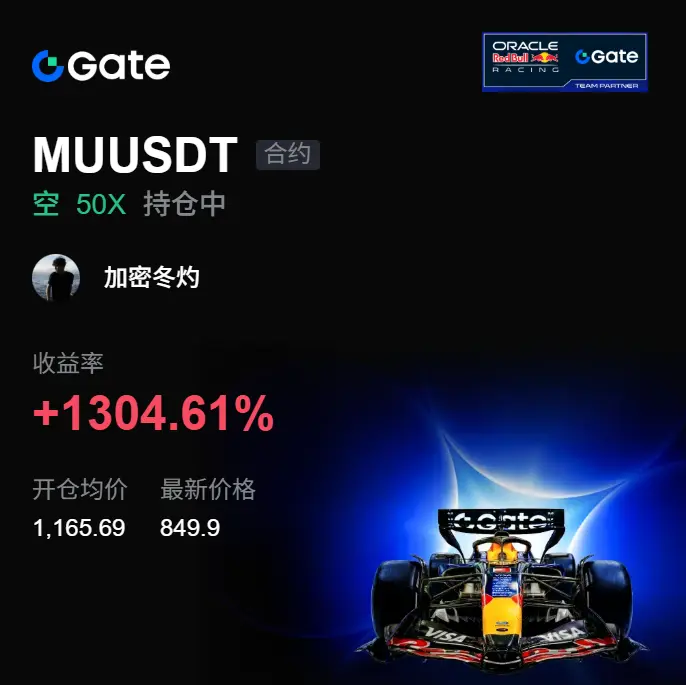
家族の皆さん、誰か分かる人いる?この一波のショートは本当に面目を立ててくれました📉🔥 数日前、寝る前の板面はまだ上で擦っていて、多くの人がこのままさらに上に突っ込むと思っていました。私はしばらく見ていたんですが、出来高が追いつかず、上に行っても受けがいない。この種のリバウンドっぽさはあまり良くないです。
当時$MU は1165.69あたりだったので、私はすぐにロング寄りにしました。無謀に突っ込んだんじゃなくて、上のほうの抑えが明確で、上に行くたびにあと一歩👀📌 というのが見えたからです。
今、価格は849.07まで来ていて、含み益はすでに+1307.26%です。このおいしい肉、気持ちよく食べられてます✅🎯 前は本当に揉み合いで、出てきたら出てきたで本当に最高。
これがリズムです。
運用としては、大部分をまず懐に入れる。先に80%を利確💰 残り20%は取得単価で保護。さらに下を叩くなら利益を走らせて、戻りで反抽しても利益を吐き戻さないで🛑
乗り遅れた人は追わないで⚠️ 追いかけて追突みたいになると、メンタルが乱れやすい。次の明確なサインまで待って、押し目の回帰を確認してから見ればいいです。市場に機会は欠かしてないけど、足りないのは忍耐🔔
$BTC $ETH
原文表示当時$MU は1165.69あたりだったので、私はすぐにロング寄りにしました。無謀に突っ込んだんじゃなくて、上のほうの抑えが明確で、上に行くたびにあと一歩👀📌 というのが見えたからです。
今、価格は849.07まで来ていて、含み益はすでに+1307.26%です。このおいしい肉、気持ちよく食べられてます✅🎯 前は本当に揉み合いで、出てきたら出てきたで本当に最高。
これがリズムです。
運用としては、大部分をまず懐に入れる。先に80%を利確💰 残り20%は取得単価で保護。さらに下を叩くなら利益を走らせて、戻りで反抽しても利益を吐き戻さないで🛑
乗り遅れた人は追わないで⚠️ 追いかけて追突みたいになると、メンタルが乱れやすい。次の明確なサインまで待って、押し目の回帰を確認してから見ればいいです。市場に機会は欠かしてないけど、足りないのは忍耐🔔
$BTC $ETH
- 報酬
- いいね
- コメント
- リポスト
- 共有
GN CT 🌃
よく眠れ、伝説たちよ 💤
原文表示よく眠れ、伝説たちよ 💤
- 報酬
- いいね
- コメント
- リポスト
- 共有
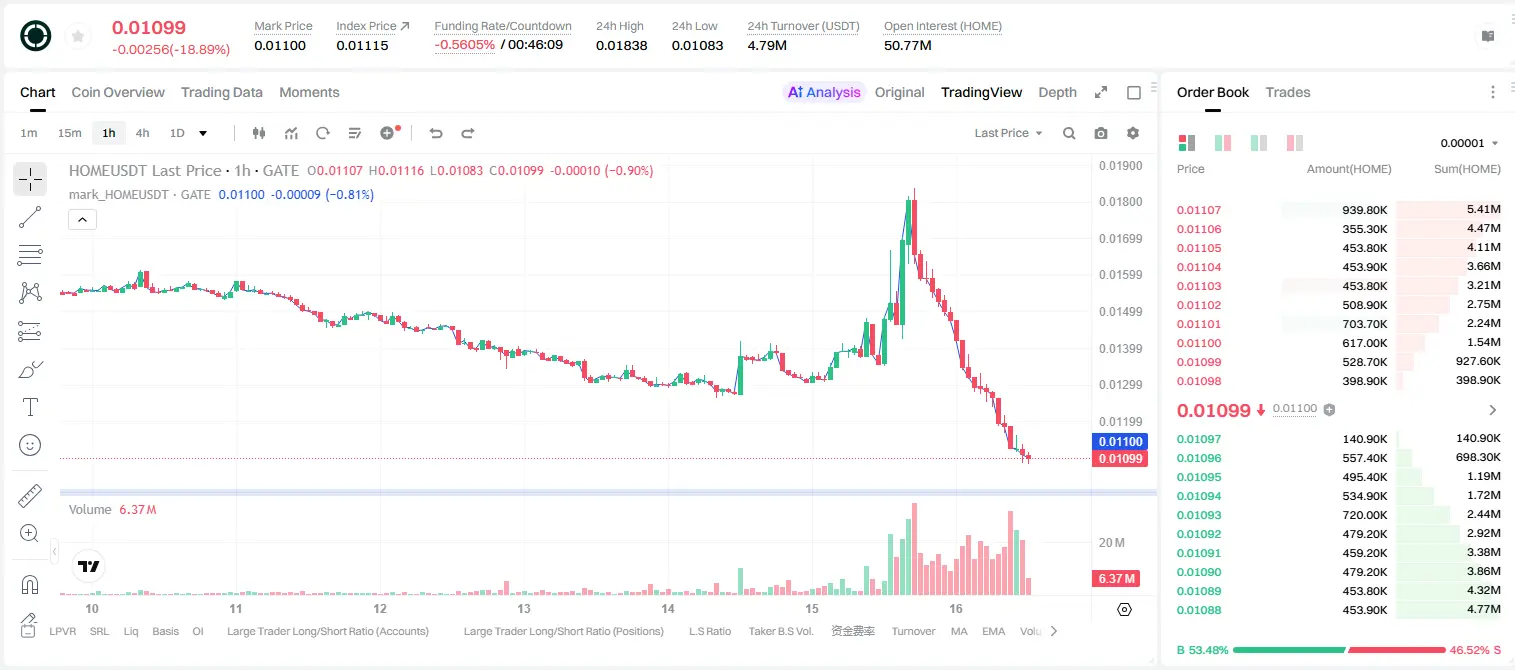
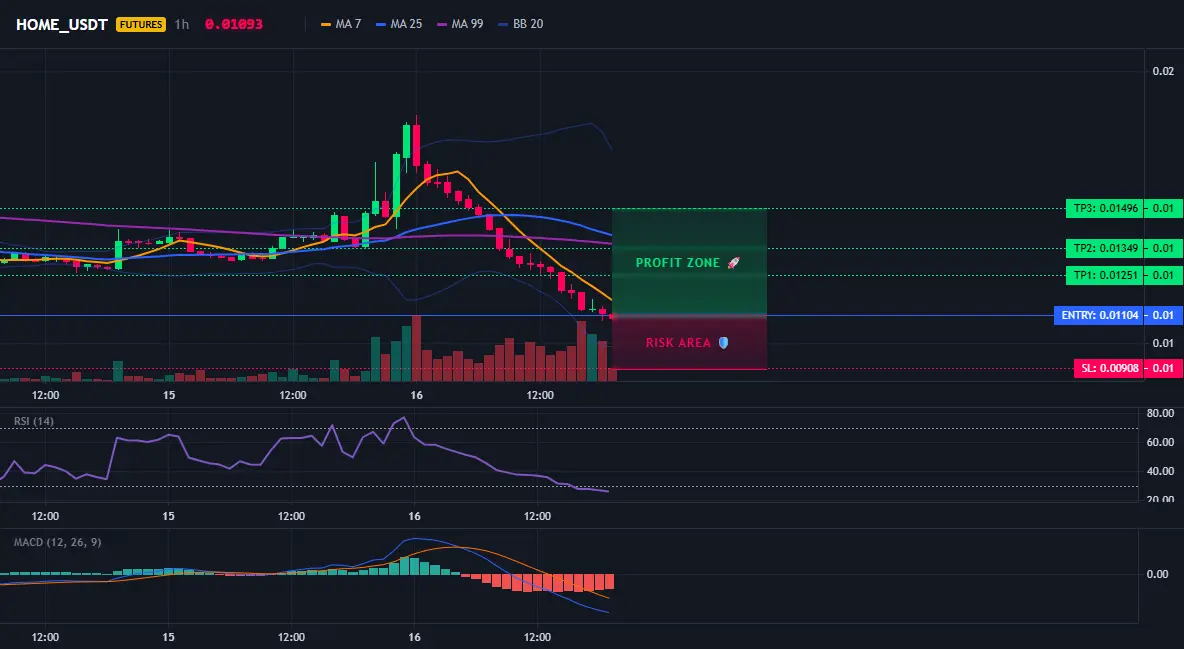
$HOME /USDT 4時間のベア背離、弱気相場でのロングの罠?
$HOME /USDT - ロング(LONG)する
取引計画:
エントリー:0.01088 – 0.01120
SL:0.00908
TP1:0.01251
TP2:0.01349
TP3:0.01496
なぜこの構造に注目するのか?
- RSI 15分が25.31まで到達し、売られ過ぎからの反発シグナルがはっきりしている。
- 4時間のEMAサポートが0.01104で、エントリーポイントは重要なレジスタンスがサポートへ転じるゾーンに正確に刺さっている。
- トレンド1Dは弱気だが、84%の確信度によるLONGシグナルで、短期の勝負はTP1=0.01251(+13%)。確率が高い。
- なぜ今なのか?短期の売られ過ぎ+構造的なサポート=反発の窓が開く。
議論:
$HOME /USDT - ロング(LONG)する
取引計画:
エントリー:0.01088 – 0.01120
SL:0.00908
TP1:0.01251
TP2:0.01349
TP3:0.01496
なぜこの構造に注目するのか?
- RSI 15分が25.31まで到達し、売られ過ぎからの反発シグナルがはっきりしている。
- 4時間のEMAサポートが0.01104で、エントリーポイントは重要なレジスタンスがサポートへ転じるゾーンに正確に刺さっている。
- トレンド1Dは弱気だが、84%の確信度によるLONGシグナルで、短期の勝負はTP1=0.01251(+13%)。確率が高い。
- なぜ今なのか?短期の売られ過ぎ+構造的なサポート=反発の窓が開く。
議論:
HOME-25.42%
- 報酬
- いいね
- コメント
- リポスト
- 共有
速報:ウォーシュ連邦準備制度(FRB)議長は、FRBは破綻する暗号資産(クリプト)企業を救済しないと述べた。
業界は自らのリスクを負い、規制当局はGENIUS法にもとづくルールを最終化する。
原文表示業界は自らのリスクを負い、規制当局はGENIUS法にもとづくルールを最終化する。

- 報酬
- いいね
- コメント
- リポスト
- 共有

- 報酬
- いいね
- コメント
- リポスト
- 共有
もっと詳しく
成長中のコミュニティに、40 M人のユーザーと一緒に参加しましょう
⚡️ 暗号通貨ブームのディスカッションに、40 M人のユーザーと一緒に参加しましょう
💬 お気に入りの人気クリエイターと交流しよう
👍 あなたの興味を見つけよう
人気の話題
もっと見る1.3M 人気度
75.48K 人気度
72.24K 人気度
927.1K 人気度
29.15M 人気度
ピン留め