Share crypto content and earn up to 60% commissions through content mining.
placeholder
gatefun
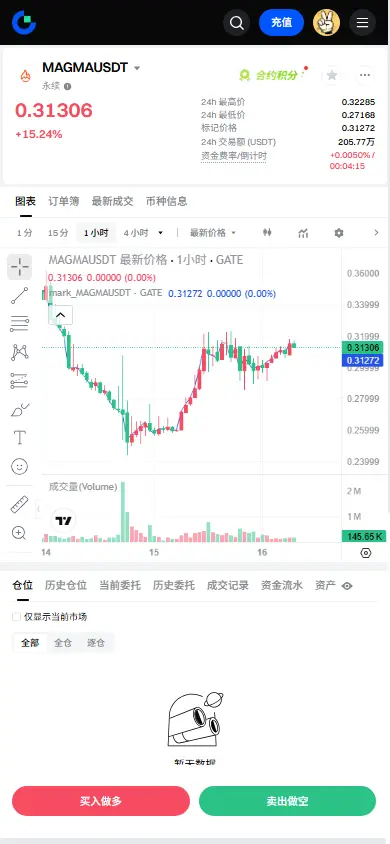
$MAGMA Signal】Bearish raid: 1H MACD bullish momentum exhausted, deep bid liquidity gap
$MAGMA 1H MACD histogram has shrunk for three consecutive bars; the buy ratio dropped sharply from 0.51 to 0.43, and the push strength for longs has clearly weakened. Around 0.3083 on the 4H Bollinger Band midline, longs and shorts are locked in a tug of war; the funding rate is already elevated at 0.0137%, and short-term sell-pressure risk continues to build. The current risk-reward ratio is about 1.5, making it worth withstanding short-term volatility.
🎯 Direction: short
⚡ Entry/limit order: 0.3113232
MAGMA13.60%
BTC0.59%
ETH2.49%
SOL-0.68%
View Original
post-image
  • Reward
  • Comment
  • Repost
  • Share
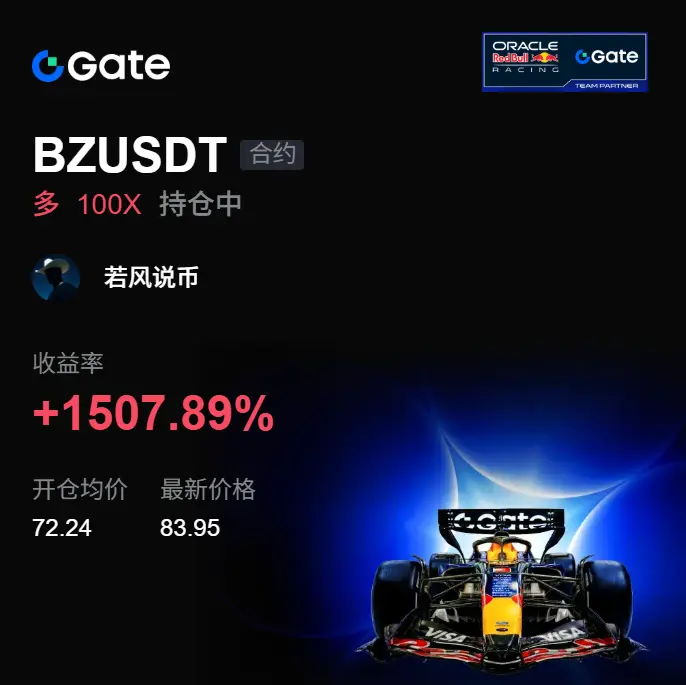
Staring at the chart until I’m nearly blind—just for this one second!!! 👀 A few days ago, before bed $BZ I was still grinding; I didn’t rush to jump to conclusions. The key was whether the crucial levels could hold. The result: support below was picked up very solidly 📌

While everyone else was still watching, I saw the pullback hold and buyers’ pressure strengthen, so I marked the 72.24 area as the Open Long position. Not impulsive—because the market gave the signal 📈

I’m not afraid of it grinding; I’m afraid you panic first.

Now the price is at 83.97, and the profit is +1510.46%. Th
BZ0.12%
BTC-0.34%
ETH1.48%
View Original
post-image
  • Reward
  • Comment
  • Repost
  • Share
Next match you ronaldo fans should support Spain 🇪🇸 please
So Messi can win this again
post-image
  • Reward
  • Comment
  • Repost
  • Share
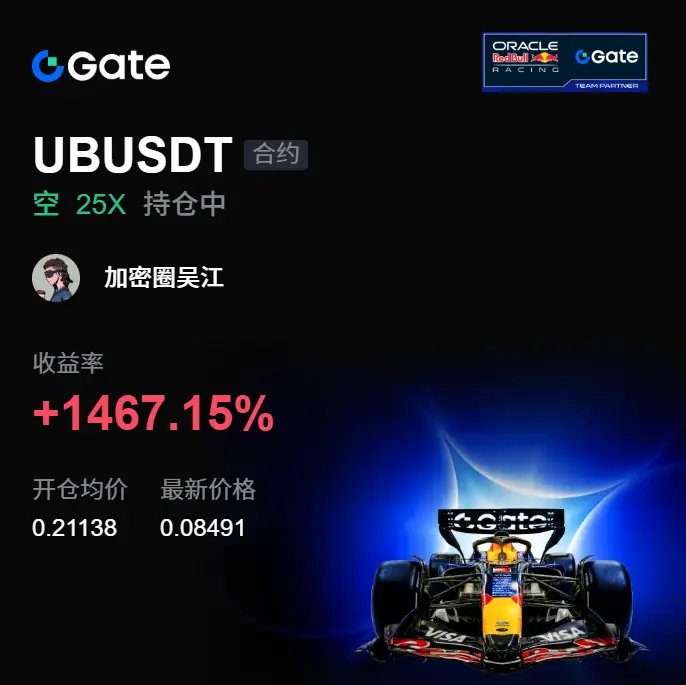
This price action is really a bit ridiculous! 🔥📉 A few days ago, when everyone was still watching from the sidelines in the afternoon, $UB there was an apparent rebound—but in reality the upside resistance was very clear. It popped up and just leaked out. I saw the lack of follow-through on the support, so I told the shorts not to hesitate—stick to the rhythm.

If you get it, just execute—don’t hesitate at the last step.

From entering at 0.21138 to the current price of 0.0849, the gain is +1467.15%. This time it wasn’t for nothing. The longer ✅🎯 it churned beforehand, the more decisiv
UB13.90%
BTC-0.34%
ETH1.48%
View Original
post-image
  • Reward
  • Comment
  • Repost
  • Share
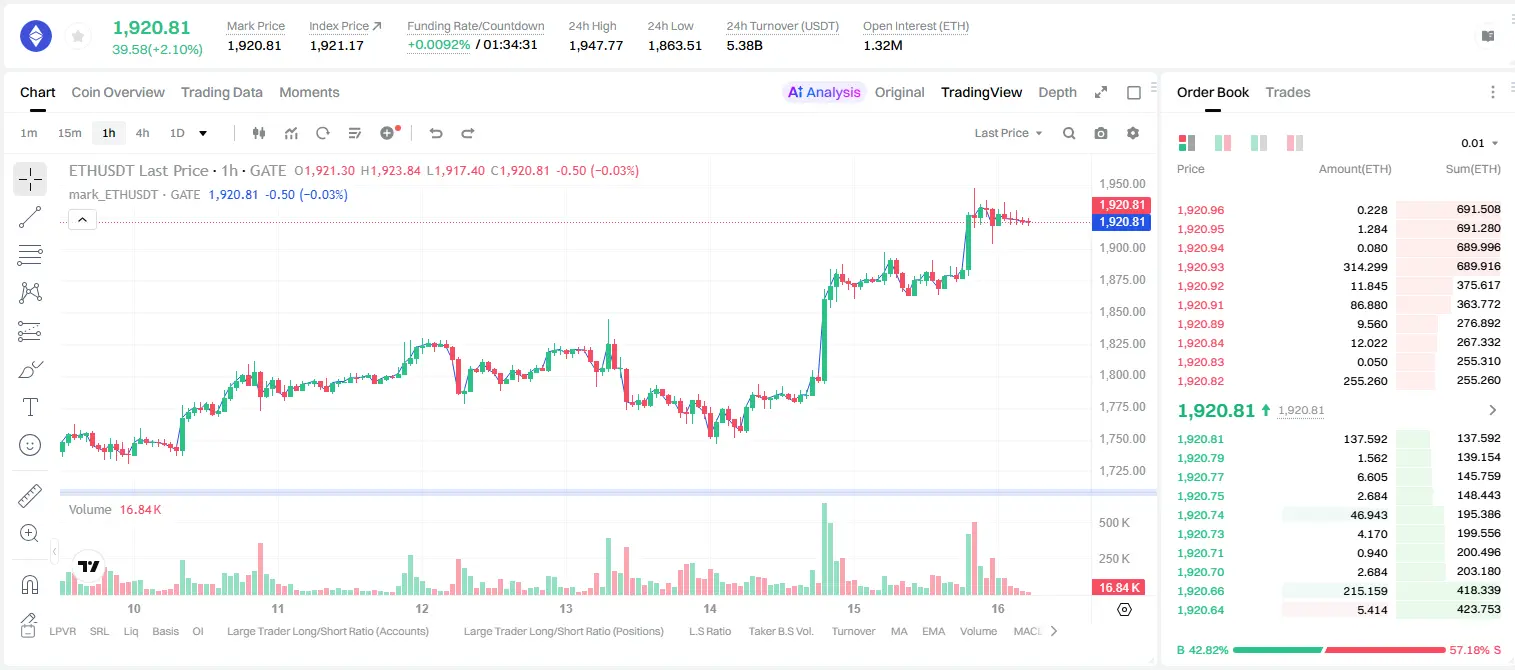
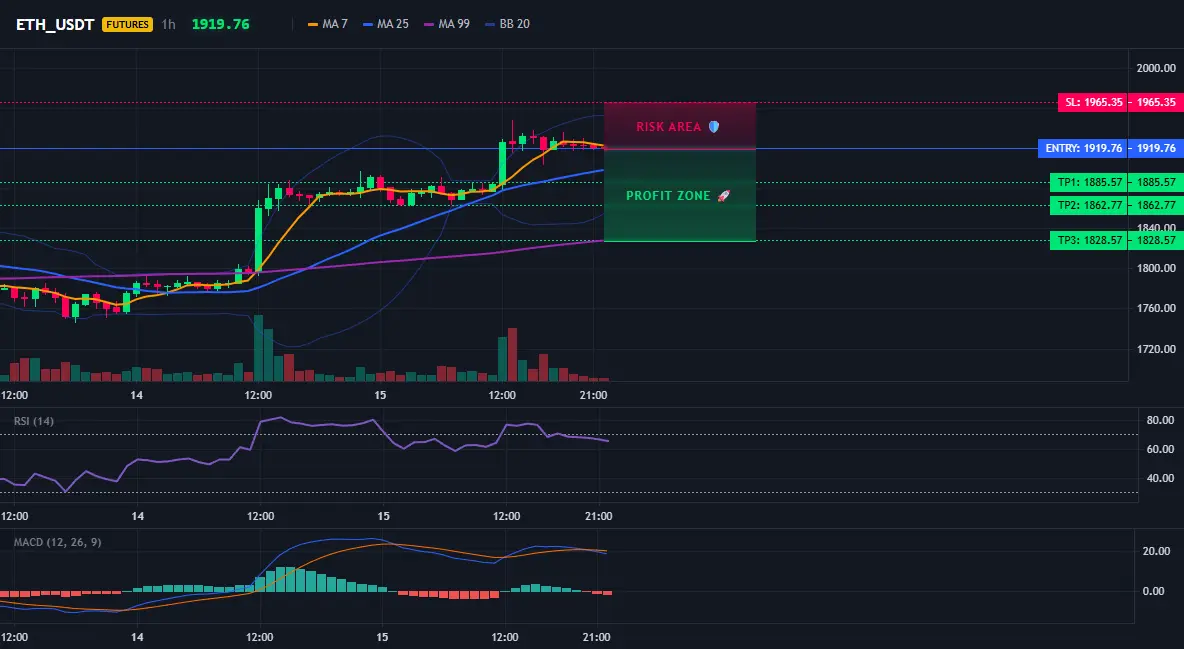
ETH 4-hour EMA has formed a bearish crossover, with the short-side signal lying in wait at 1919.

$ETH /USDT - Go SHORT

Trading plan:
Entry: 1916.11 – 1923.41
SL: 1965.35
TP1: 1885.57
TP2: 1862.77
TP3: 1828.57

Why focus on this structure?
- The current 4H direction is clearly SHORT, with confidence at 77%, and the 1H key resistance at 1919.76 has not been broken.
- RSI on the 15-minute timeframe is 48.05, neutral-to-weak, with no overbought interference; ATR is only 14.6, suitable for a tight stop-loss with big potential upside.
- Why now? Because price is testing the 4H moving-average su
ETH1.48%
View Original
post-image
post-image
  • Reward
  • Comment
  • Repost
  • Share
ChatGPT suffers a sudden outage! AI service stability faces renewed attention, could it impact the I
gate liveLIVE
1,557
live-coin
  • Reward
  • Comment
  • Repost
  • Share
BTC NEWS and live trading signal
gate liveLIVE
58
  • Reward
  • Comment
  • Repost
  • Share
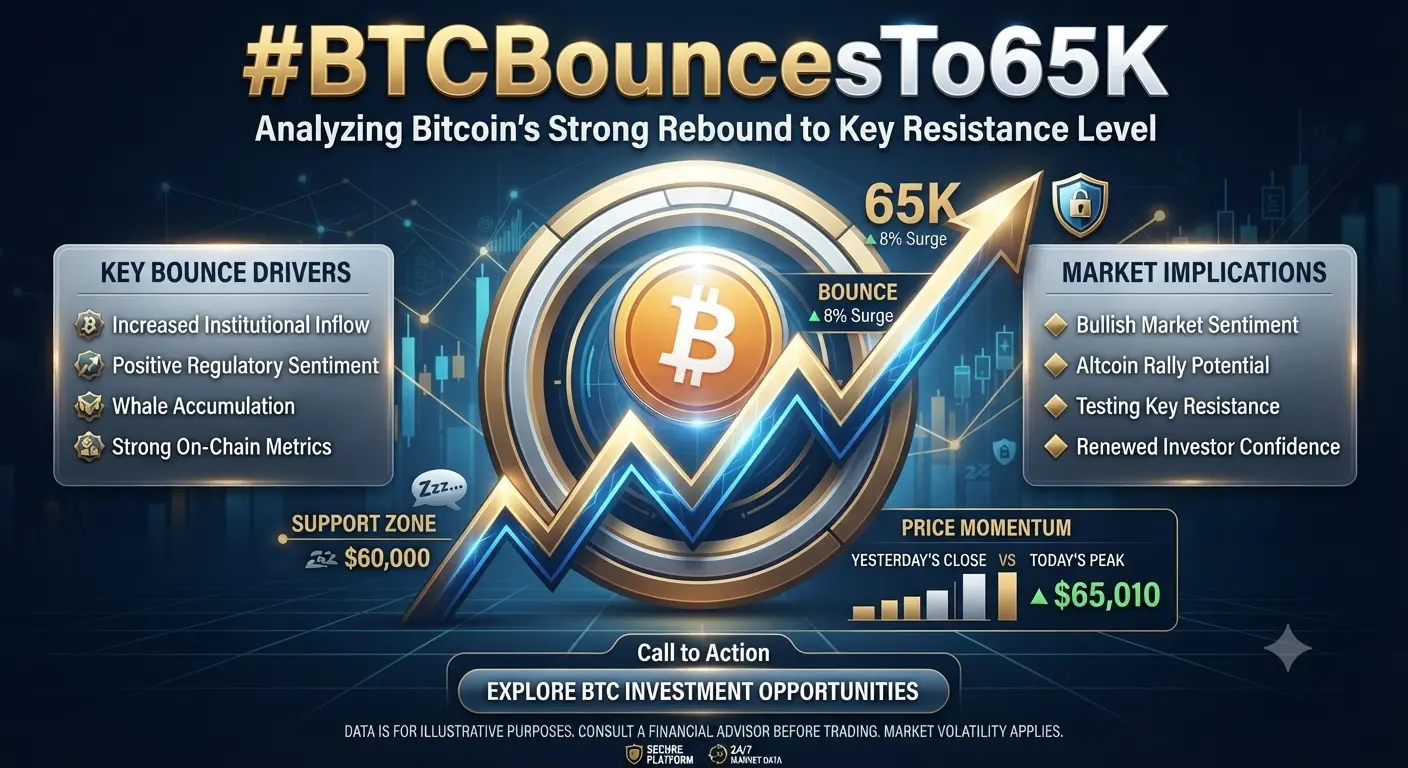
#BTCBouncesTo65K signals a strong recovery in investor sentiment. After facing heightened volatility and periods of selling pressure, BTC rebounded toward the $65,000 level, reinforcing confidence that buyers remain active at key support zones.
Several factors have contributed to this rebound. Renewed institutional interest, improving macroeconomic sentiment, increasing spot Bitcoin ETF participation, and continued long-term accumulation by large holders have all helped strengthen market momentum. As liquidity returns to the crypto market, traders are closely watching whether Bitcoin can estab
BTC-0.36%
post-image
post-image
  • Reward
  • Comment
  • Repost
  • Share
Missed the take-profit and didn’t sell? Then just treat it as market’s pocket change 😎
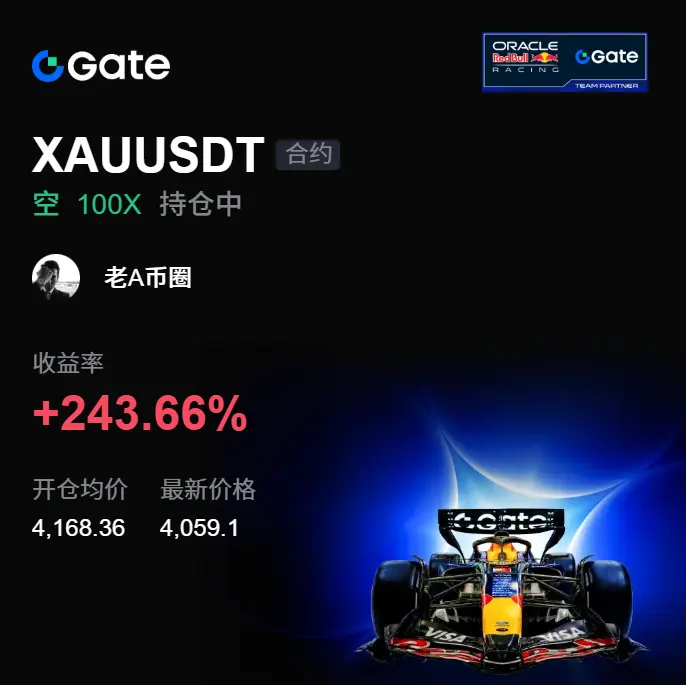
I had just finished lunch when I was watching the charts—$XAU looked scary during the spike up. But I watched the sell wall: it kept getting held down, and the trading volume didn’t back it up either. This is a classic case of pressure near the top. At the time, I set up the long/short direction trade around 4168.36.

Later, the chart totally flipped. Now the price is at 4059.1, and the return rate is up to +243.66%. This time I’d say I nailed the timing—feels good, brothers.

Don’t fear it grinding sidew
XAU0.12%
BTC-0.34%
ETH1.48%
View Original
post-image
  • Reward
  • Comment
  • Repost
  • Share
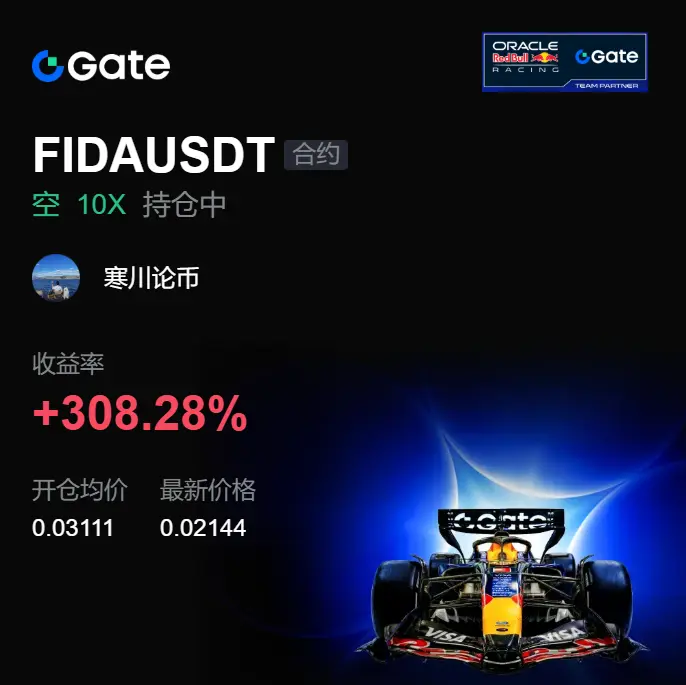
Don’t say this—this round really gives face. When 📉🔥 everyone was still watching from the sidelines, $FIDA the push up was clearly lacking steam; the rebound was weak, and there was no one to take the bids when it went up. After I saw the high-level pressure, I prompted to go long—no need to fight the fake stubborn strength 👀. Entered at 0.03111, and now it’s at 0.02142. The profit already shows +308.28% 🎯💰 This isn’t luck—it's all about timing when the rhythm is right. When you’ve been locked up for a long time, cashing out is what feels so good 😎🎉. Take profit when you should—don’t g
FIDA-0.88%
BTC-0.34%
ETH1.48%
View Original
post-image
  • Reward
  • Comment
  • Repost
  • Share
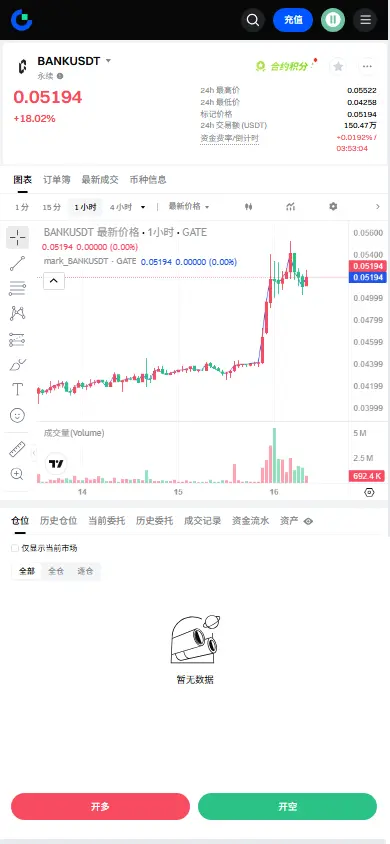
【$BANK Signal】Go long + Buy-side depth support
$BANK RSI (4H) surged to 82.64; buy-side depth is 1.52, fully exposing the intention of capital support. In the 1H Bollinger band, the upper rail is 0.0557. Price pulled back from the high of 0.0547 to 0.05197. Trading volume contracted, but selling pressure was quickly absorbed. In the 4H MACD histogram, it’s at 0.0009; bullish momentum continues to spread, and there are extremely thick limit orders around 0.0510.
🎯 Direction: Go long
⚡ Entry / Place orders: 0.0518141 - 0.0519700
🛑 Stop loss: 0.0514503
🚀 Target 1: 0.0527495
🚀 Target 2: 0.053
BTC-0.36%
ETH1.39%
SOL-0.68%
View Original
post-image
  • Reward
  • Comment
  • Repost
  • Share
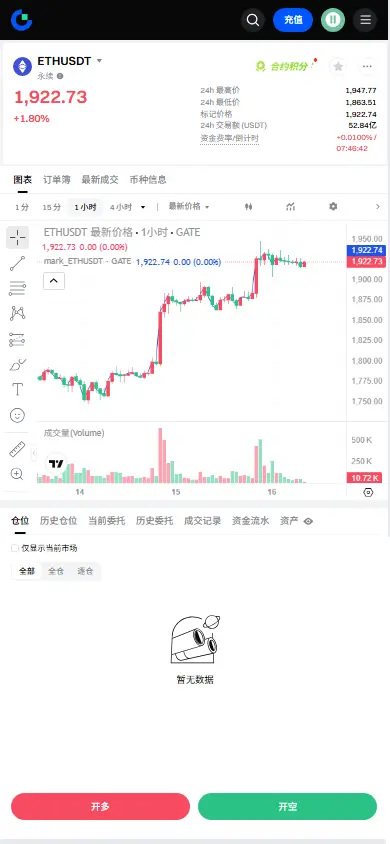
$ETH Signal: 1H oscillation converges, 4H momentum decays; buy-the-dip long setups for staging
$ETH 1H RSI is 65.37. The MACD histogram line at -1.42 continues to decline, and buy-side depth at -3.42% shows weak upside. Price is consolidating in a narrow range of 1917-1930. Trading volume has shrunk for three consecutive bearish candles, and bulls have not yet exerted themselves. On 4H, the upper Bollinger band at 1947 is forming resistance, but the mid-band support at 1835 is still far away.
🎯Direction: long
⚡Entry / orders: 1914.439 - 1920.200
🛑Stop-loss: 1900.998
🚀Target 1: 1949.003
🚀Ta
ETH1.39%
View Original
post-image
  • Reward
  • Comment
  • Repost
  • Share
This candlestick is too “wild”—the face changes faster than flipping a book ~📉😎
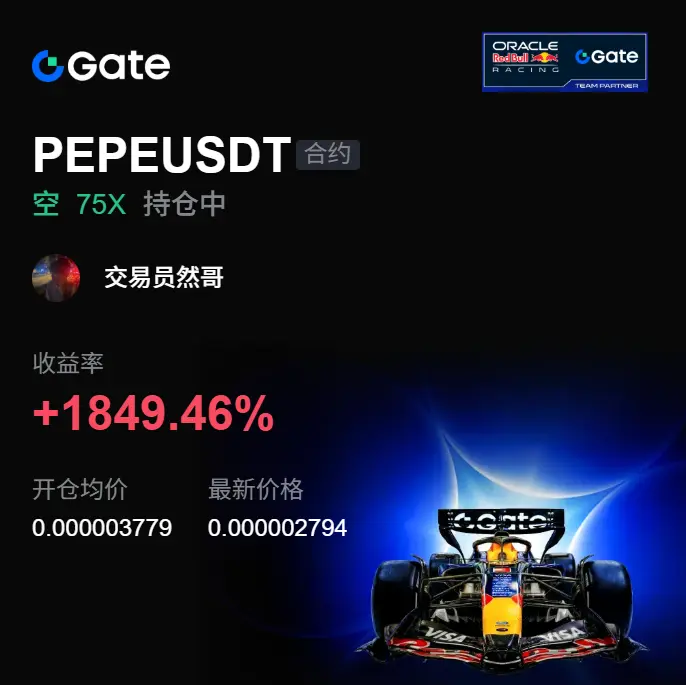
A few days ago, before bed, I kept watching $PEPE . The upside had constant resistance that just wouldn’t budge. The rebound looked exciting, but the volume didn’t keep up—classic: once it goes up, nobody’s there to buy. When the chart hadn’t fully kicked off yet, I already told myself to open longs—no hesitation. Once the entry was given, go for it decisively.
From 0.000003779 to now 0.000002794, the short position directly gave the answer—profit +1849.46%. That’s a satisfying bite 🔥🎯
This is the rhythm.
Now ha
PEPE-1.07%
BTC-0.34%
ETH1.48%
View Original
post-image
  • Reward
  • Comment
  • Repost
  • Share
When this wave of prices gets pushed down, the pace is even more decisive than I expected. Those prior few pullbacks couldn’t hold, so my focus shifts to the continuity after pressure builds at the high end.

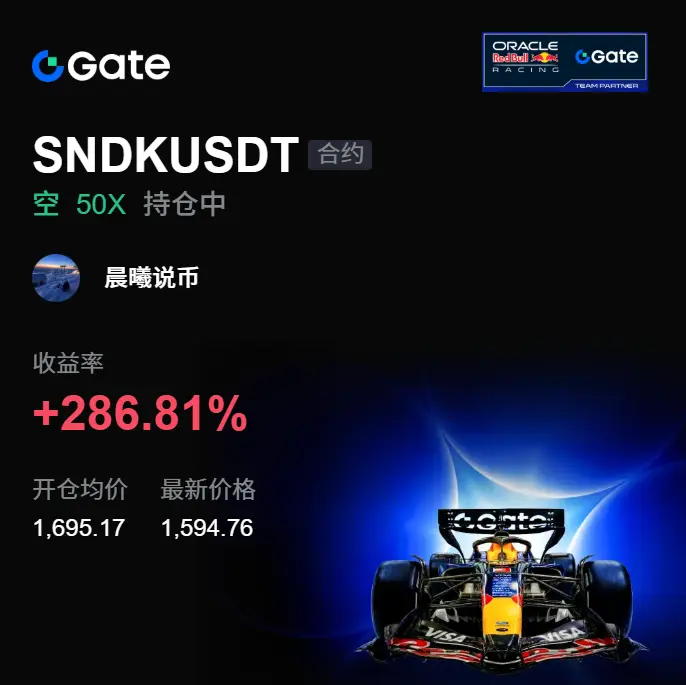
In this $SNDK trade record, the entry reference was 1695.17. After the price moved to around 1596.45, the shorts’ release became clearly noticeable, and the +282.98% is also a form of feedback to my judgment.

What matters most during the process isn’t the fluctuation of a single line, but that after a failed rebound, the funds didn’t keep handing off the momentum. I’ll pay special atte
SNDK-10.65%
BTC-0.34%
ETH1.48%
View Original
post-image
  • Reward
  • Comment
  • Repost
  • Share
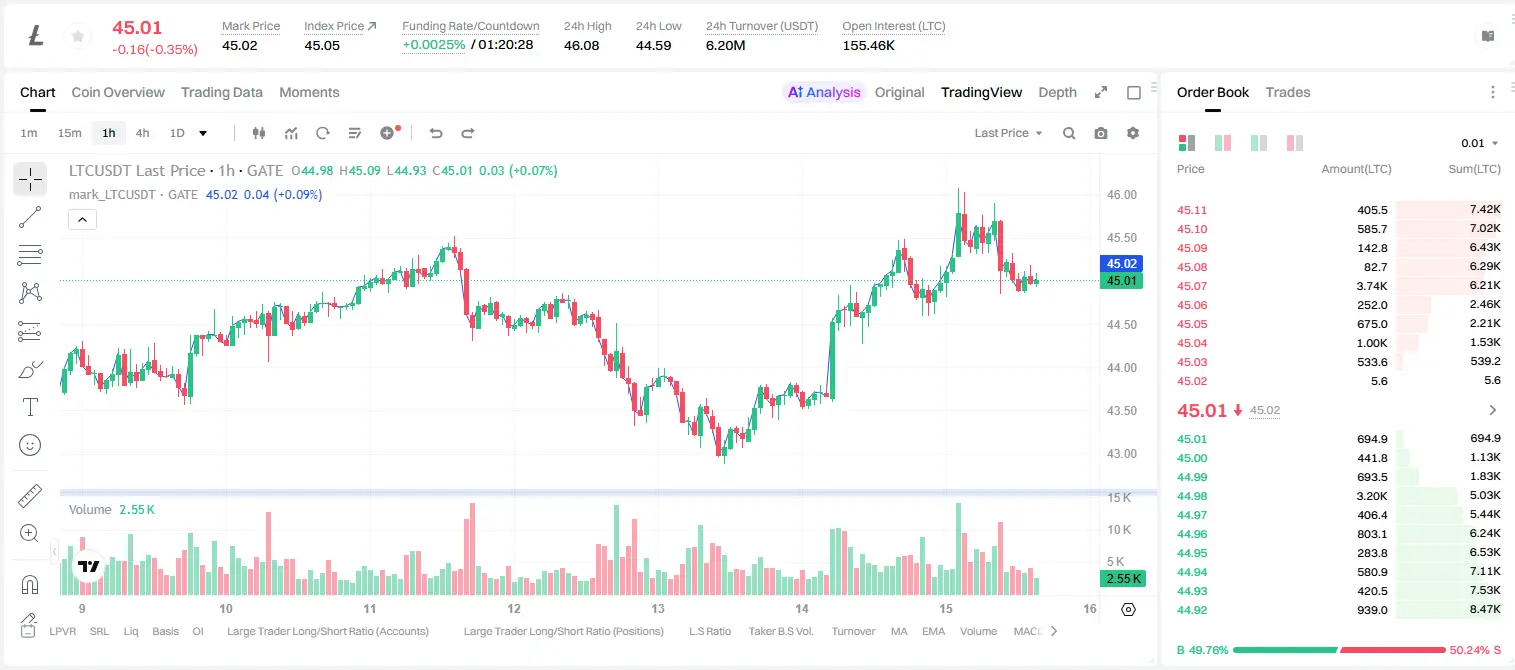
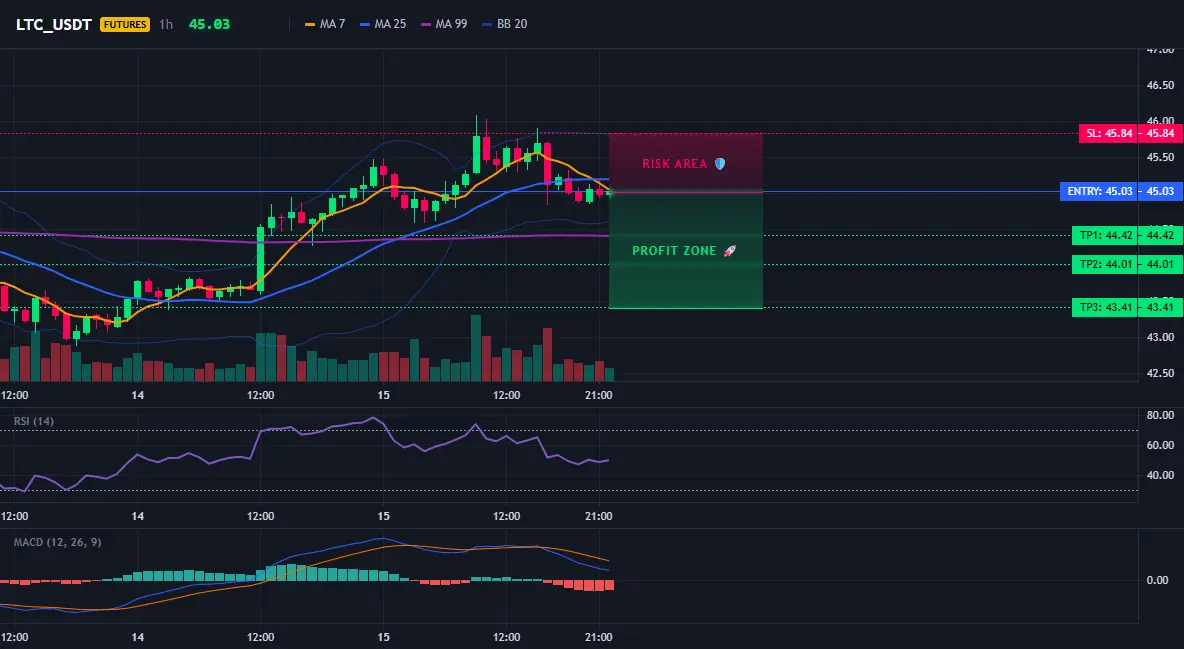
Is the LTC longs still holding up? On the 4-hour timeframe, shorts have already locked in a 95% win rate

$LTC /USDT - SHORT sell

Trading plan:
Entry: 44.95 – 45.11
SL: 45.84
TP1: 44.42
TP2: 44.01
TP3: 43.41

Why focus on this structure?
- The 1D trend is clearly bearish; 4h EMA suppression has been persistent, and the 15m RSI is only 45.08—rebounds are weak.
- Why now? Current 45.03 is close to the resistance zone; LTC has failed to hold above 45.50 for two consecutive days, and the short structure is intact.
- Based on ATR 1h = 0.338: after volatility convergence, it’s about to break
LTC-0.64%
View Original
post-image
post-image
  • Reward
  • Comment
  • Repost
  • Share
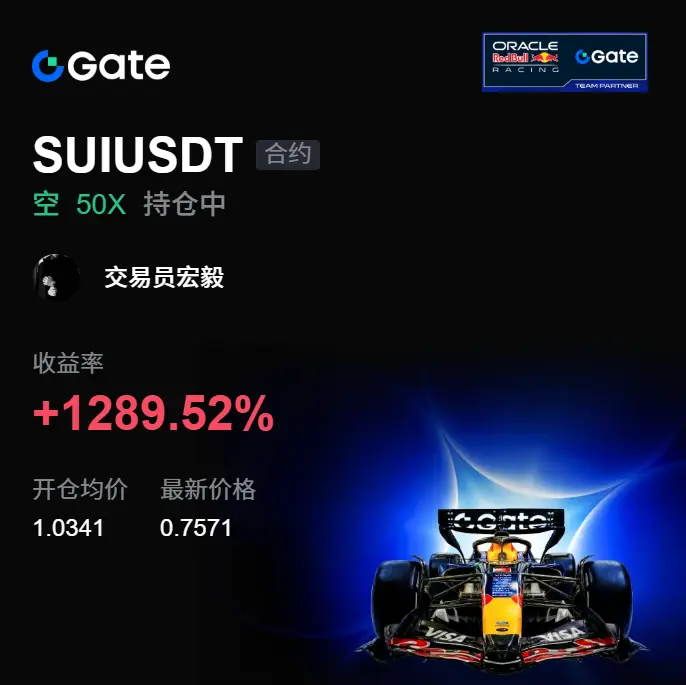
The order flow just gave a very clear answer: after $SUI faced pressure at the high end, it didn’t try to hold up any further. Once the shorts kicked in, the price was directly pushed from around the 1.0341 layout zone down to 0.7572. This trade is currently up +1289.52%, and the room for volatility has opened up.

At the time, what I was watching were those failed breakouts—on the surface it still looked like it was moving up, but every time it reached a key level, sell orders pinned it down. Many people hesitate because the price didn’t drop immediately, but trading can’t only look at the
SUI-0.92%
BTC-0.34%
ETH1.48%
View Original
post-image
  • Reward
  • Comment
  • Repost
  • Share
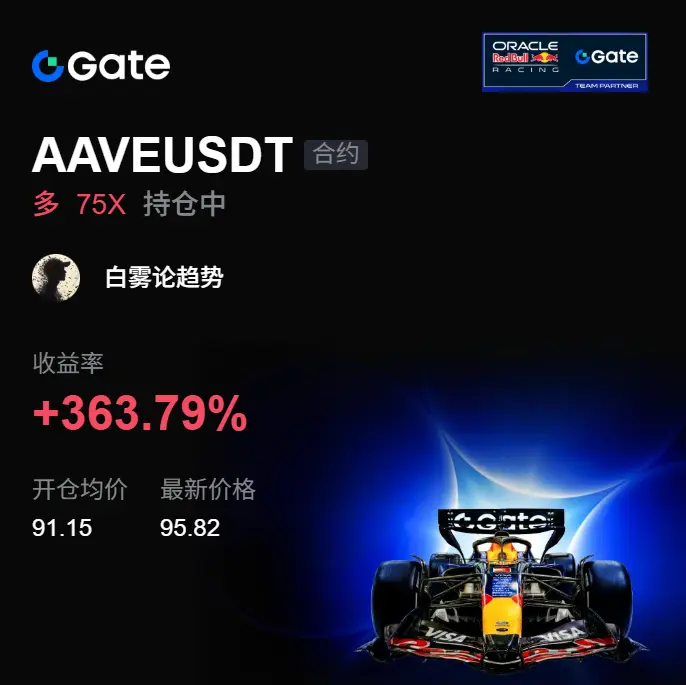
That spike upward just now was crucial. The $AAVE longs bought at 91.15 were carried to 95.84; the current +363.79% has already been realized. What’s most interesting is that after the earlier dip, when many people thought it was going to break, it actually turned into a move to clear out floating orders.
What I was watching wasn’t how big the panic was, but whether, after the sweep, price could be pulled back immediately. After that AAVE needle insertion, the price didn’t keep getting smashed lower; instead, it quickly climbed back to the range. This is already abnormal. Most people got shake
AAVE-3.02%
BTC-0.34%
ETH1.48%
View Original
post-image
  • Reward
  • Comment
  • Repost
  • Share
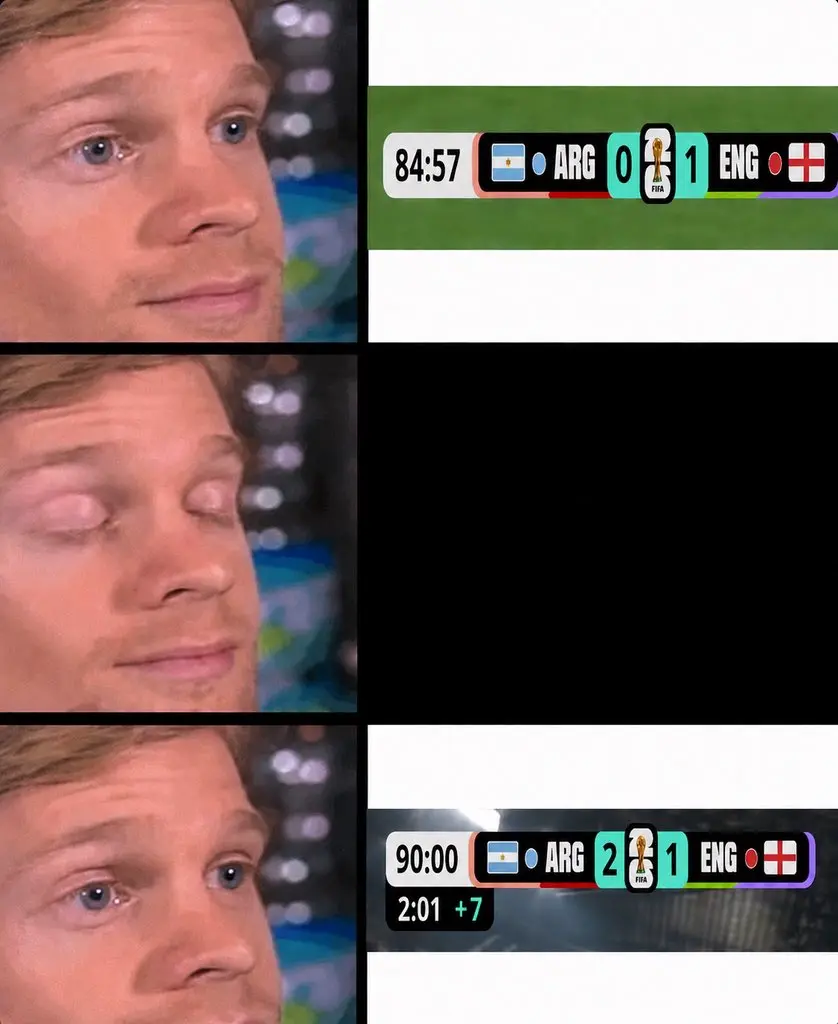
Argentina vs England
post-image
  • Reward
  • Comment
  • Repost
  • Share
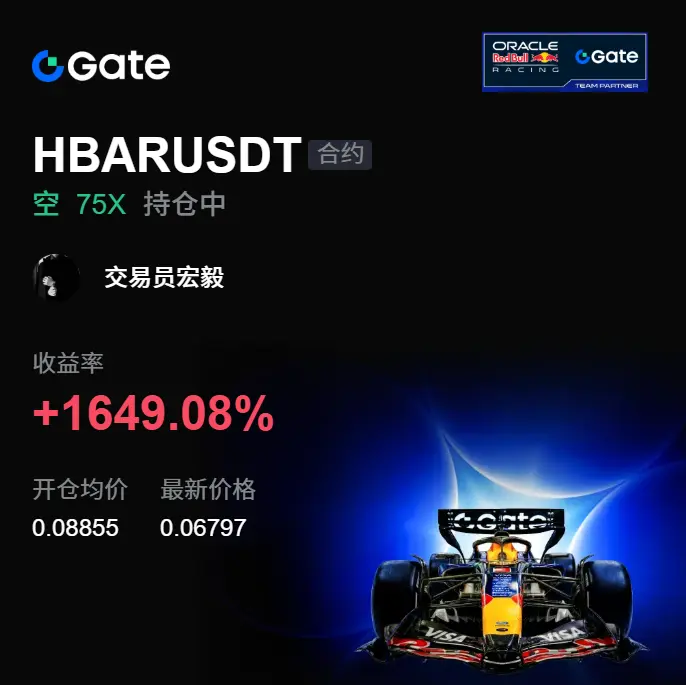
That sell-off just now is very representative. $HBAR isn’t weak for no reason—after failing to break through and keep pushing at the high level repeatedly, capital started to withdraw very obviously. A lot of people only look at the price and whether it hasn’t broken yet; what I care about more is that every rebound gets pushed back each time—the structure has clearly changed.
Before this segment, things had already been prepared. When HBAR was approaching 0.08855, what I was watching was whether the level above truly held. The result was very clear: the buy side couldn’t take it, and the sup
HBAR0.94%
BTC-0.34%
ETH1.48%
View Original
post-image
  • Reward
  • Comment
  • Repost
  • Share
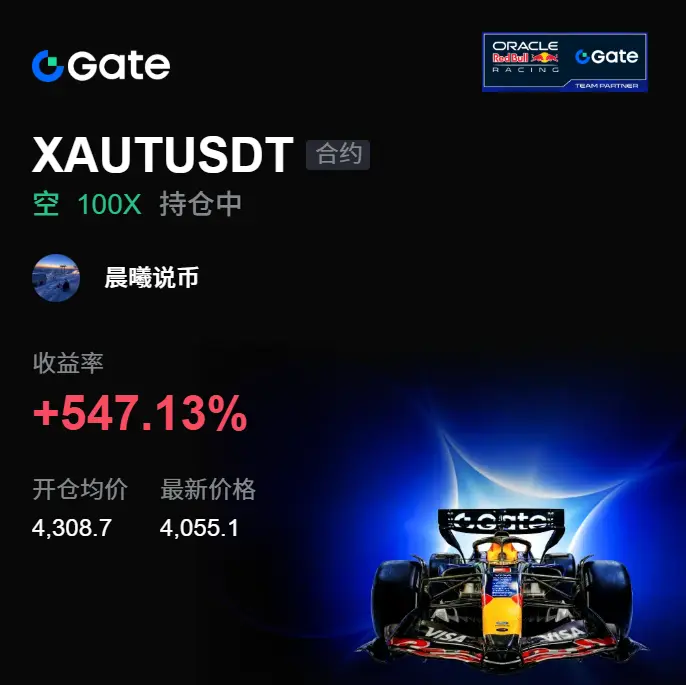
This pullback didn’t come out of nowhere; what really concerns me is the resistance zone after the rebound. The price has tried to push higher several times, but it hasn’t managed to produce a valid continuation.
My focus is on the rhythm shift of $XAUT . I recorded my opening position at 4308.7, and later the price was pushed down all the way to 4055.2. This wasn’t a straight-line drop in between; it was repeated probing followed by the short side releasing pressure.
Now the return on this recorded trade has reached +547.13%. To me, it feels more like the market has responded to my judgment. D
XAUT0.08%
BTC-0.34%
ETH1.48%
View Original
post-image
  • Reward
  • Comment
  • Repost
  • Share
Load More

Join 40 M users in our growing community

⚡️ Join 40 M users in the crypto craze discussion
💬 Engage with your favorite top creators
👍 See what interests you
  • Pinned