

Share crypto content and earn up to 60% commissions through content mining.
placeholder
gatefun
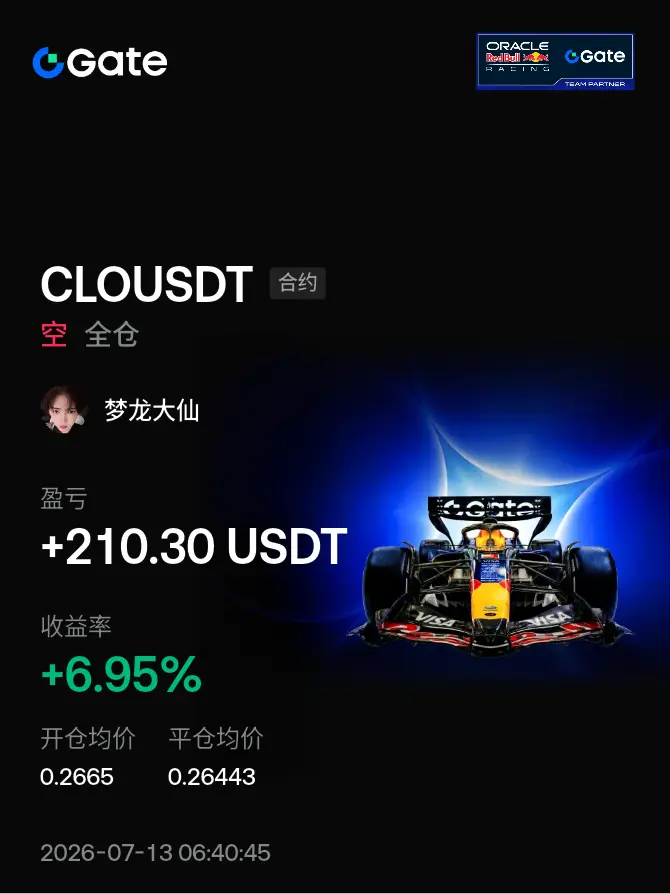
#晒出我的合约收益#With a 30k U position, if you insert 1% more, can you improve the liquidity a bit? I was originally up $600 on 🥲$CLO
CLO2.96%
View Original
post-image
  • Reward
  • Comment
  • Repost
  • Share
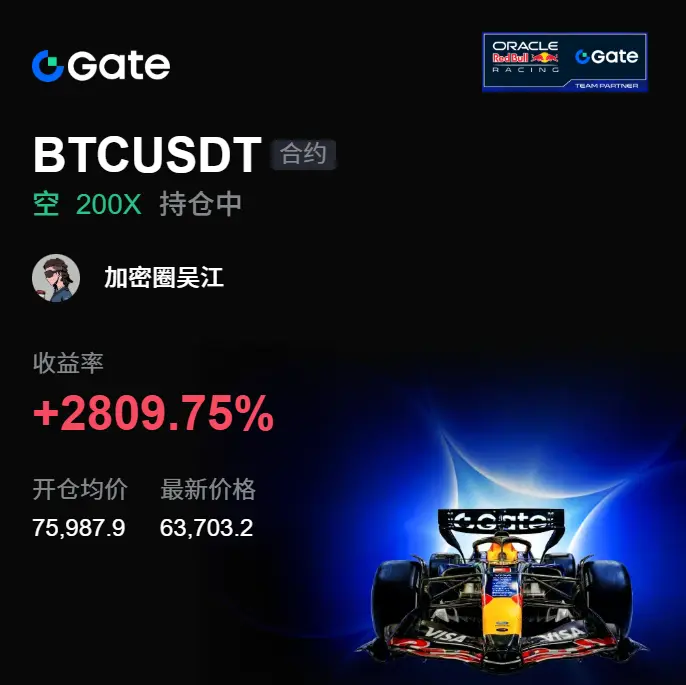
Honestly, this market is really going to mess with people. 👀📉 A few days ago, just before bed, it was still chopping around at the high end. A lot of people looked like it was about to break out, but what I saw was an unlimited surge, with insufficient follow-through. The moment it bumped into the overhead pressure, it turned weak—so at that time I gave a short-side idea and kept watching.
From 75,987.9 to 63,722.7, $BTC this run wasn’t in vain—waiting 🔥✅ +2806.28% to cash out. Once the rhythm plays out, all those annoying, grinding K-lines in front of it were worth it 🎯
Take profits when
BTC-0.05%
ETH0.99%
SOL0.20%
View Original
post-image
  • Reward
  • Comment
  • Repost
  • Share
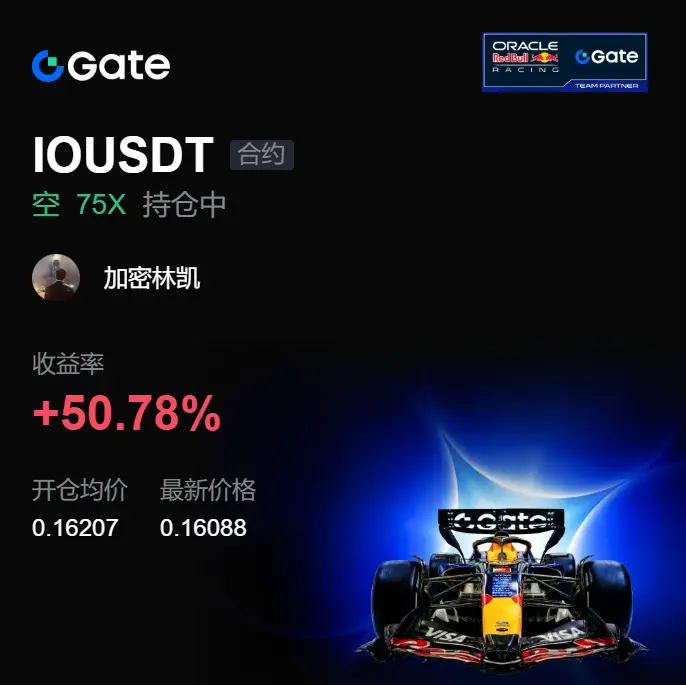
Before this leg of the drop played out, I already felt that the bulls of $IO weren’t quite right. The price spent a long time grinding at the high level—on the surface it looked steady, but in reality every rebound got pushed back down. The short position was entered at 0.16207; now the current price is 0.16069, and the profit is up to +55.16%. The room in the market was released very directly.
The most counterintuitive part at the time was that everyone thought there might be another push higher, but the chart gave me a completely opposite impression. It didn’t accelerate at the highs, yet th
IO-2.63%
BTC-0.05%
ETH0.99%
View Original
post-image
  • Reward
  • Comment
  • Repost
  • Share
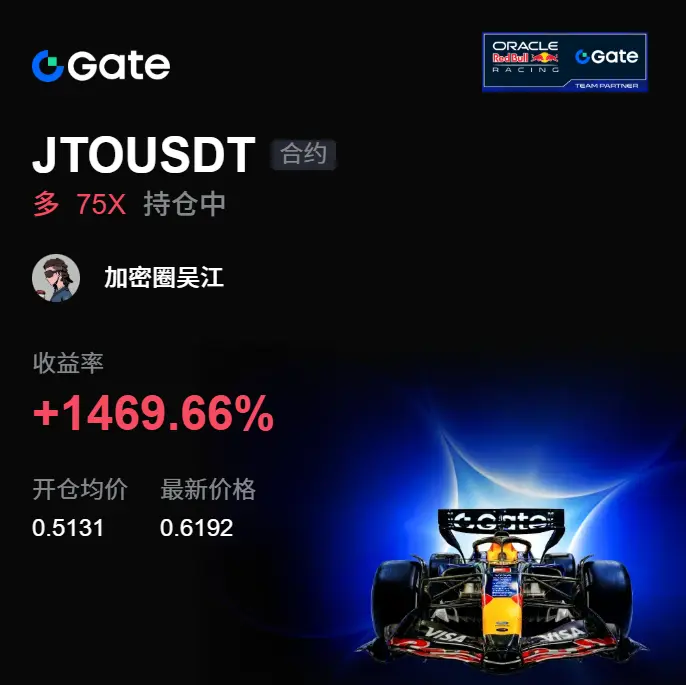
Waking up and straight to being in great spirits! 🔥 A few days ago, during the pre-dawn session when the price was grinding for a bottom, a lot of people got churned back and forth until they were completely fed up, but I kept watching from below—there were always buyers stepping in, and the sell pressure was also getting lighter. $JTO This long position’s rhythm was very clear.
Some money isn’t made by impulsiveness.
Back then, around 0.5131, you got the chance. Now it’s at 0.6212, and the profit is already +1489.03%. 🎉📈 This bite of meat has been a comfortable one to take—when you step o
JTO1.92%
BTC-0.05%
ETH0.99%
View Original
post-image
  • Reward
  • Comment
  • Repost
  • Share
Defending Champions Argentina—experience is the real trump card
After reaching the World Cup semifinals, many people began to worry that Argentina’s squad is too old, but the deeper into the tournament the more experience often matters than youth.
As defending champions, Argentina has major-tournament experience that the other three teams don’t. From the knockout stage onward, they have demonstrated an exceptionally strong ability to adapt to adversity against teams such as Cape Verde, Egypt, and Switzerland.
Although Messi is no longer young, his passing, playmaking, and ability to read t
View Original
post-image
post-image
  • Reward
  • Comment
  • Repost
  • Share
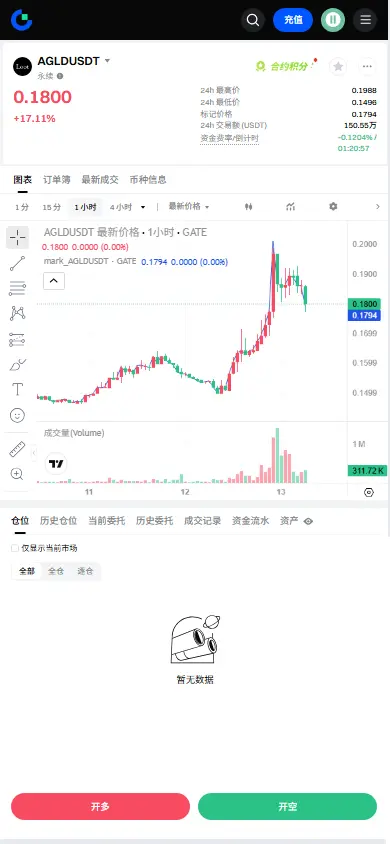
$AGLD Signal】Go long | Negative funding squeeze + 1H support
$AGLD The bulls are blocked at 0.1928; the 1H RSI has fallen back to 61. The funding rate of -0.11% shows shorts are crowded. Buy-side depth is higher than 1.18, with a dense cluster of limit orders near 0.181. The 4H Bollinger upper band at 0.1844 creates short-term pressure, but EMA20 (0.1772) provides a buffer. At this level, the risk-reward is still acceptable, and the bulls’ willingness to defend is clear.
🎯 Direction: Go long
⚡ Entry / orders: 0.181952 - 0.182500
🛑 Stop-loss: 0.180675
🚀 Target 1: 0.185237
🚀 Target 2: 0.1
AGLD15.12%
LAB-28.52%
BTC-0.07%
ETH0.95%
SOL0.18%
View Original
post-image
  • Reward
  • Comment
  • Repost
  • Share
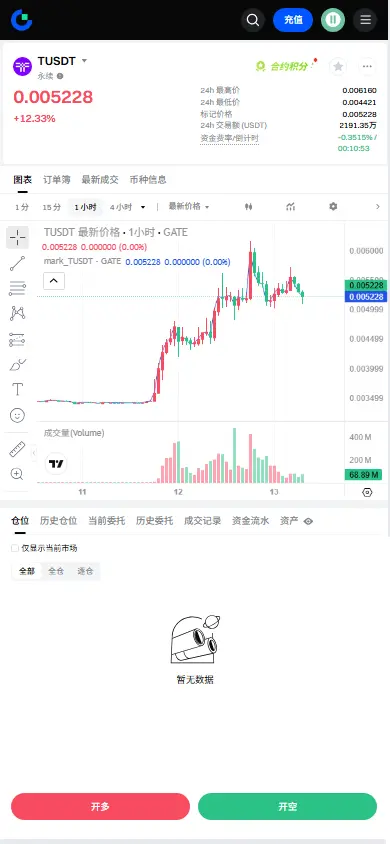
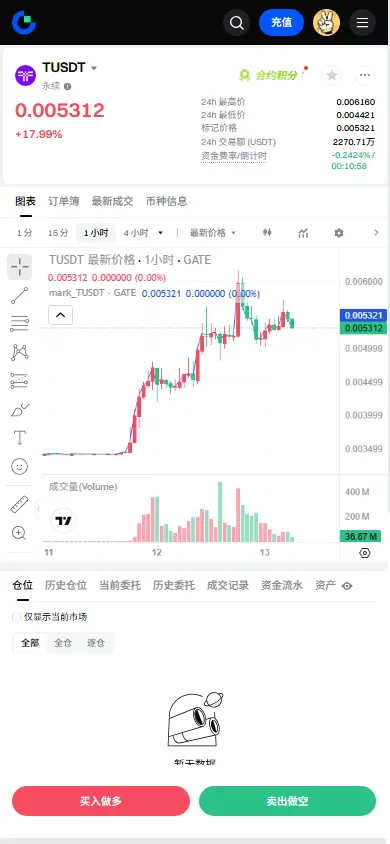
【$T Signal】Go long + negative funding rate squeezes shorts
$T 1H MACD bearish histogram expands, but the 4H Bollinger middle band support at 0.0042 remains effective. The funding rate is -0.199%, setting an extreme low, yet shorts piling up still can’t drive the price down. Buy-side depth at 1.09 shows dense order intake below. Around 0.00531, the placed order thickness is 4.26%, with clear signs of funding support.
🎯 Direction: long
⚡ Entry / limit orders: 0.00529606 - 0.00531200
🛑 Stop loss: 0.00504640
🚀 Target 1: 0.00571040
🚀 Target 2: 0.00590960
🛡️ Trade management:
- Execution strat
LAB-28.52%
BTC-0.07%
ETH0.95%
SOL0.18%
View Original
post-image
  • Reward
  • Comment
  • Repost
  • Share
France has the best chance to become champion! Most balanced in both attack and defense—the World Cup could belong to the “Les Bleus” again
The four teams for the 2026 U.S.-Canada-Mexico World Cup semifinals have all been determined: France, Spain, England, and Argentina. This is also, at present, the strongest group of four teams in overall world football.
If I had to choose a champion, I would favor France more. The consistency France has shown throughout their run is impressive. No matter whether they faced Sweden, Paraguay, or Morocco, they were able to firmly control the game’s tempo. On
View Original
post-image
post-image
  • Reward
  • 16
  • Repost
  • Share
CoinRelyOnUniversal:
Get on board now! 🚗
View More
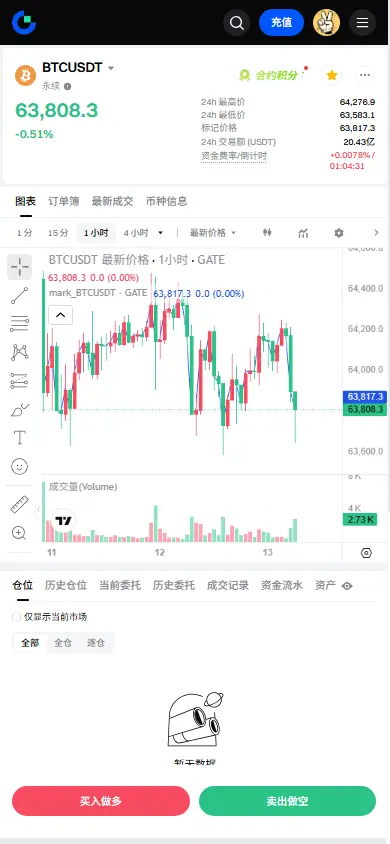
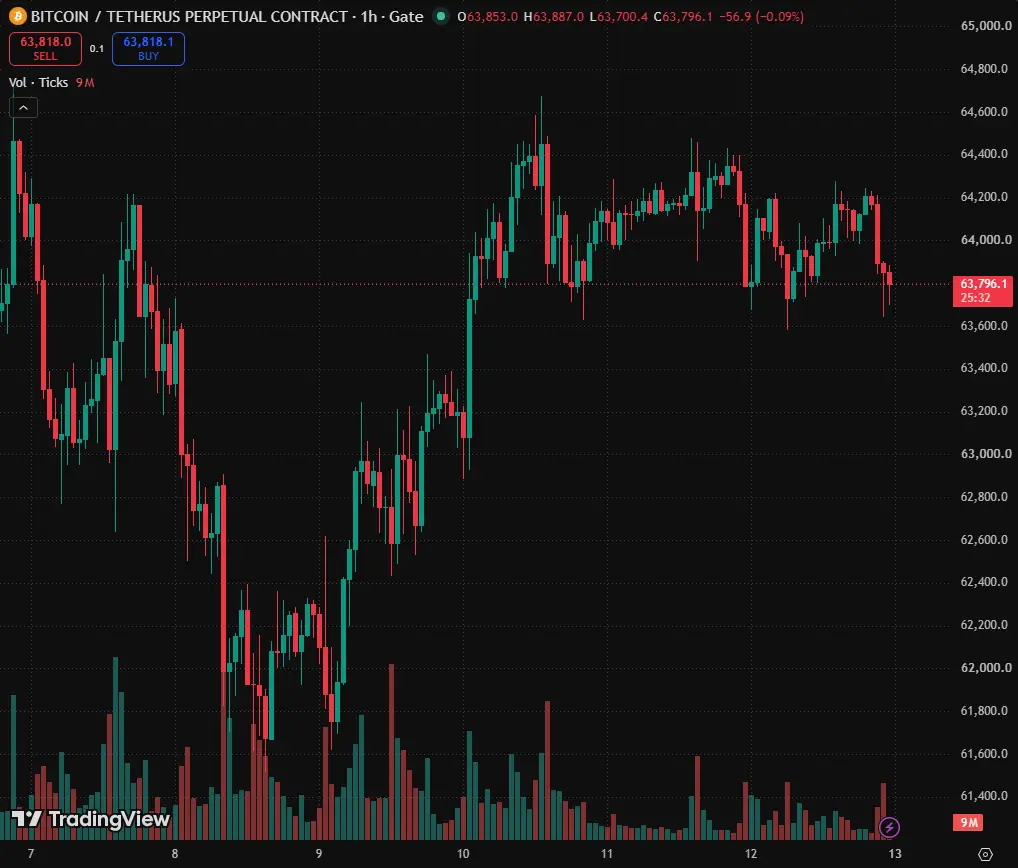
$BTC | 1h | Pullback Rejection Short
Bias: Short
Entry Zone: 63820 to 64020
Stop Loss: 64520
Targets:
TP1: 63280
TP2: 62920
TP3: 62480
Invalidation:
Close above 64150
Why This Setup:
I’m shorting the rejection after BTC failed to hold above the 64k area and is rolling back into intraday support. The recent structure is still heavy, and if sellers keep control below 64.1k, I expect a continuation move toward the prior lows.
BTC-0.05%
post-image
  • Reward
  • Comment
  • Repost
  • Share
Layout Bitcoin, Ethereum, Dogecoin
gate liveLIVE
3,078
  • Reward
  • 8
  • Repost
  • Share
twhm1981:
BTC GT ETH BTC GT ETH BTC GT
View More
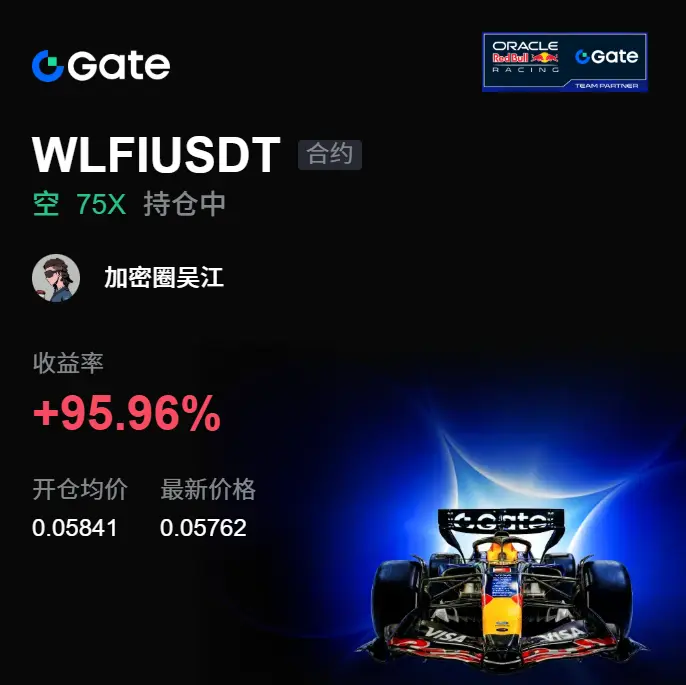
Woke up feeling great—📢📉! A few days ago, in my last glance before bed, $WLFI was still pretending to be strong. I pulled it up, but there wasn’t any volume. Every time it tried to surge, it was short by one breath. Back then, I reminded myself not to get lured into longs and follow the crowd. Being in a short position is more comfortable than chasing a breakout.
Bought from 0.05841, and now at 0.05762—🔥✅ the chart finally stopped pretending: +95.96% realized. This “profit” was eaten comfortably; everyone on the car should’ve woken up laughing 😎.
When it’s time to take the profit, don’t p
WLFI-1.12%
BTC-0.05%
ETH0.99%
View Original
post-image
  • Reward
  • Comment
  • Repost
  • Share
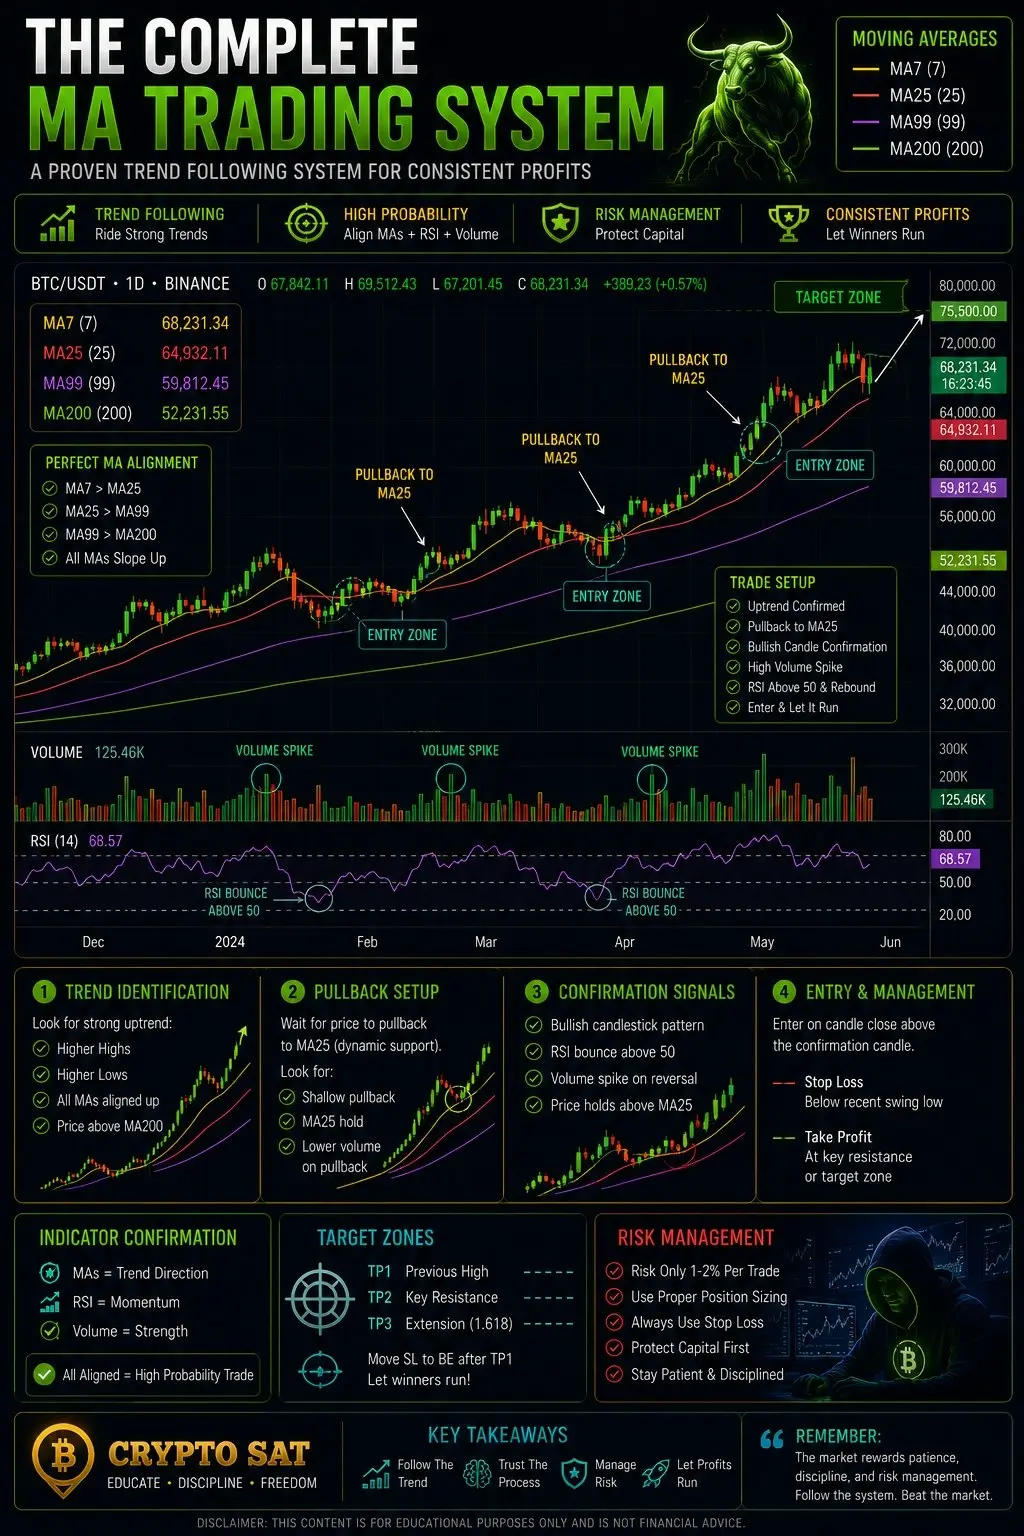
Most traders spend years searching for the "perfect indicator."
The truth?
Profitable trading rarely comes from a single indicator.
It comes from combining trend, momentum, volume, and risk management into one repeatable system.
This is the exact framework many professional traders use when analyzing $BTC and other crypto markets.
🔹️ Step 1: Trend Identification
Before entering any trade, determine the market direction.
I use:
▫️ MA7 = Short-term momentum
▫️ MA25 = Active trend
▫️ MA99 = Mid-term structure
▫️ MA200 = Macro direction
For a bullish market, I want to see:
🟢 MA7 above MA25
🟢 M
post-image
CryptoSat
One of the biggest mistakes traders make is chasing green candles.
By the time they enter, the move is already extended.
Professional traders often do the opposite.
They wait for the pullback.
And one of the simplest ways to identify pullbacks is by using Moving Averages.
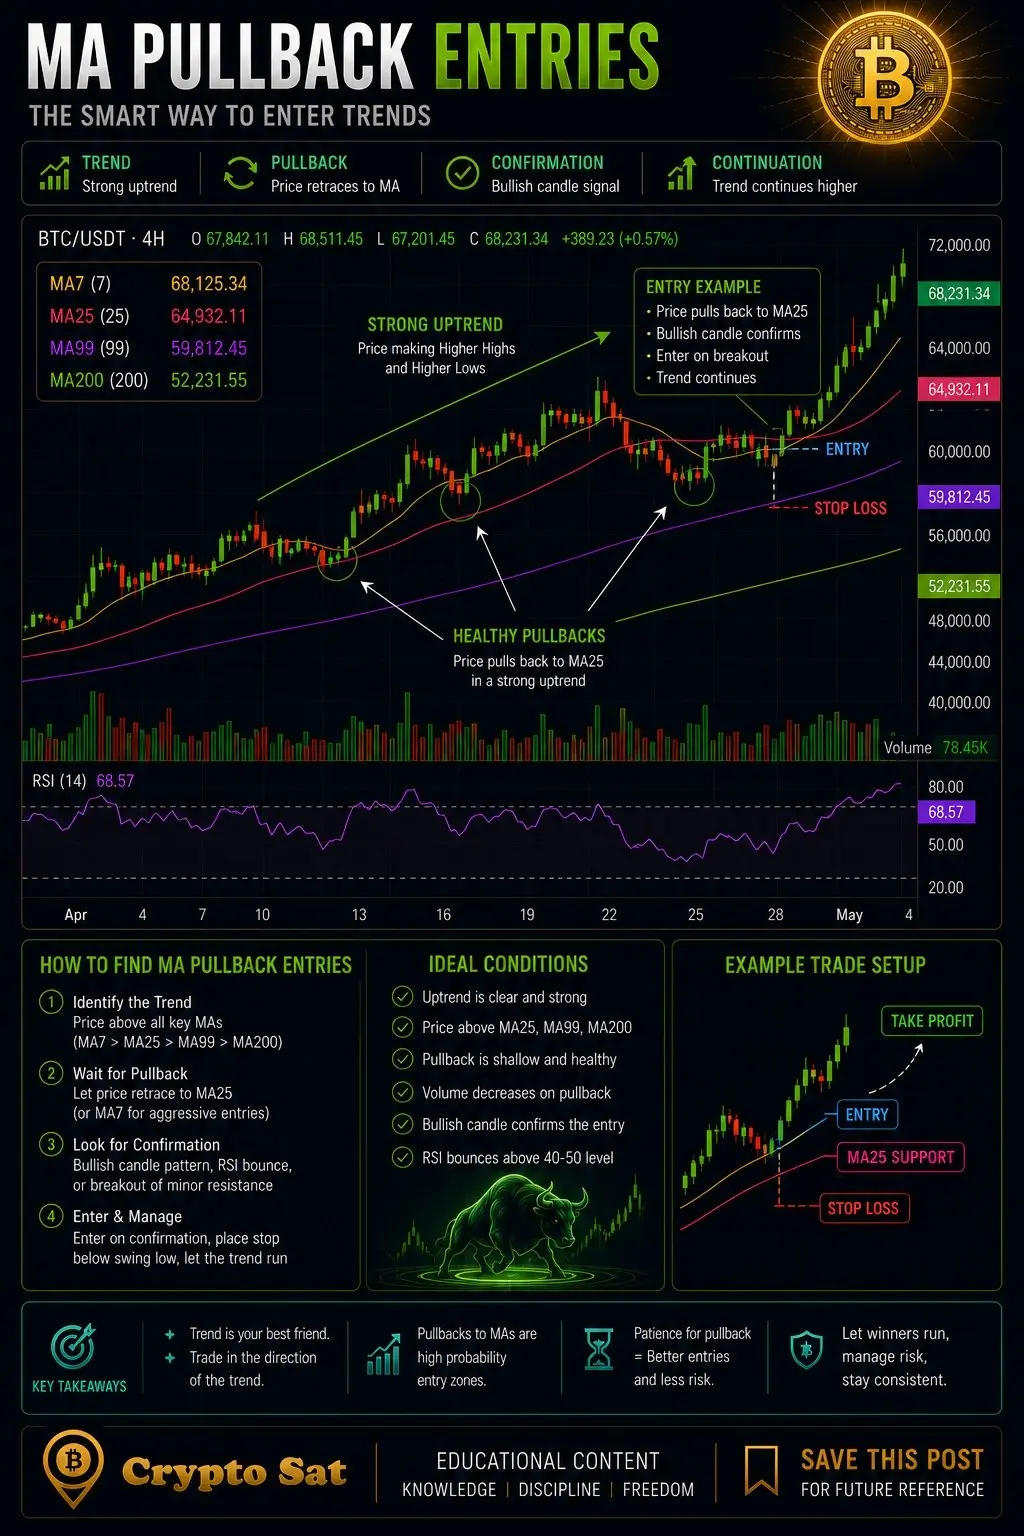
🔹️ What Is an MA Pullback Entry?
An MA pullback entry occurs when price retraces back into a key Moving Average during an existing trend.
Instead of buying the breakout, traders wait for price to return to areas such as:
▫️ MA7 during strong momentum
▫️ MA25 during healthy trends
▫️ MA99 during deeper corrections
The goal is simple:
Join the trend at a better price.
📊 Trend Continuation First
MA pullbacks work best when the trend is already established.
For example:
If $BTC is making:
▪️ Higher highs
▪️ Higher lows
▪️ Trading above MA25 and MA99
Then a pullback into MA25 is often a sign of trend continuation rather than weakness.
The market is simply taking a pause before the next move.
⚠️ Don't Buy the Touch
A common beginner mistake is entering the moment price touches an MA.
Professional traders wait for confirmation.
Look for:
▫️ Bullish engulfing candles
▫️ Strong rejection wicks
▫️ Higher low formations
▫️ Increased buying volume
The Moving Average identifies the zone.
The candle confirms the entry.
🎯 Practical BTC Example
Imagine #BTC rallies from 100K to 105K.
Instead of chasing the breakout, you wait.
Price pulls back into MA25.
A bullish candle forms and buyers defend the level.
That confirmation provides a much cleaner entry than buying the top of the move.
🛡️ Risk Management Matters
Every setup can fail.
That's why experienced traders always define risk.
▪️ Place stop-loss below the invalidation level
▪️ Avoid oversized positions
▪️ Never assume support will hold
A good entry means nothing without proper risk management.
📌 The best traders don't chase momentum.
They wait for the market to come back to them.
That's the power of MA pullback entries.
repost-content-media
  • Reward
  • Comment
  • Repost
  • Share
【$T Signal】Long + negative funding rate squeeze + 1H buy-side impulse
$T Funding rate -0.199%. Shorts are continuously paying. In the last 1H candle, the bullish surge breaks out with heavy volume, and the buy ratio spikes to 0.53. The Bollinger Bands widen, and price holds above the midline. On 4H, the MACD histogram shrinks, but the fast line remains above the zero axis; the multi-timeframe structure has not reversed. Buy depth is 1.09, with clear resting orders underneath. After momentum briefly exhausts, it re-accumulates; in this structure, short covering often accelerates.
🎯 Direction
LAB-28.52%
BTC-0.05%
ETH0.99%
SOL0.20%
View Original
post-image
  • Reward
  • Comment
  • Repost
  • Share
WORLD CUP PREDICTION
gate liveLIVE
944
  • Reward
  • Comment
  • Repost
  • Share
【$DODO Signal】Negative fee rate short-squeeze + 1H strong long momentum
$DODO 1H RSI surged to 91; no buy-side gap has appeared. 4H MACD histogram keeps expanding, with dense orders around 0.0232, fully exposing the fund-backing intention. Negative fee rate -2% combined with stable OI means the short-squeeze structure is still fermenting.
🎯Direction: Go long
⚡Entry/limit orders: 0.023130 - 0.023200
🛑Stop loss: 0.022040
🚀Target 1: 0.024940
🚀Target 2: 0.025810
🛡️Trade management: After reaching Target 1, cut 50% of the position and move the stop loss up to break-even. If price falls back t
LAB-28.52%
BTC-0.07%
ETH0.95%
SOL0.18%
View Original
post-image
  • Reward
  • Comment
  • Repost
  • Share
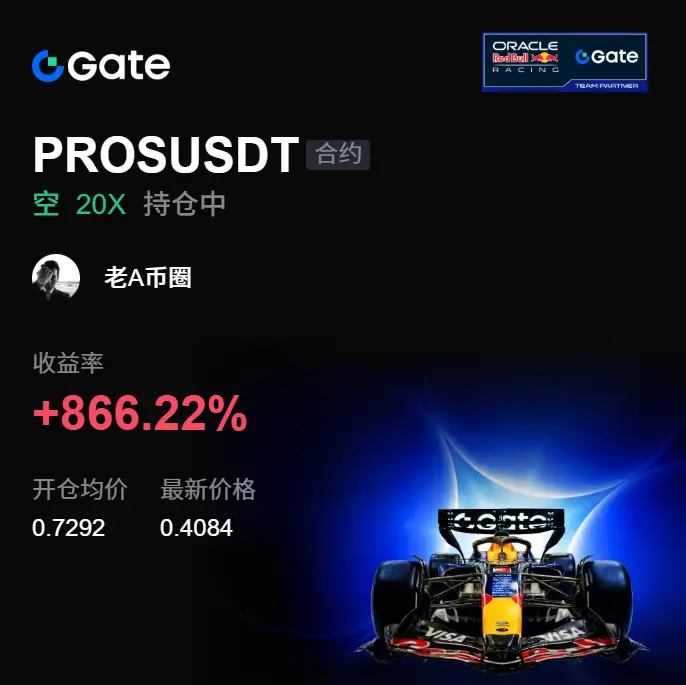
This sell-off just now provided the answer. The pressure near the highs before wasn’t just intimidation—it was real selling/offloading by someone.
$PROS is holding sideways in that band above. I’ve always felt something was off: the price didn’t look like it dropped, but the rebound strength has been weaker every time. A lot of people are still hesitating about whether to chase more longs—this is the key point: the market has started moving against expectations. After going short around 0.7292, I was waiting for this leg to confirm it.
It’s now around 0.4084. The unrealized position profit sho
PROS-0.77%
BTC-0.05%
ETH0.99%
View Original
post-image
  • Reward
  • Comment
  • Repost
  • Share
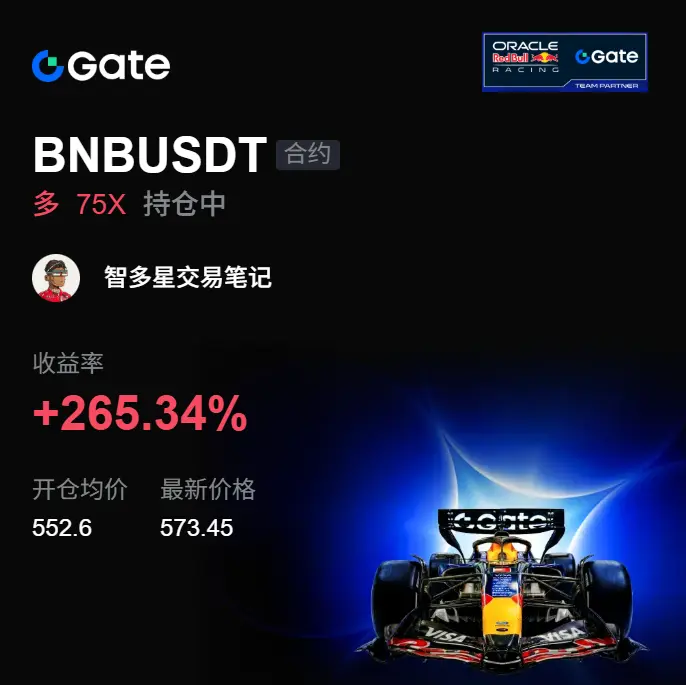
A few days ago, while I was watching the chart, I actually noticed some changes. The $BNB pullback didn’t keep getting dumped—instead, bids/support at the lower levels slowly started to show up. Back then, I didn’t say too much; I just felt that the 552.60 area was worth watching—at least it wasn’t the kind of market that collapses the moment you touch it.
Later, when BNB pushed higher, the price moved from 552.60 to 573.1. This stretch of long positions basically delivered the response—+262.77% has already come through. There was also some hesitation in between, especially the first time it s
BNB-0.11%
BTC-0.05%
ETH0.99%
View Original
post-image
  • Reward
  • Comment
  • Repost
  • Share
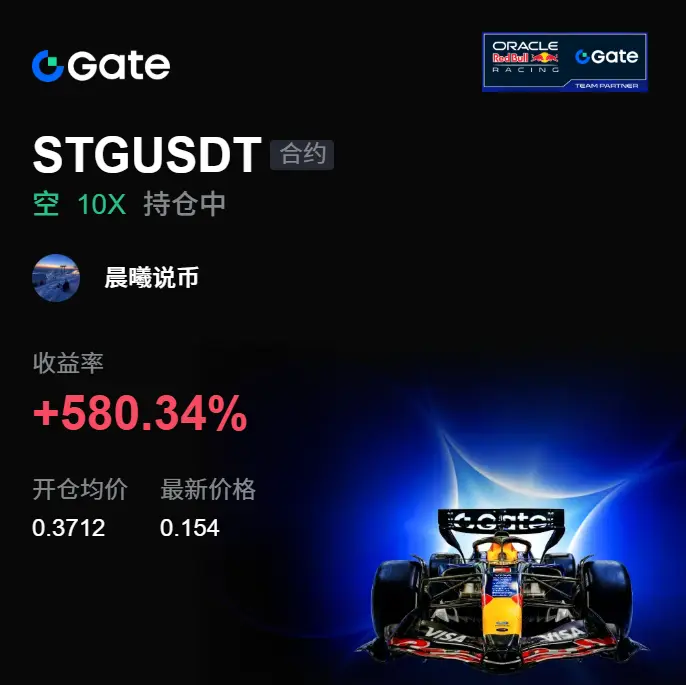
What caught my attention most is what changed after $STG failed to bounce back. On the surface, it looks only like a pullback, but in the details you can see that the follow-on buying has started to weaken.
My view is that after being pressured at a high level, if the price keeps failing to stand back in the key zone for a long time, the risk will be magnified. After entering at 0.3712, as the price moved to 0.154, the market’s response became relatively clear.
This return of +580.34% wasn’t because the market moved smoothly in our favor; it happened because we patiently waited for the structu
STG-0.64%
BTC-0.05%
ETH0.99%
View Original
post-image
  • Reward
  • Comment
  • Repost
  • Share
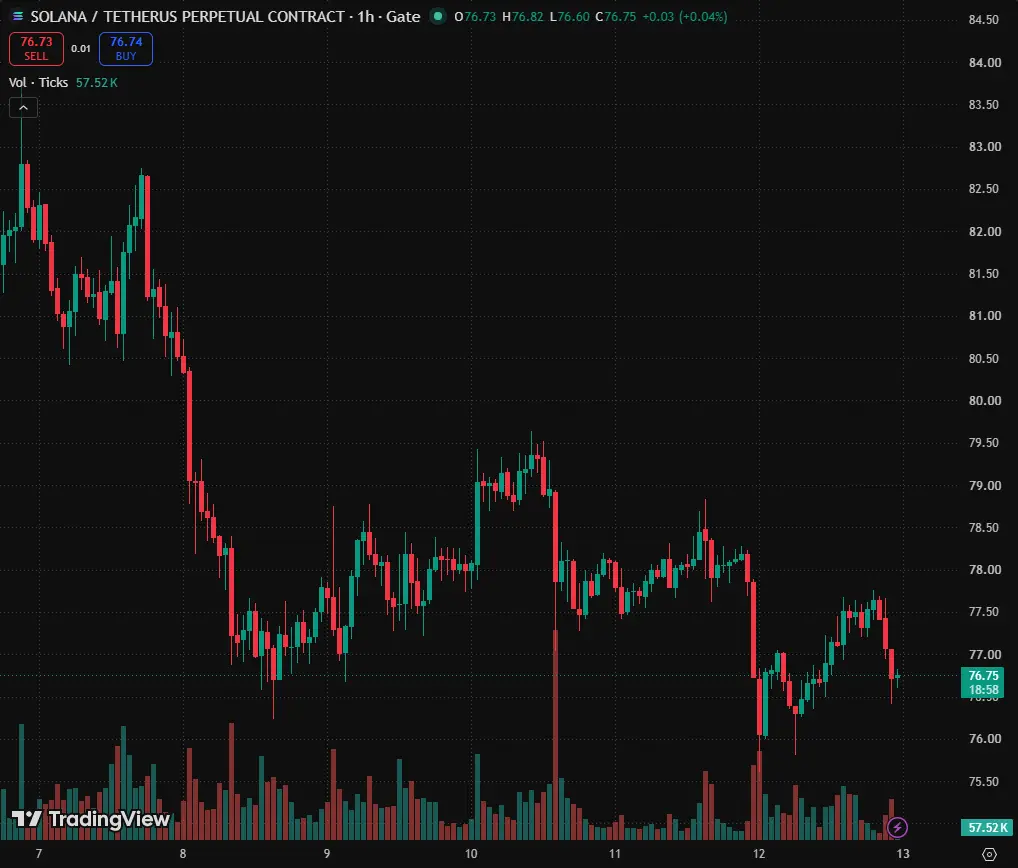
$SOL | 1H | Breakdown Retest Short
Bias: Short
Entry Zone: 76.90 to 77.20
Stop Loss: 77.86
Targets:
TP1: 76.10
TP2: 75.25
TP3: 74.40
Invalidation:
Close above 77.86
Why This Setup:
I’m shorting the failed recovery beneath the 77.50 resistance area after the sharp selloff. Price is still making lower highs on the 1H, and a clean rejection from this zone keeps the bearish structure intact.
SOL0.20%
post-image
  • Reward
  • Comment
  • Repost
  • Share
After seeing TermMaxFi’s update today, my first impression is that this move is kind of interesting.
They now support using assets like Royco: on the platform you can borrow fixed-rate USDC, with a maximum limit of one million.
Your borrowing cost can be locked in, so you don’t have to worry about it getting more expensive later.
In DeFi, the word “fixed” is becoming increasingly valuable.
This time, TermMaxFi effectively adds a bit more certainty for users.
Someone like me who doesn’t want to calculate interest rates every day finds it pretty comfortable.
The points system is stil
USDC-0.01%
View Original
post-image
  • Reward
  • Comment
  • Repost
  • Share
Load More

Join 40 M users in our growing community

⚡️ Join 40 M users in the crypto craze discussion
💬 Engage with your favorite top creators
👍 See what interests you
  • Pinned