Share crypto content and earn up to 60% commissions through content mining.
placeholder
gatefun
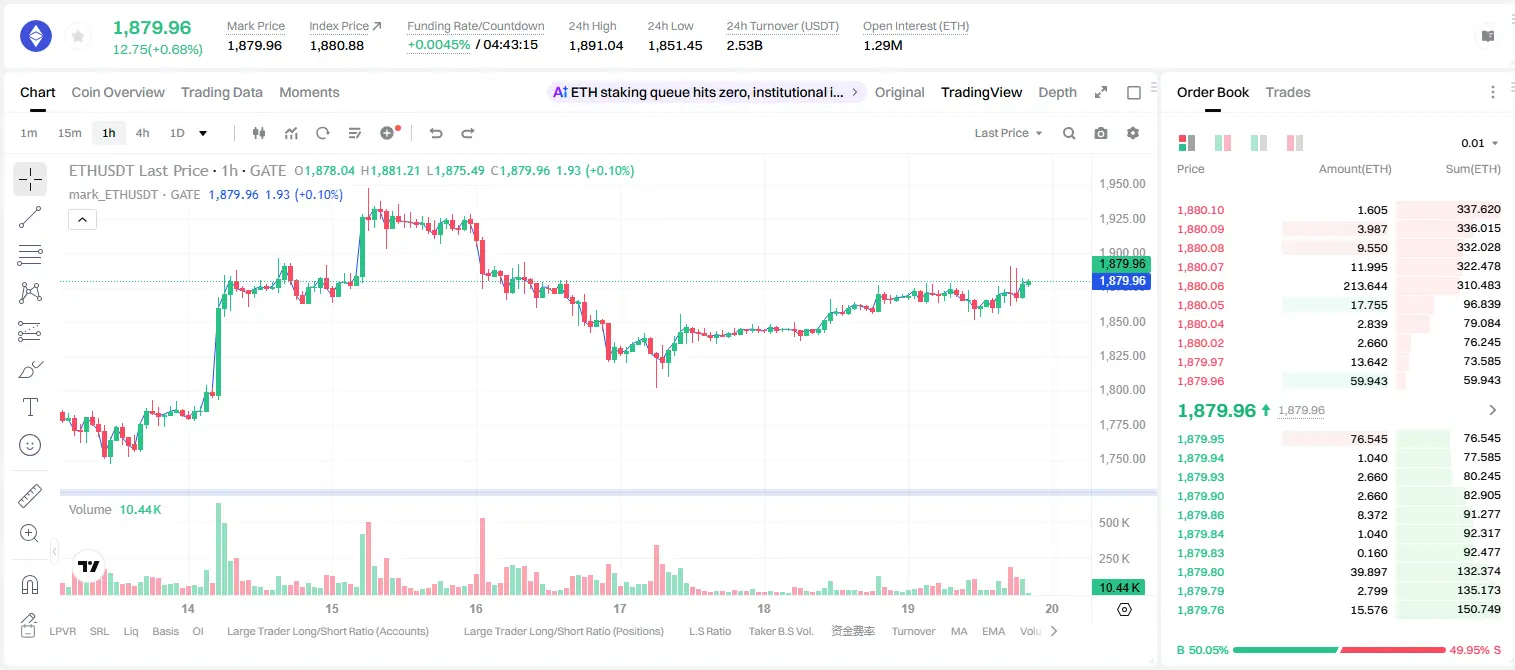
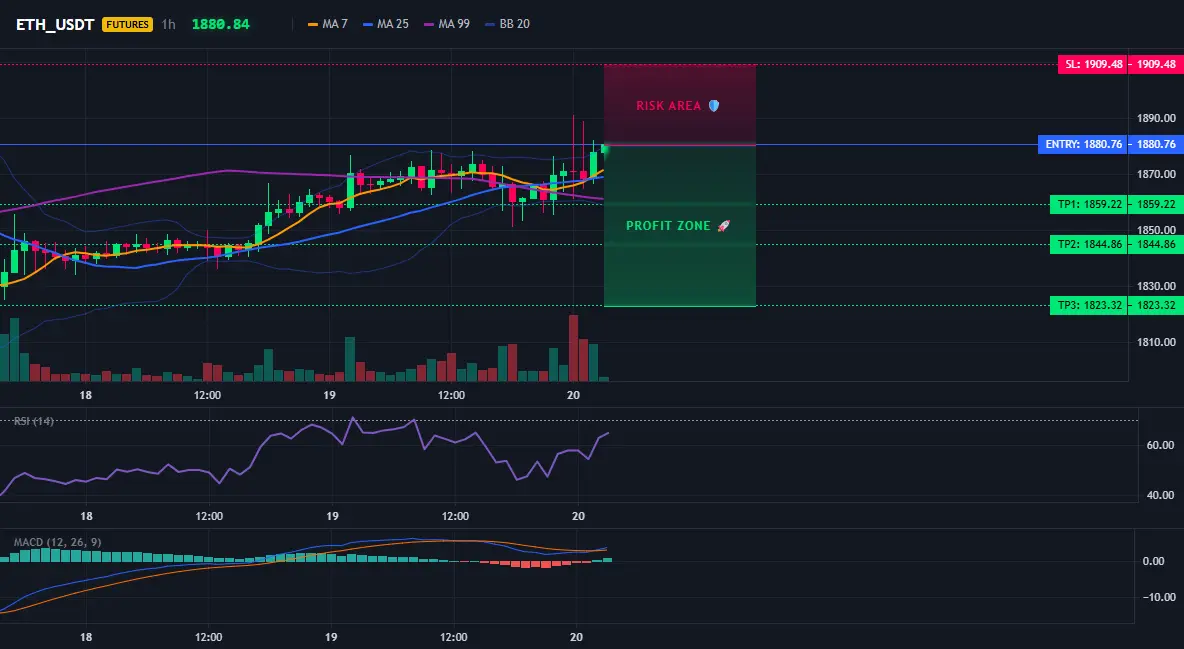
ETH bears are hiding out at 1880—do the bulls still dare to catch the falling knife?
$ETH /USDT - SHORT sell
Trading plan:
Entry: 1877.77 – 1883.75
SL: 1909.48
TP1: 1859.22
TP2: 1844.86
TP3: 1823.32
Why focus on this setup?
- The 4H timeframe signal is clearly SHORT, 55% confidence; the 1D trend is ranging, and overhead resistance is obvious
- Entry at 1880.76, TP1 directly targets 1859; the 15M RSI at 57 is not overbought, and bearish momentum remains
- If you don’t short now, wait for a break below 1880 and then chase? Your cost is higher and the risk-reward is worse
Discussion:
Will this mo
ETH0.53%
View Original
post-image
post-image
  • Reward
  • Comment
  • Repost
  • Share
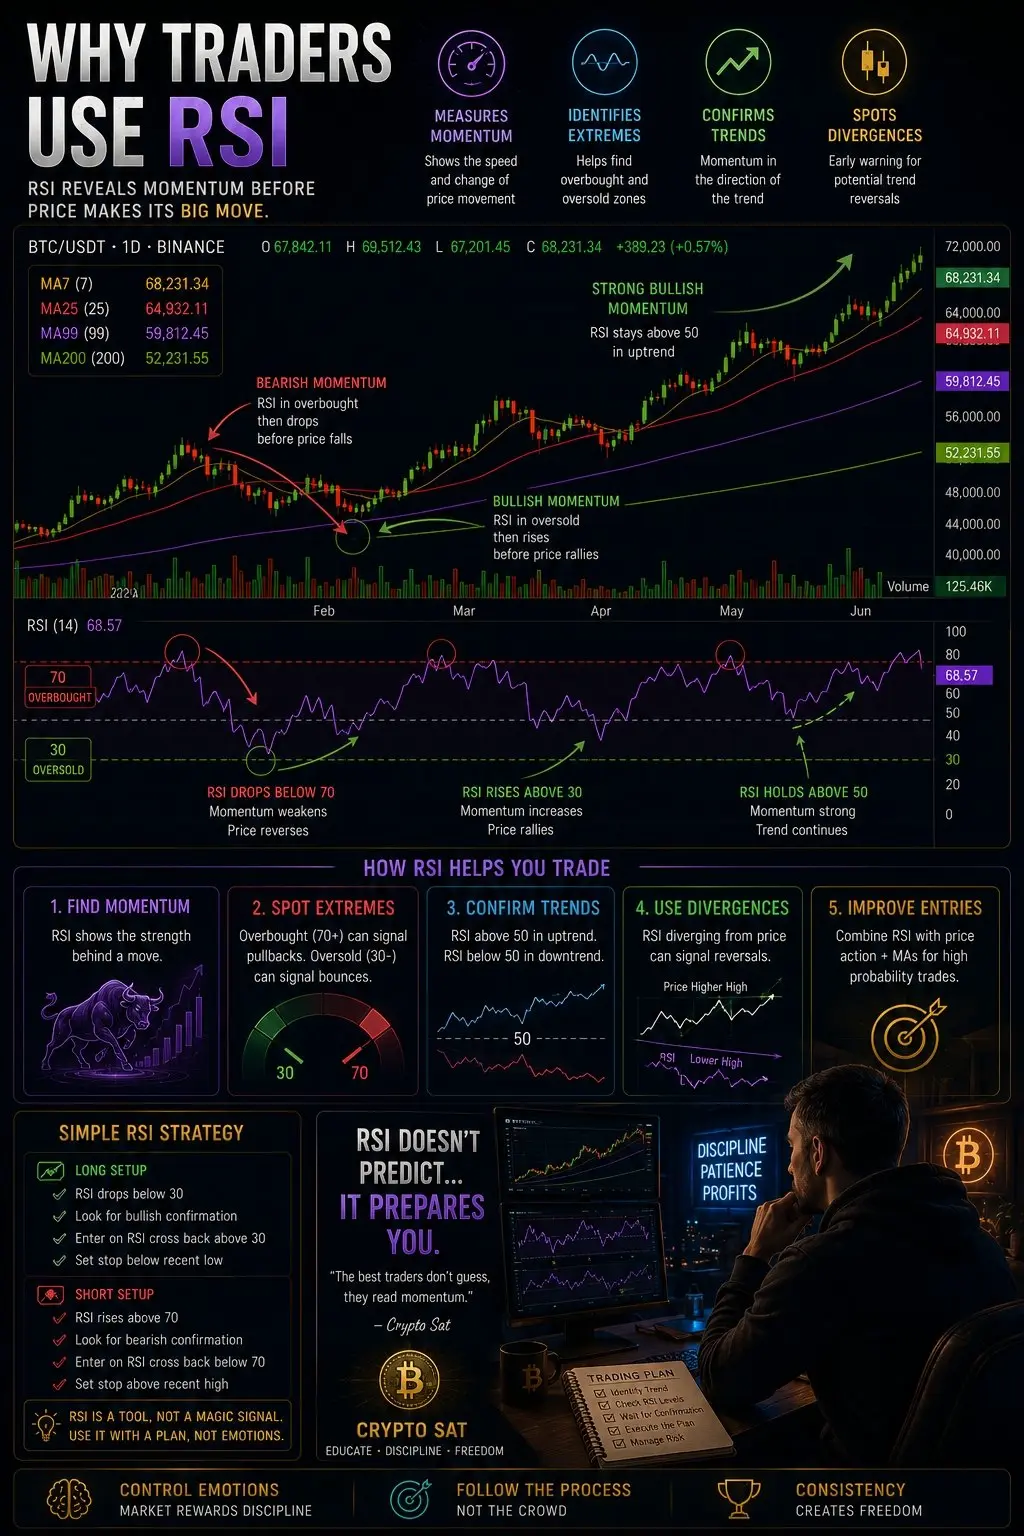
Most beginners see RSI hit 70 and instantly think: " Time to sell "
Then they watch $BTC rally another 10%.
Or they see RSI drop below 30 and buy immediately…
Only to watch the market fall even further.
The problem isn't RSI.
It's misunderstanding what RSI levels actually mean.
Let's break it down.
🔴 RSI 30 – Oversold Zone
When RSI falls below 30, it means selling momentum has become very strong.
But it doesn't automatically mean price will reverse.
For example:
During major BTC corrections, RSI can stay below 30 for several candles while price continues falling.
Instead of blindly buying, a
post-image
CryptoSat
If I could teach every beginner just one indicator, it would be RSI.
Why?
Because price tells you what the market is doing…
But RSI tells you how strong that move really is. 🧠
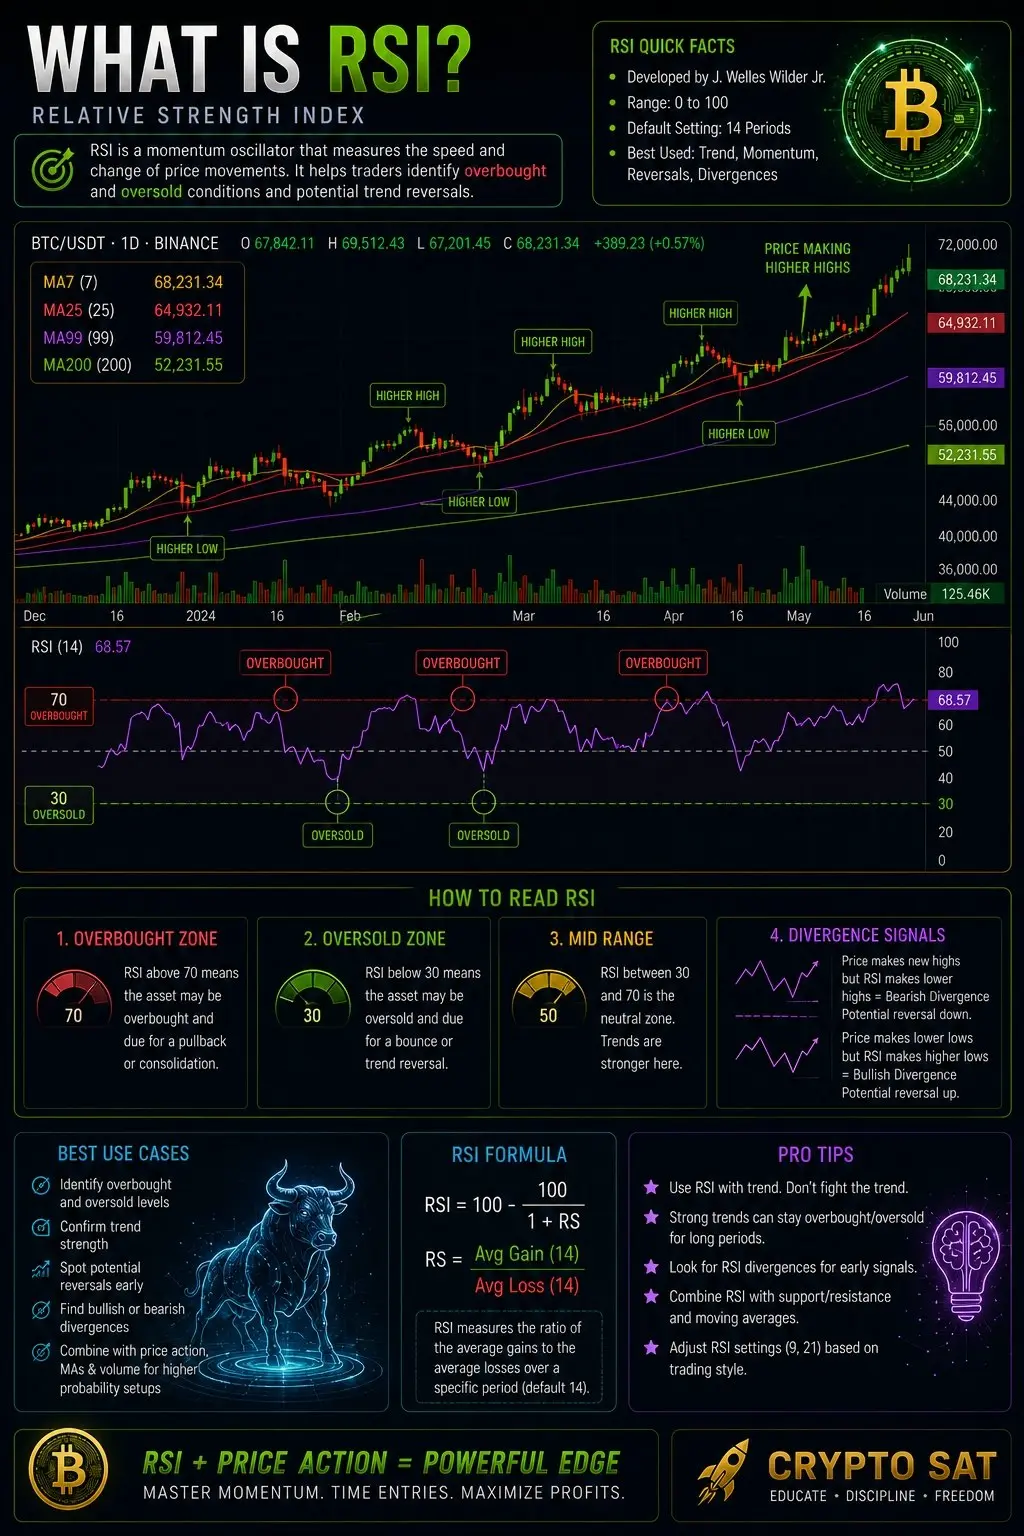
RSI stands for Relative Strength Index.
Simply put, it measures momentum.
It shows whether buyers or sellers currently have more strength.
The RSI scale moves between:
🔹 0 = Extremely weak momentum
🔹 100 = Extremely strong momentum
Most traders pay attention to these levels:
▫️ Above 70 = Market may be overheated or overbought.
▫️ Below 30 = Market may be oversold and losing selling pressure.
But here's the important lesson:
▪️Overbought doesn't automatically mean sell.
▪️Oversold doesn't automatically mean buy.
Momentum can stay strong for much longer than people expect.
📈 Let's use $BTC as an example.
Imagine BTC rallies from $100K to $110K.
Price looks expensive.
Many beginners instantly short because RSI reaches 75.
Then BTC keeps climbing to $115K and liquidates them.
Why?
Because price and momentum are not the same thing.
Price tells you where the market is.
Momentum tells you how aggressively it's moving.
A strong trend can keep RSI elevated for a long time.
This is why professional traders use RSI as a confirmation tool, not a prediction tool.
For example:
🟢 BTC above major Moving Averages + RSI rising above 50
= Bullish momentum supporting the trend.
🔴 BTC losing support + RSI falling below 50
= Momentum weakening.
The best traders don't ask: "Is RSI overbought?"
They ask: "Is momentum supporting my trade idea?"
📌 RSI won't predict the future.
But it will help you understand the strength behind the current move.
And understanding momentum is one of the biggest steps toward becoming a better trader.
Save this post and start looking at momentum differently. 🧠
#PreIPOsSeason2OpenAISubscription
repost-content-media
  • Reward
  • Comment
  • Repost
  • Share
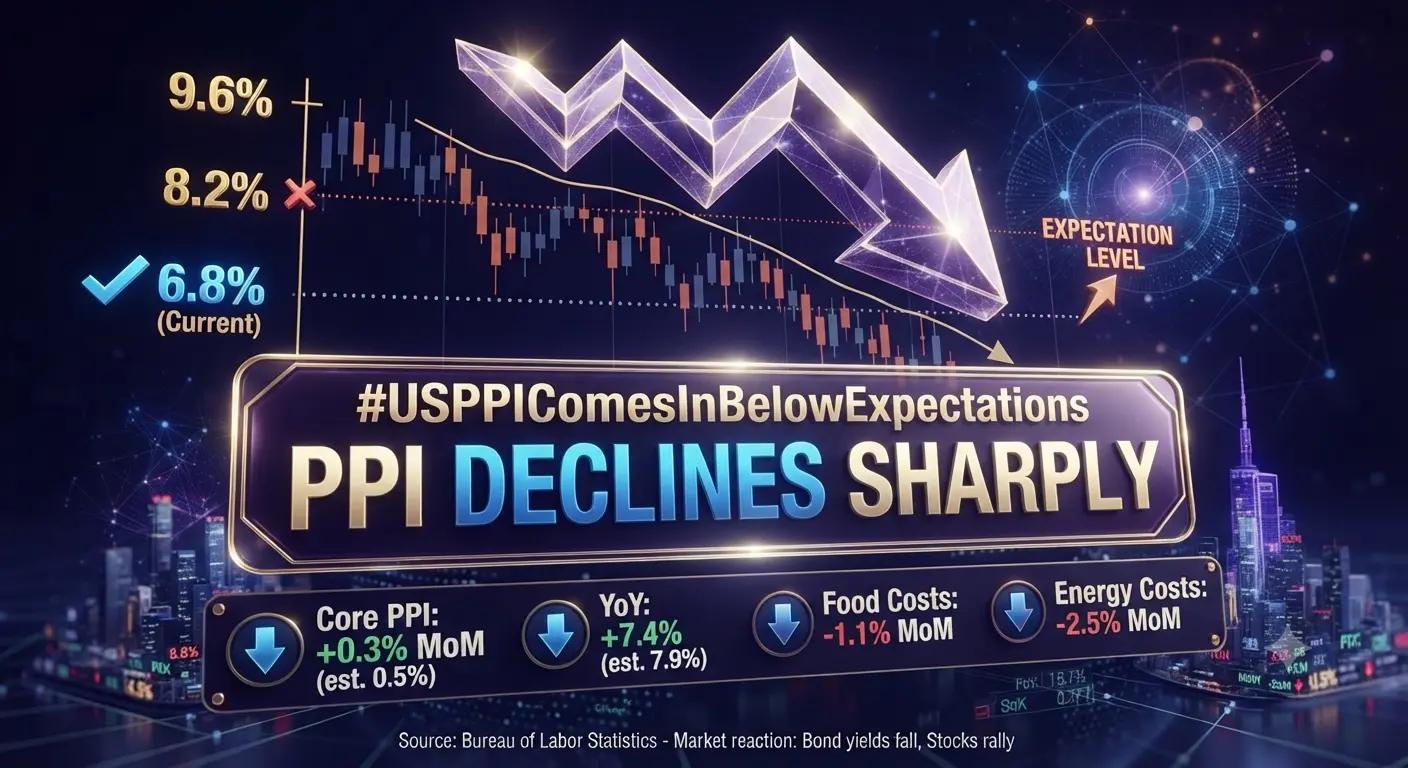
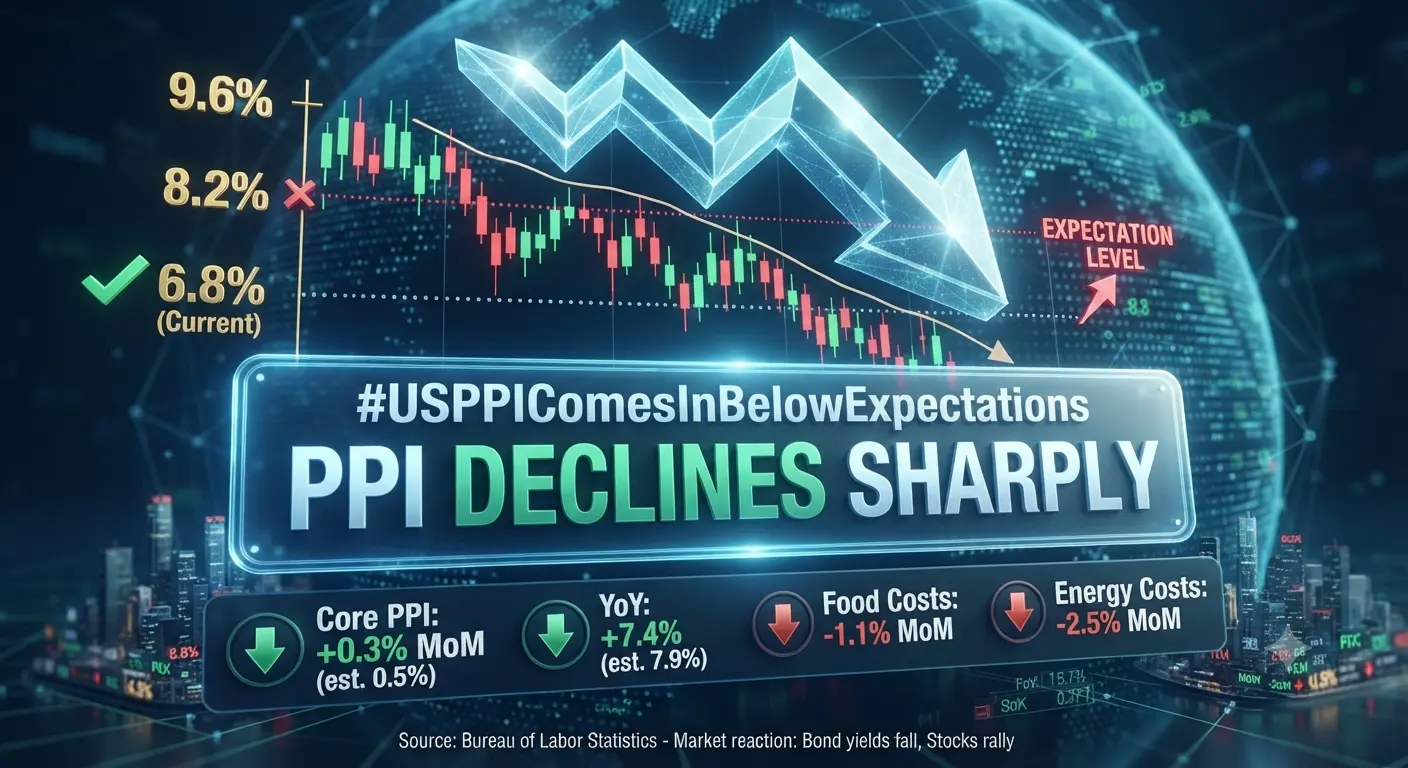
#USPPIComesInBelowExpectations
USPPI Comes in Below Expectations: What It Means for the Market
The latest U.S. Producer Price Index (PPI) came in below market expectations, indicating that inflationary pressure at the producer level is easing. Since PPI measures the average change in prices received by producers for their goods and services, a lower-than-expected reading can be an encouraging sign that overall inflation may continue to cool.
For financial markets, softer PPI data often strengthens expectations that the Federal Reserve may have more flexibility regarding future interest rate d
BTC0.13%
ETH0.56%
post-image
post-image
  • Reward
  • Comment
  • Repost
  • Share
market updates(o|o)
gate liveLIVE
1,489
live-coin
  • Reward
  • Comment
  • Repost
  • Share
🦅 BLACKOUT⚡HAWK⚡CRYPTOBOY
gate liveLIVE
1,805
live-coin
  • Reward
  • Comment
  • Repost
  • Share
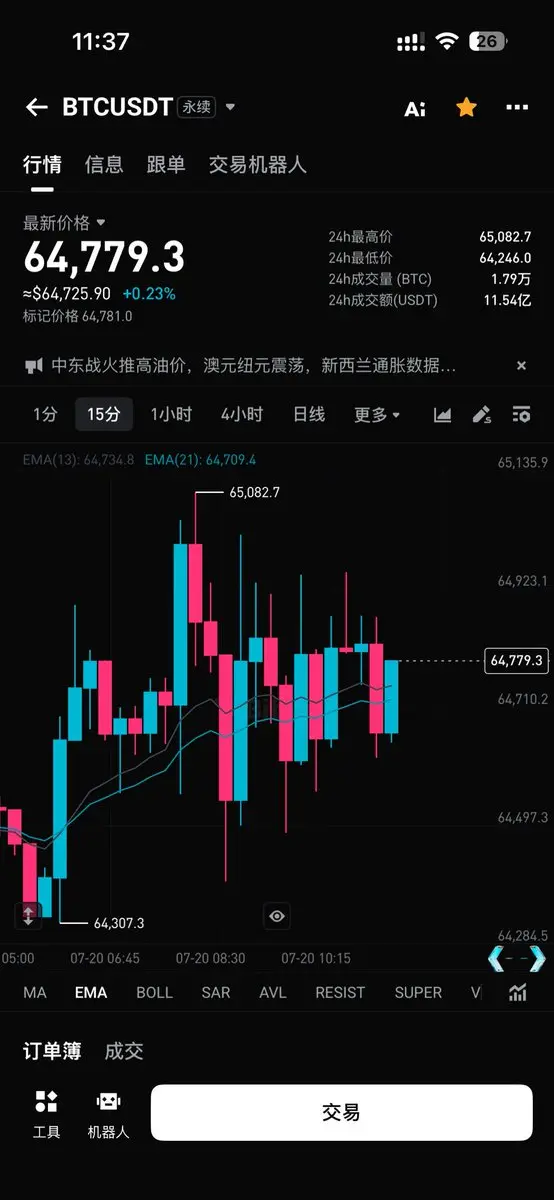
Yunshu 7.20
It surged to challenge the prior high, then wavered and consolidated under pressure after failing to break through. Selling pressure is heavier above; this is an upside washout rather than a trend reversal. As long as support is not broken, maintain a long-side mindset.
Key support: 64,000–64,600. On a pullback to 64,000–64,500, go long. Targets: 65,500 and 66,000. If it breaks through, then further look at 67,500.
The long-term cycle long setup is intact. Short-term consolidation shouldn’t cause panic—keep positions light and control the pace $BTC .
BTC0.13%
View Original
post-image
  • Reward
  • 4
  • Repost
  • Share
GasPeddler:
As long as it doesn’t break through, go more—it's stable.
View More
Early Monday morning, both bulls and bears were fighting viciously.
Let’s do a survey.
Which side are you on?
View Original
post-image
  • Reward
  • Comment
  • Repost
  • Share
If I tell you right now the real background of the #PiNetwork founding team… you definitely won’t regret missing BTC and ETH back then!
You missed BTC because of information asymmetry, you missed ETH because the threshold was too high, and you missed PI… there’s really no excuse!
BTC0.13%
ETH0.56%
PI14.81%
View Original
post-image
  • Reward
  • Comment
  • Repost
  • Share
Yoji says hi!
This is so much fun @finalbosuX !!
post-image
  • Reward
  • Comment
  • Repost
  • Share
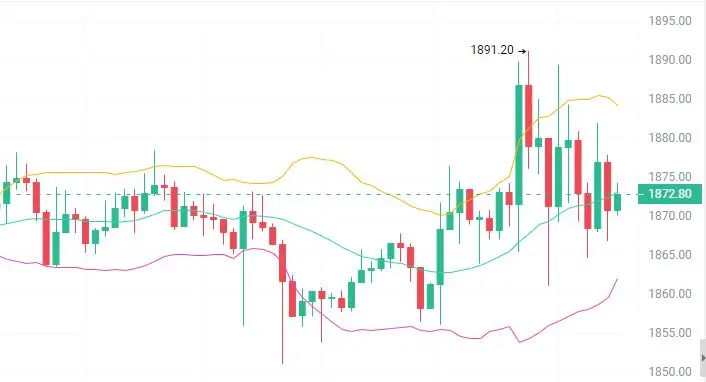
Today’s early-session “two-layer cake” (alt) ideas
Trade plan:
Sell short around 1885–1895.
Target: 1850–1800; set a stop loss.
The rebound strength of the “two-layer cake” is clearly weaker than that of the “big cake,” and price repeatedly fails to break through in the overhead pressure zone, making short-term downside risk higher. The technical outlook is bearish, but note that the current downward momentum has already weakened to some extent; a golden cross is possible on the MACD. Shorting should not be too aggressive. It’s recommended to wait until price once again shows clear rejection a
ETH0.53%
View Original
post-image
  • Reward
  • Comment
  • Repost
  • Share
GM ☀️
Bitcoin spent the entire weekend hovering around the $65,000 level, and as Monday begins, the market is still waiting for a clear directional move. Price action remains range-bound, with traders watching closely for the next breakout or breakdown.
While BTC has been consolidating, the real story is unfolding on-chain.
GateDEX has officially completed its integration with Robinhood Chain, marking another important step in the evolution of blockchain infrastructure. This isn't just another partnership—it's a glimpse into where the industry is heading.
The line between Centralized Finance (
BTC0.13%
post-image
GateSquare
GM. BTC spent the entire weekend trading around 65,000, and on Monday morning it still hadn’t picked a direction. But something on-chain has already landed—GateDEX has fully integrated Robinhood Chain. The fusion of CeFi and DeFi isn’t just a concept anymore; it’s already happening.
repost-content-media
  • Reward
  • 2
  • Repost
  • Share
GateUser-937d9be1:
https://gate.com/post?post_id=22793554&tim=Bg8RABoOXlJHVx1VRiUOAlFaXBgEDhkO0O0O&ref=VFAXBW8LAQ&ref_type=105
View More
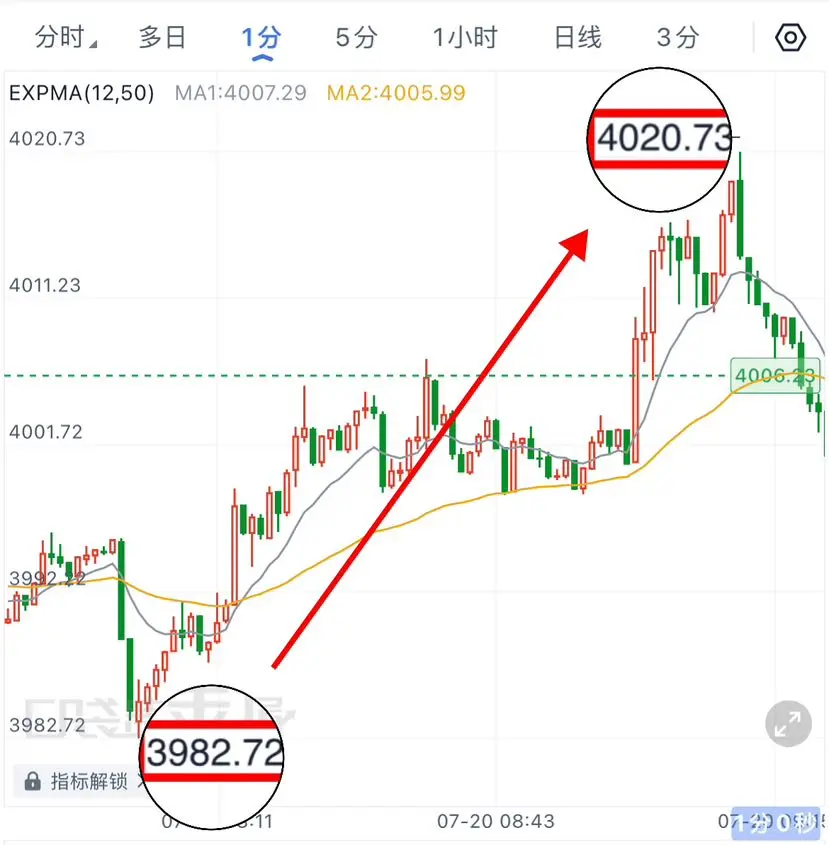
Last weekend, I anticipated that this week’s gold would be weak and range-bound. The price rose from 3982 to 4020, and the price action perfectly matched this week’s analysis.
$XAUT
XAUT0.25%
View Original
post-image
post-image
  • Reward
  • Comment
  • Repost
  • Share
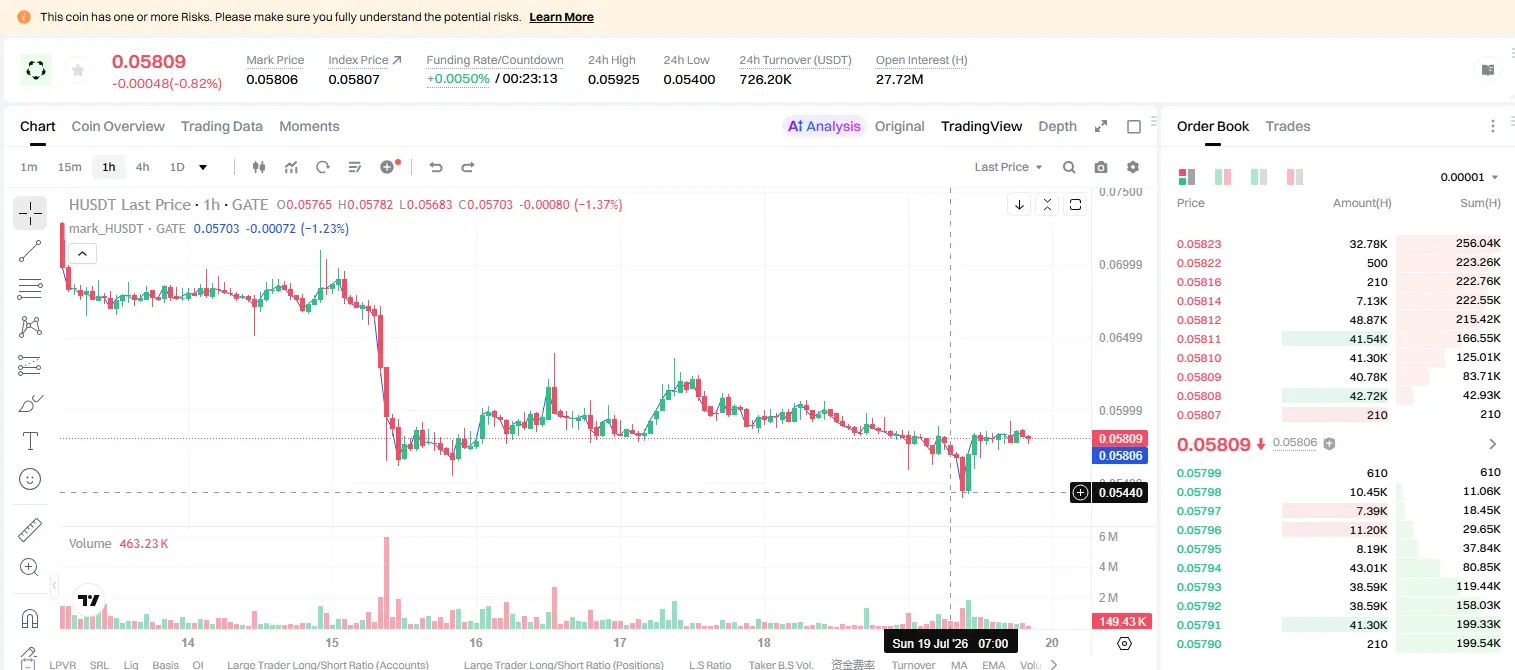
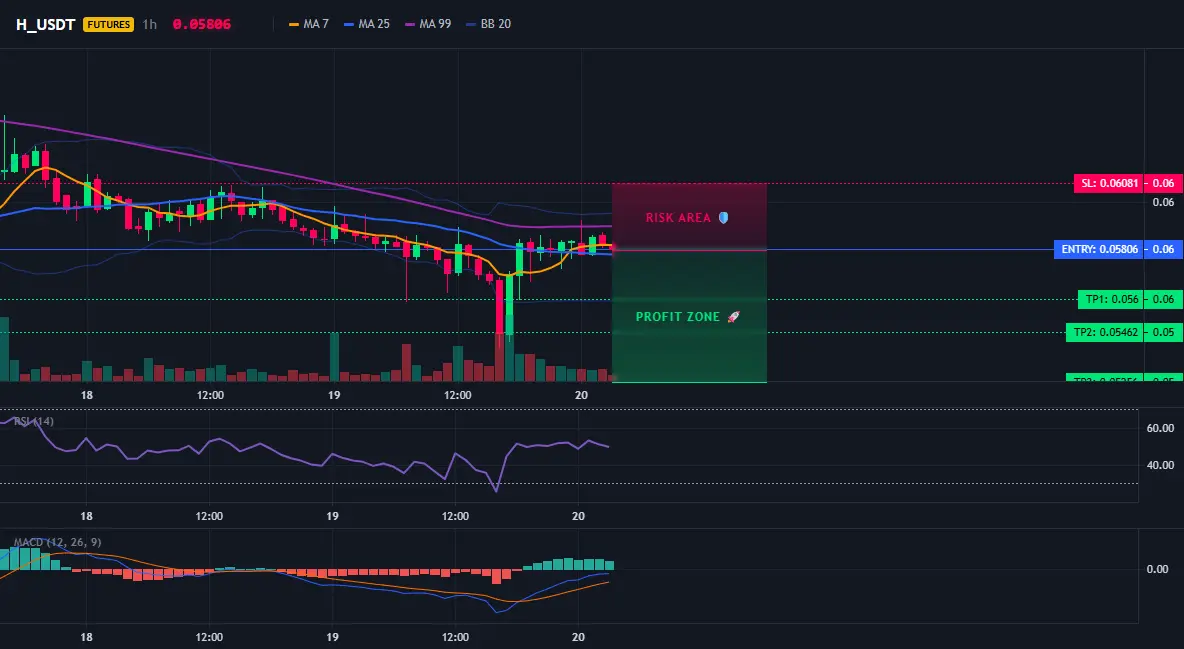
$H /USDT short signal 95%, do you dare to chase it?
$H /USDT - short SHORT
Trading plan:
Entry: 0.05777 – 0.05835
SL: 0.06081
TP1: 0.05600
TP2: 0.05462
TP3: 0.05256
Why focus on this setup?
The 4-hour trend is clearly bearish. The RSI on the 15m chart is 48.59, neutral but on the weak side. The 1-hour ATR is only 0.001146, so volatility is controllable. Current entry is 0.05806, with a step-by-step sell-off target at TP1 0.05600 and TP2 0.05462. Stop loss is 0.06081, and the risk-reward ratio is above 1:2. Why now? The daily chart is bearish and suppressing price; rebounds are weak—this is the
H-0.15%
View Original
post-image
post-image
  • Reward
  • Comment
  • Repost
  • Share
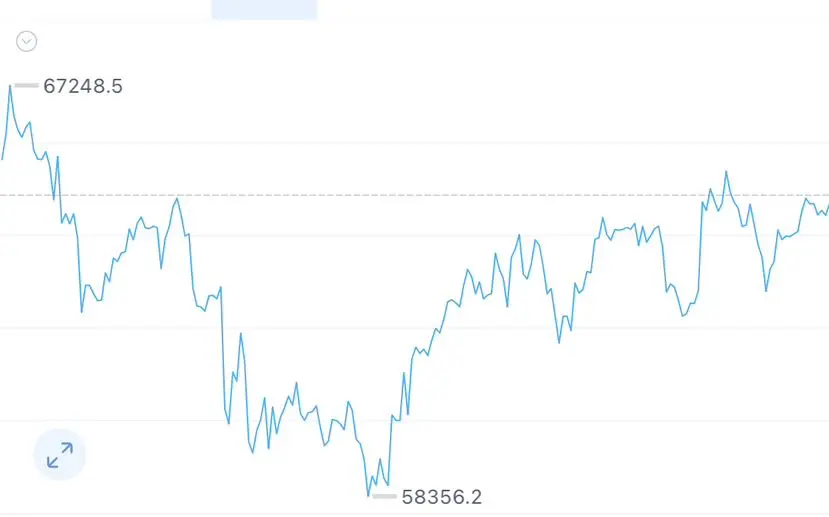
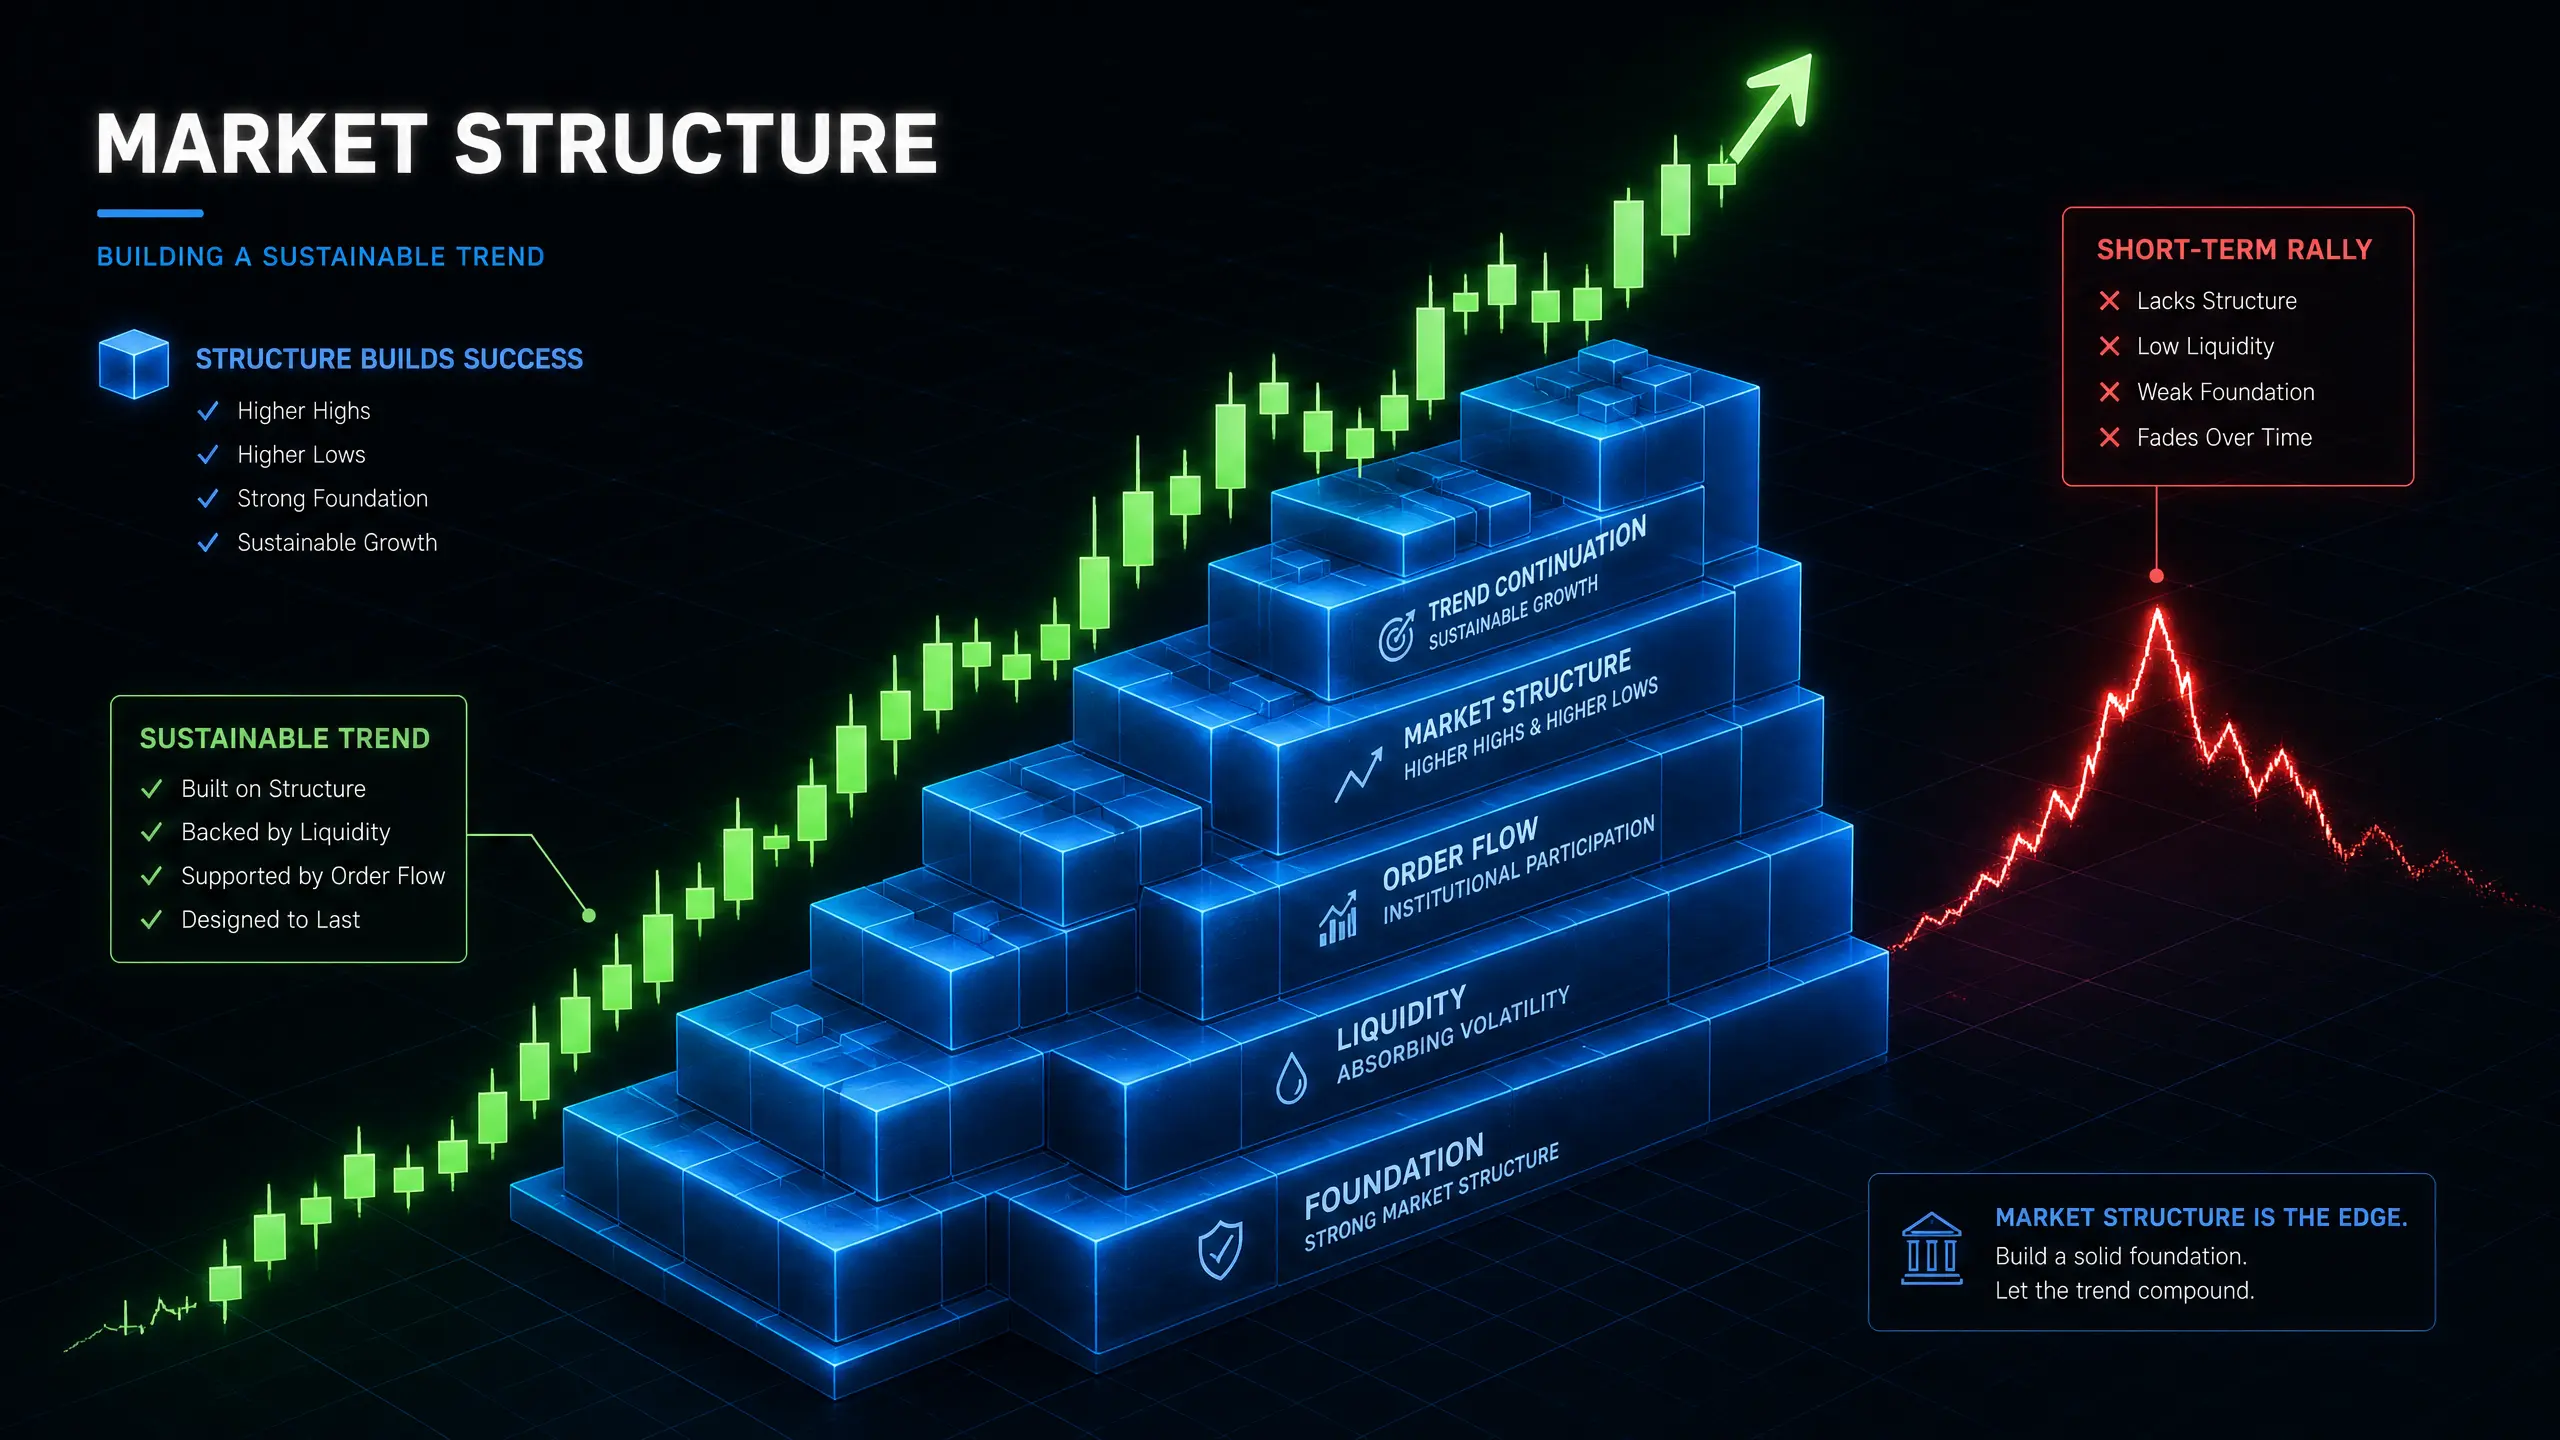
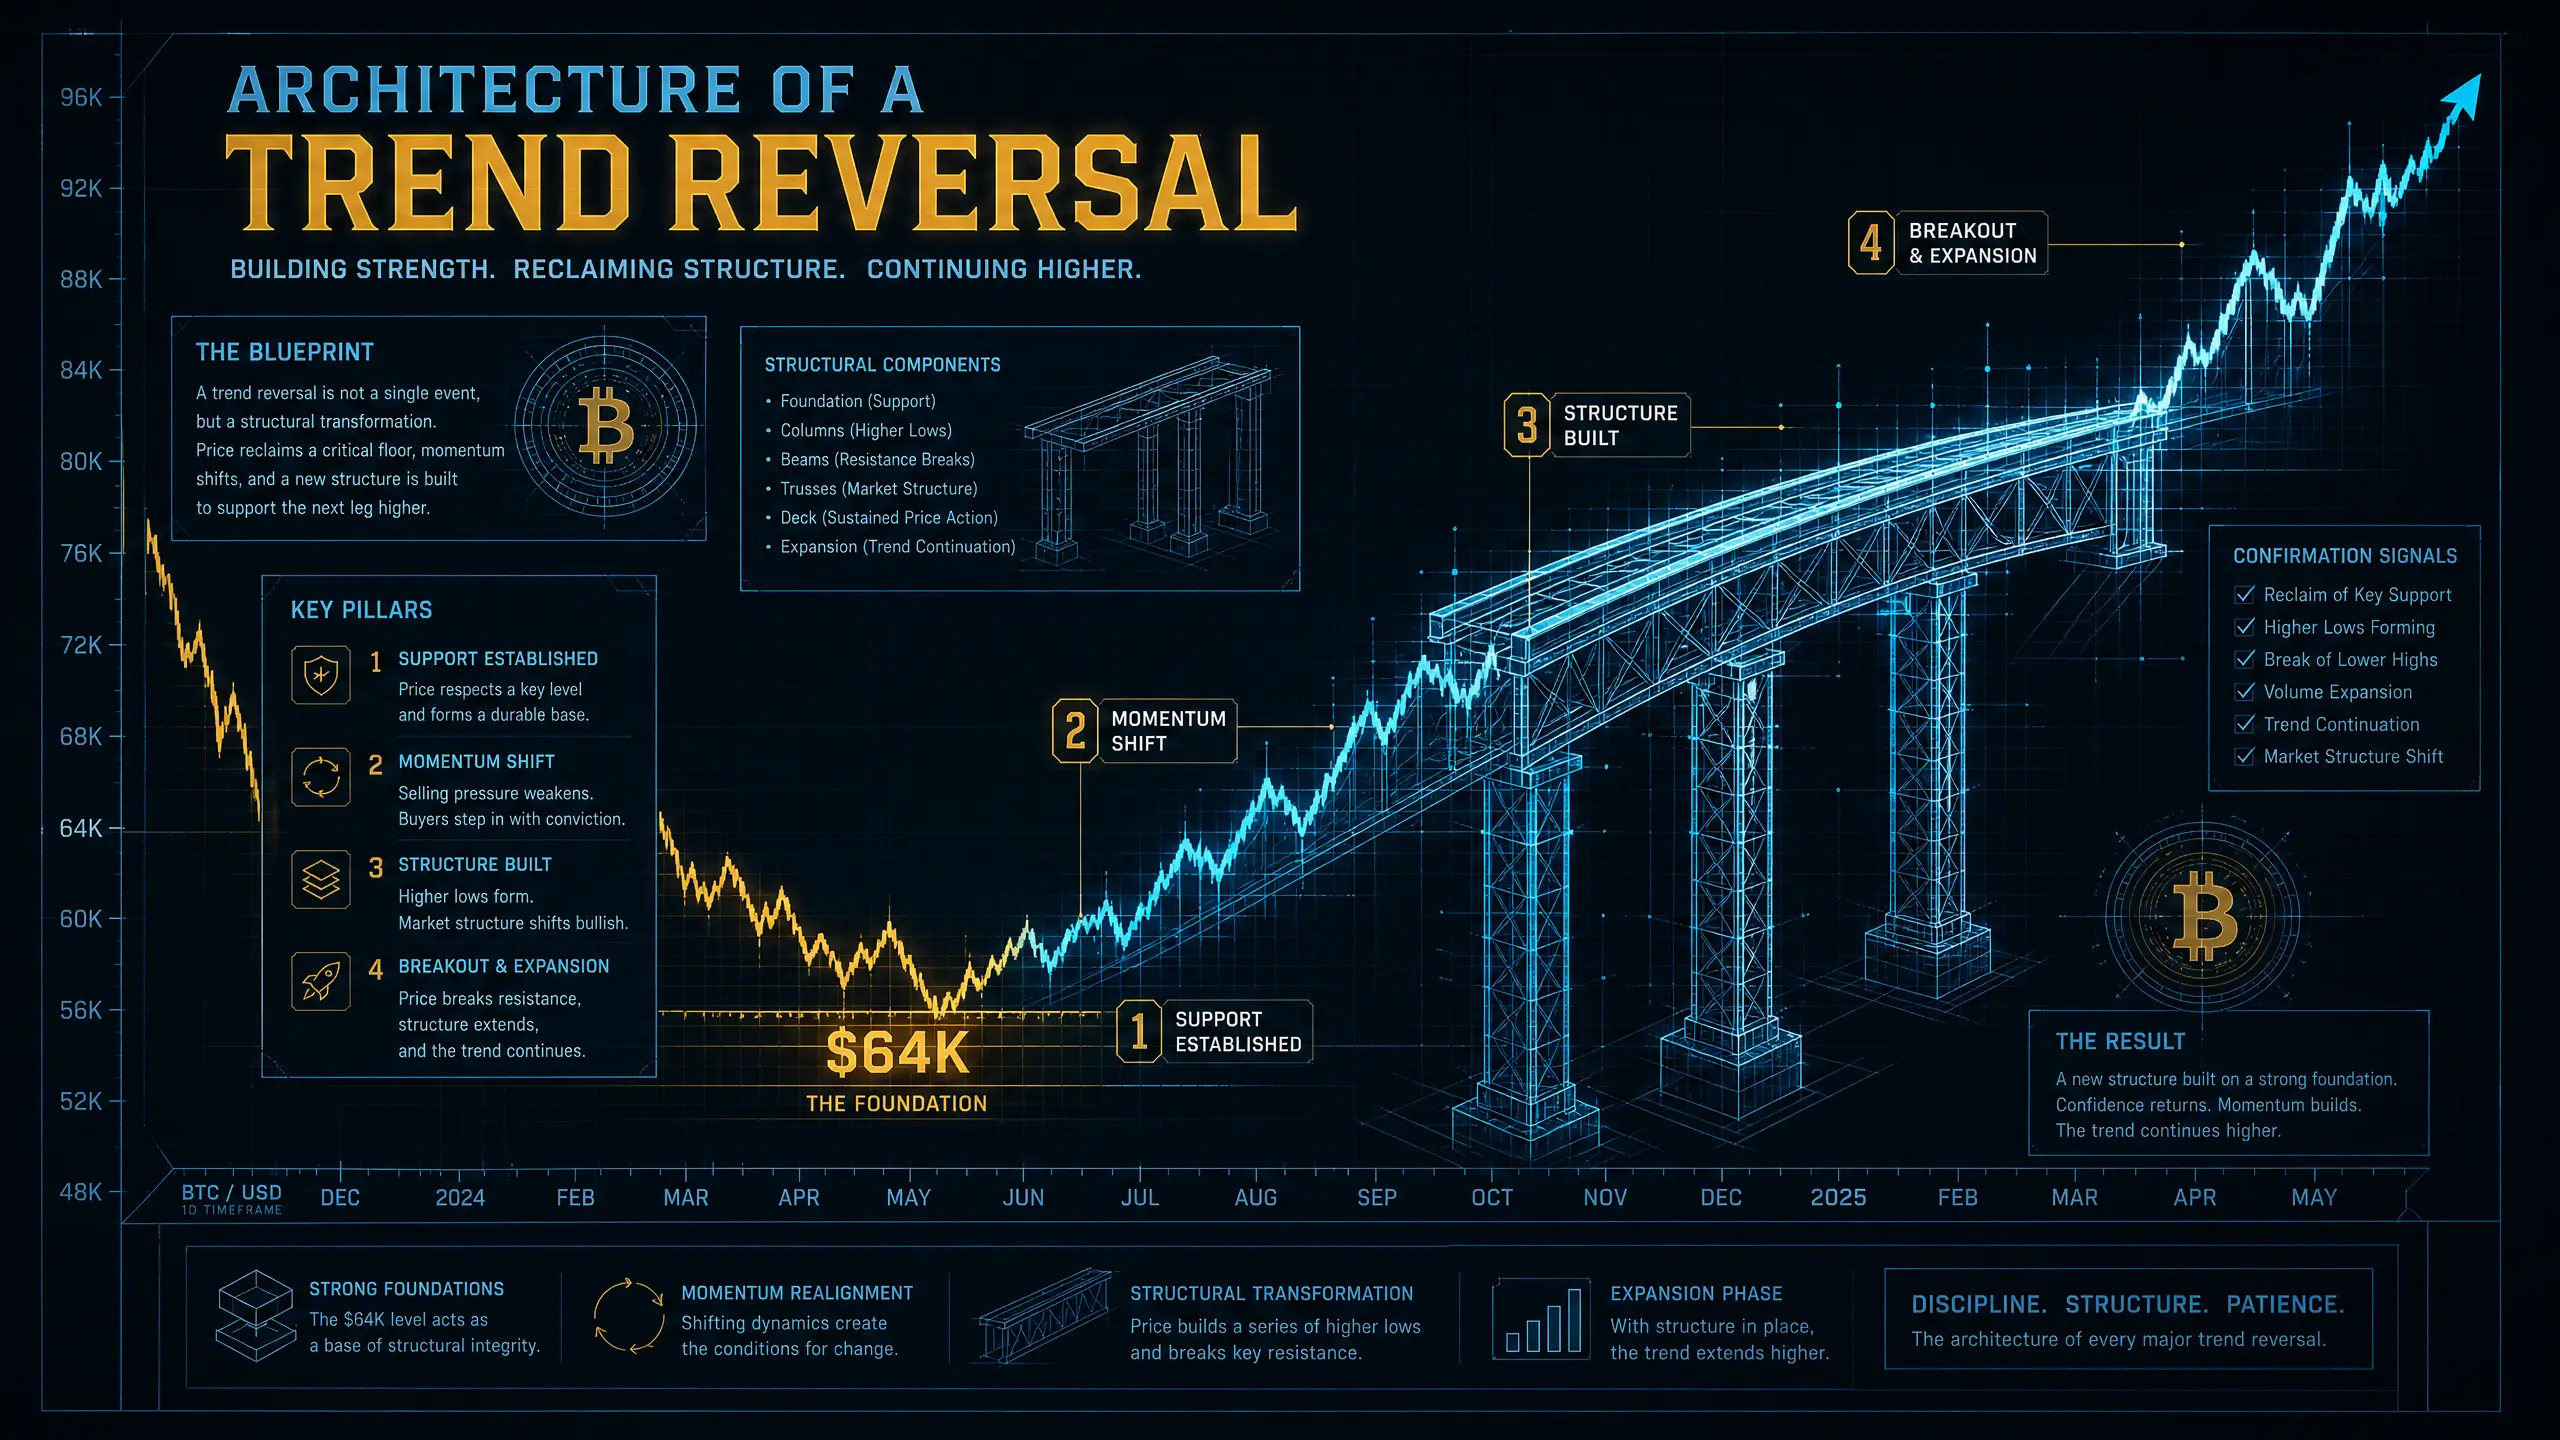
Everyone is watching whether Bitcoin can bounce. I'm watching whether the rebound can become a structure.
Bitcoin holding around the $64K area has brought fresh attention back to the crypto market, but a rebound is not automatically a trend reversal. The real test is whether buyers can build a sustainable market structure instead of producing another short-term relief rally.
My focus is now on three confirmations:
1️⃣ Price Acceptance
Can BTC hold above the recent recovery zone instead of immediately losing it?
2️⃣ Volume & Liquidity
Is fresh capital entering the market, or are we simply seein
BTC0.13%
post-image
post-image
post-image
  • Reward
  • 2
  • Repost
  • Share
PrinceMagsi786:
To The Moon 🌕
View More
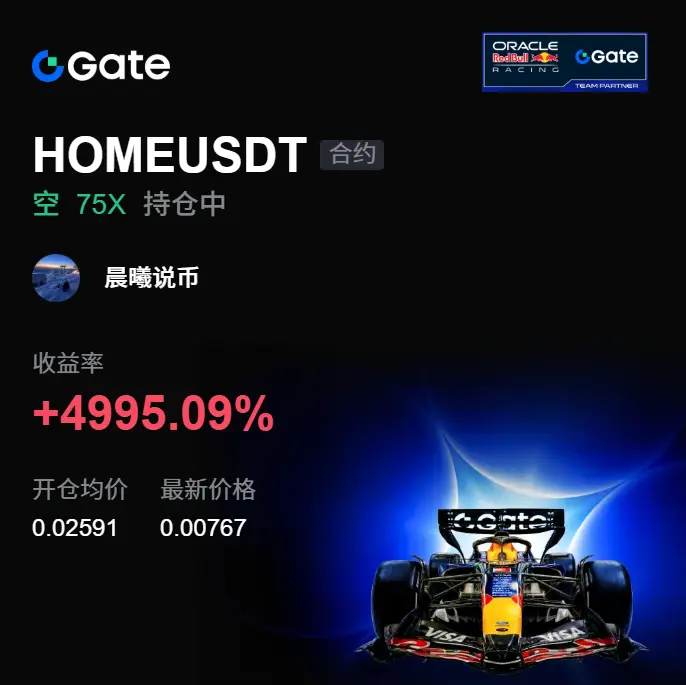
This sell-off basically wakes up most people’s high-position fantasies. $HOME A few days ago they were still pretending to be strong, and the price repeatedly pushed up—but what I’m looking at is the details: the surge had no volume, while the pullback was fast, which suggests it’s not that there are no sellers up there, but that the buy-side can’t absorb it.
The key is right here: every time the order book does a fake-out spike, it eats away at the people chasing longs. Once the liquidity gets swept out about enough, the move is likely to suddenly accelerate. I’m handling short positions aro
HOME3.94%
BTC0.12%
ETH0.53%
View Original
post-image
  • Reward
  • Comment
  • Repost
  • Share
🚨 Allbridge Core got hacked and around $1.65M was moved from Solana to Ethereum.
They paused the protocol just to be safe and are telling affected LPs to pull out right away.
#SummerCreationCamp
  • Reward
  • Comment
  • Repost
  • Share
JUST IN: SK Hynix (SKHX) swung intraday, rising ~8.7% then retracing; three whales opened fresh longs totaling ~$14M, now underwater as price moves. This highlights heightened risk/volatile liquidity events in recent crypto-linked tokens. $SKHX
SK Hynix-2.87%
SKHY0.89%
SKHYV-0.98%
post-image
  • Reward
  • Comment
  • Repost
  • Share
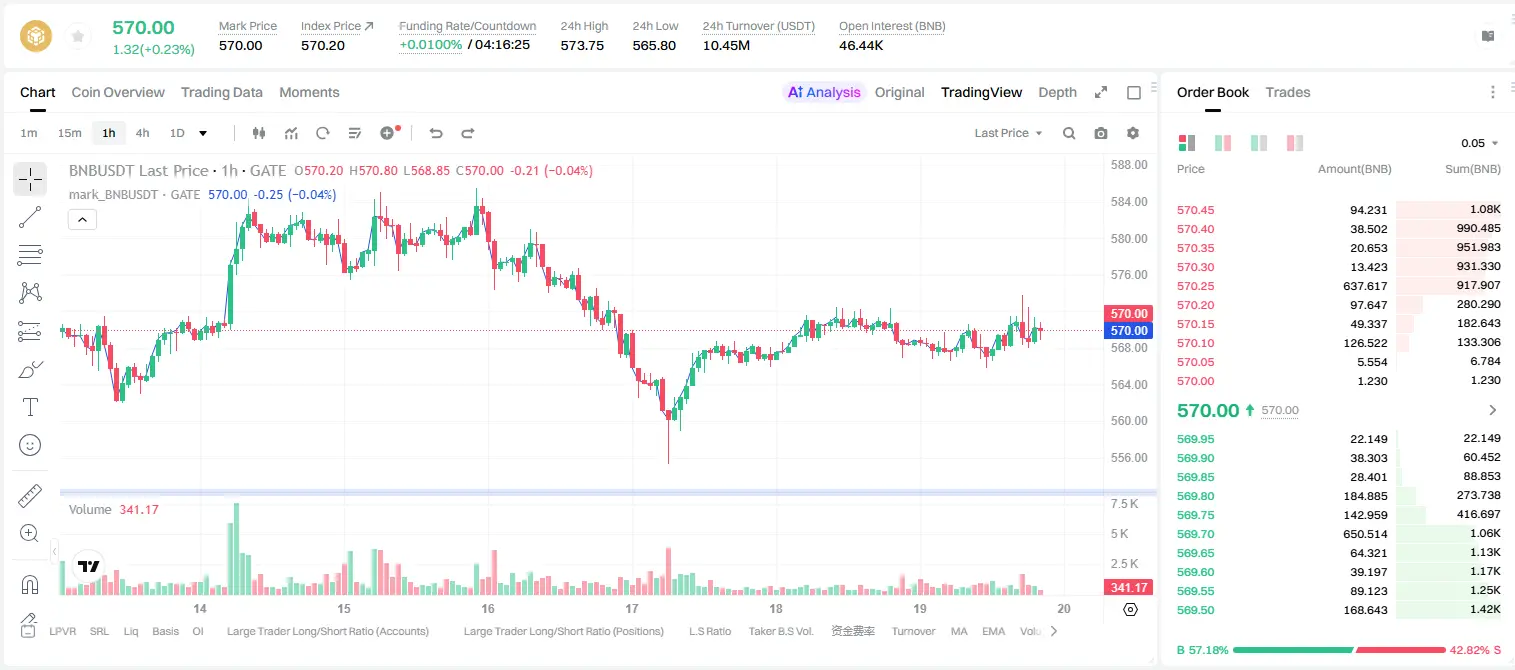
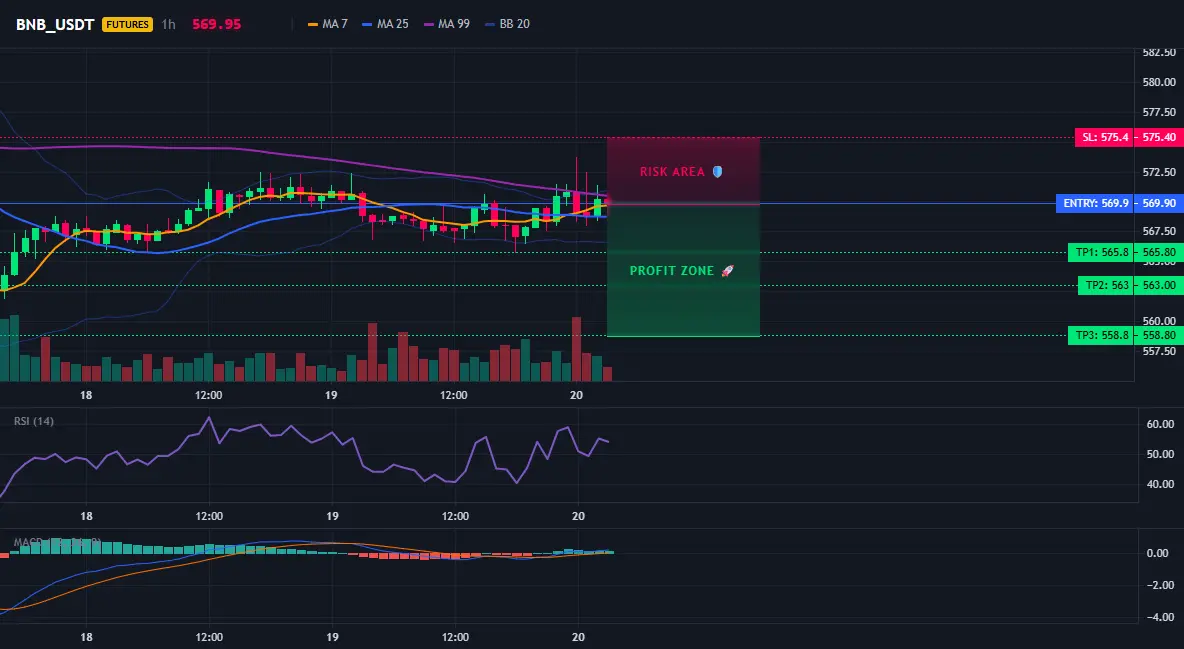
Can you dare to follow this short on BNB?
$BNB /USDT - SHORT
Trading plan:
Entry: 569.3 – 570.5
SL: 575.4
TP1: 565.8
TP2: 563.0
TP3: 558.8
Why focus on this setup?
- The daily trend is clearly bearish; the 4-hour signals back it up, with a 95% confidence level to short.
- Current price 569.9 is near the EMA resistance zone; RSI (15m) is 49.85, and rebounds lack strength.
- Precise entry: 569.3-570.5; TP1 565.8; TP2 563.0; stop loss 575.4—risk is controllable.
- Why now? The daily bearish bias hasn’t changed; short-term rebounds face resistance—this is the timing to enter with the trend.
Discus
BNB0.08%
View Original
post-image
post-image
  • Reward
  • Comment
  • Repost
  • Share
JUST IN: A single whale now holds the largest BTC long position on Hyperliquid, ~1,663 BTC (~$107M) with an entry around $63.96k, boosting unrealized profit and signaling persistent large‑holder conviction. $BTC
BTC0.12%
post-image
  • Reward
  • Comment
  • Repost
  • Share
#广场预测世界杯赢40000U 2026 “World Cup”: Argentina’s title defense dream collapses, Spain wins their second “Jules Rimet” trophy
The 2026 USA-Canada-Mexico “World Cup” concludes, Spain wins the championship
In the early morning of July 20 Beijing time, the four-yearly “FIFA” World Cup (started in 1930) wrapped up at MetLife Stadium in New Jersey, USA (played back and forth across three countries in the US, Canada, and Mexico from June 11 to July 19). In the final match: European powerhouse Spain squeezed out a 1-0 win over the defending champion Argentina in a thrilling extra-time period, thereby lif
View Original
post-image
  • Reward
  • 5
  • Repost
  • Share
LittleGodOfWealthPlutus:
World Cup go go go ⚽
View More
Load More

Join 40 M users in our growing community

⚡️ Join 40 M users in the crypto craze discussion
💬 Engage with your favorite top creators
👍 See what interests you
  • Pinned