


#Gate广场五月交易分享 Four Dimensions Breakdown: What Are the Bulls and Bears Really Betting On?
① Macroe geopolitical factors: A double-edged sword driving forces
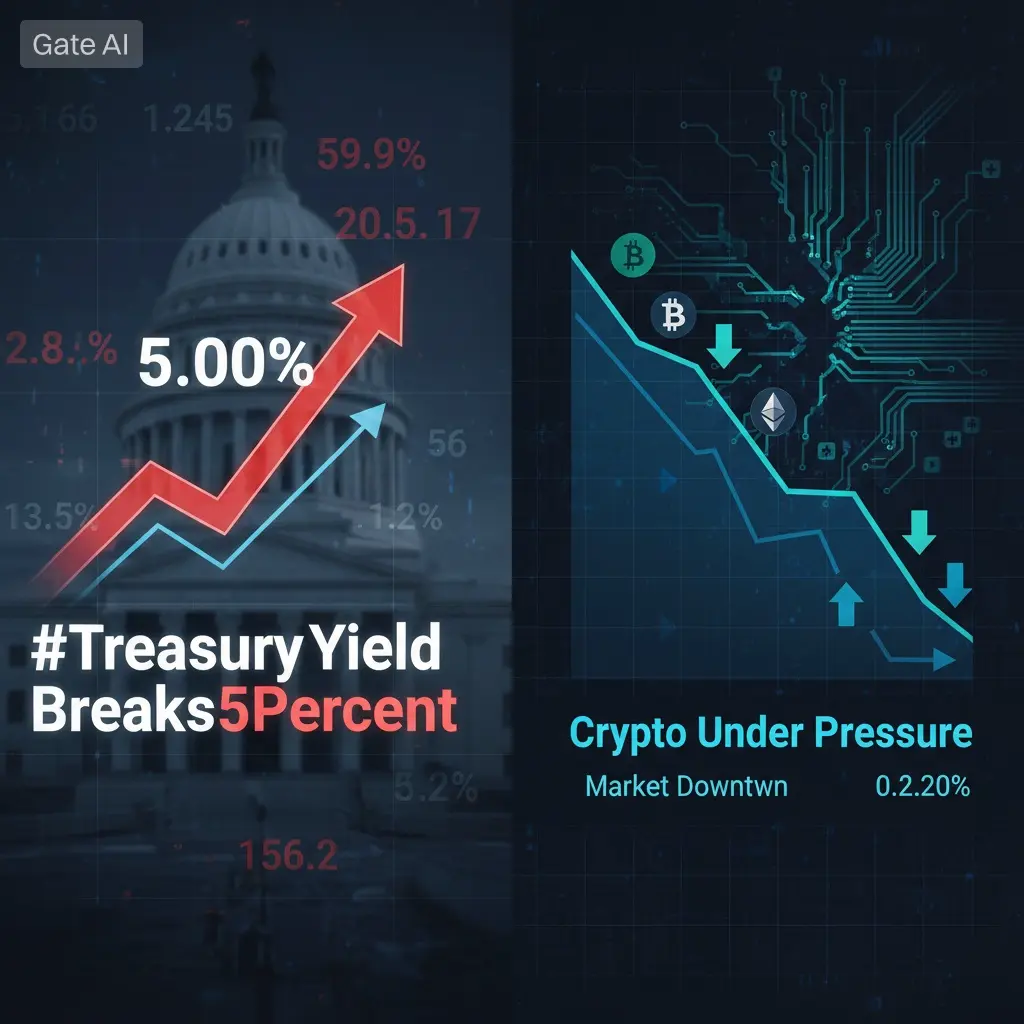
The external catalyst for this rebound is mainly the marginal easing of the Middle East situation—oil prices sharply retreat (Brent crude drops below $110, stimulated by news of the “Free Passage Plan”), driving risk assets collectively higher. But on the other hand, it is extremely sensitive: sudden news like Iranian missile attacks can cause Bitcoin to plummet nearly 3% within an hour. Meanwhile, the Iran conflict could push the US March CPI to 3.3%, forcing the Federal Reserve to narrow its rate cut path, and long-term liquidity expectations come under pressure.
Conclusion: Currently, Bitcoin’s price movement is highly event-driven, with volatile swings and weak trend continuation.
② Spot ETF and institutional funds: Where is the support base?
Nevertheless, institutional demand is the most solid endogenous driver of this rebound: on May 1 and 4, spot Bitcoin ETFs saw net inflows of about $630 million and $603 million respectively. Over the past three weeks, total inflows reached approximately $2.7 billion. The total ETF assets surpassing $100 billion is a particularly noteworthy signal: the Governor of the Czech Central Bank publicly stated at the Bitcoin 2026 conference that allocating 1% of assets to Bitcoin can enhance expected returns without increasing systemic risk. This marks an important stance from global central bank-level institutions on the “legalized allocation” of Bitcoin.
Technical support level: around $76.7k (the average cost basis of many ETFs), forming an institutional-level lower buffer zone.
③ Options market and “sell walls”: Why is $80k so hard to hold? $80k is not just a psychological barrier but a structural resistance cluster, known by the market as the “death pressure zone”: order book structure shows that the sell orders in the $79,800–$80,500 range are more than three times the buy orders. This is the dense trapped zone from February to April 2026, and also the area where whales concentrate profit-taking. Deribit data shows that the notional value of $80k call options expiring in May–June exceeds $1.5 billion. Market makers’ Long Gamma hedging mechanisms will force prices closer to $80k, with passive selling increasing, creating a self-reinforcing top-selling pressure.
④ Leverage structure and on-chain data: Longs crowded, profit-taking dense
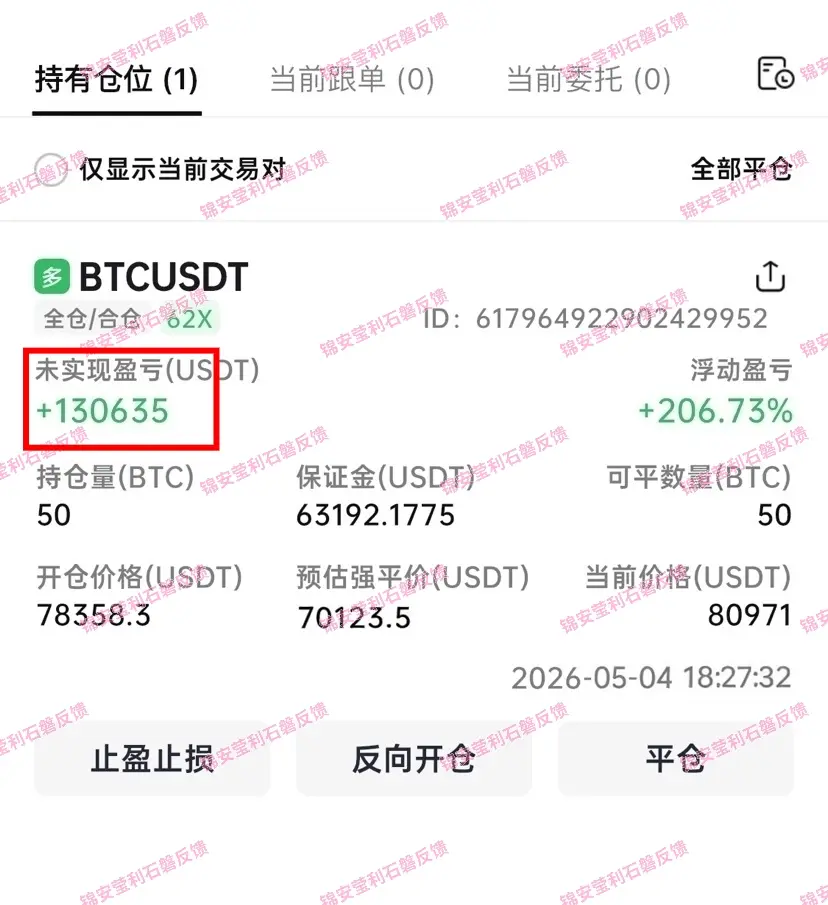
The current market long-short ratio is about 1.16, with longs significantly concentrated, especially around $80k, where a large number of high-leverage longs (20–50x) have accumulated. On-chain data reveals fragility: short-term holders (cost basis between $80k–$81.8k) are profit-taking at a rate of about $4 million per hour as the price hits $80k. During the price surge, trading volume continues to shrink, with daily divergence and RSI overbought signals. Realized profits have once soared to $2.0756 billion, with medium- to long-term profits (held for 2–3 years) being realized at about $76.7k per hour. Glassnode describes this phenomenon as “when the price approaches short-term holders’ cost basis, the motivation to exit exceeds the demand to enter,” a typical bear market reaction—lack of systemic bullish conviction to start a new bull run, with more positions closed at resistance zones.
What’s the outlook? Key dividing line and two scenarios
Currently, bulls and bears have fundamental disagreements about the nature of the $80k breakout:
🔴 Optimists → Bullish reversal starting point
🔵 Pessimists → Fake breakout at resistance, trap for induced longs
Short-term key dividing line: $79,500–$79,700. If it holds above $79,500, the upward targets are sequentially: $84,000 → $87,000–$88,000. Breaking through this resistance cluster further, the $100k–$100.9k retracement zone will serve as a long-term directional guide.
If unable to effectively stabilize above $79,500 support, then the next levels are: $75,000 → $73,000 → $72,352 (the 100-day moving average). Falling below these critical zones would invalidate the $80k breakout as a bull trap, turning it into a bear trap. Glassnode currently defines this as a consolidation phase (choppier, rangebound), with market momentum significantly waning:
📉 Price momentum down 3.5%
📉 Net buying pressure down 28.6%
📉 Participation rate down 13.3%
Short-term direction remains highly uncertain.
All information in this article is derived from public market data and analysis and does not constitute any investment advice.
① Macroe geopolitical factors: A double-edged sword driving forces
The external catalyst for this rebound is mainly the marginal easing of the Middle East situation—oil prices sharply retreat (Brent crude drops below $110, stimulated by news of the “Free Passage Plan”), driving risk assets collectively higher. But on the other hand, it is extremely sensitive: sudden news like Iranian missile attacks can cause Bitcoin to plummet nearly 3% within an hour. Meanwhile, the Iran conflict could push the US March CPI to 3.3%, forcing the Federal Reserve to narrow its rate cut path, and long-term liquidity expectations come under pressure.
Conclusion: Currently, Bitcoin’s price movement is highly event-driven, with volatile swings and weak trend continuation.
② Spot ETF and institutional funds: Where is the support base?
Nevertheless, institutional demand is the most solid endogenous driver of this rebound: on May 1 and 4, spot Bitcoin ETFs saw net inflows of about $630 million and $603 million respectively. Over the past three weeks, total inflows reached approximately $2.7 billion. The total ETF assets surpassing $100 billion is a particularly noteworthy signal: the Governor of the Czech Central Bank publicly stated at the Bitcoin 2026 conference that allocating 1% of assets to Bitcoin can enhance expected returns without increasing systemic risk. This marks an important stance from global central bank-level institutions on the “legalized allocation” of Bitcoin.
Technical support level: around $76.7k (the average cost basis of many ETFs), forming an institutional-level lower buffer zone.
③ Options market and “sell walls”: Why is $80k so hard to hold? $80k is not just a psychological barrier but a structural resistance cluster, known by the market as the “death pressure zone”: order book structure shows that the sell orders in the $79,800–$80,500 range are more than three times the buy orders. This is the dense trapped zone from February to April 2026, and also the area where whales concentrate profit-taking. Deribit data shows that the notional value of $80k call options expiring in May–June exceeds $1.5 billion. Market makers’ Long Gamma hedging mechanisms will force prices closer to $80k, with passive selling increasing, creating a self-reinforcing top-selling pressure.
④ Leverage structure and on-chain data: Longs crowded, profit-taking dense
The current market long-short ratio is about 1.16, with longs significantly concentrated, especially around $80k, where a large number of high-leverage longs (20–50x) have accumulated. On-chain data reveals fragility: short-term holders (cost basis between $80k–$81.8k) are profit-taking at a rate of about $4 million per hour as the price hits $80k. During the price surge, trading volume continues to shrink, with daily divergence and RSI overbought signals. Realized profits have once soared to $2.0756 billion, with medium- to long-term profits (held for 2–3 years) being realized at about $76.7k per hour. Glassnode describes this phenomenon as “when the price approaches short-term holders’ cost basis, the motivation to exit exceeds the demand to enter,” a typical bear market reaction—lack of systemic bullish conviction to start a new bull run, with more positions closed at resistance zones.
What’s the outlook? Key dividing line and two scenarios
Currently, bulls and bears have fundamental disagreements about the nature of the $80k breakout:
🔴 Optimists → Bullish reversal starting point
🔵 Pessimists → Fake breakout at resistance, trap for induced longs
Short-term key dividing line: $79,500–$79,700. If it holds above $79,500, the upward targets are sequentially: $84,000 → $87,000–$88,000. Breaking through this resistance cluster further, the $100k–$100.9k retracement zone will serve as a long-term directional guide.
If unable to effectively stabilize above $79,500 support, then the next levels are: $75,000 → $73,000 → $72,352 (the 100-day moving average). Falling below these critical zones would invalidate the $80k breakout as a bull trap, turning it into a bear trap. Glassnode currently defines this as a consolidation phase (choppier, rangebound), with market momentum significantly waning:
📉 Price momentum down 3.5%
📉 Net buying pressure down 28.6%
📉 Participation rate down 13.3%
Short-term direction remains highly uncertain.
All information in this article is derived from public market data and analysis and does not constitute any investment advice.
