Share crypto content and earn up to 60% commissions through content mining.
placeholder
gatefun
Bitcoin Holds Market Attention Ahead of Fresh U.S. Economic Data
gate liveLIVE
1,383
  • Reward
  • Comment
  • Repost
  • Share
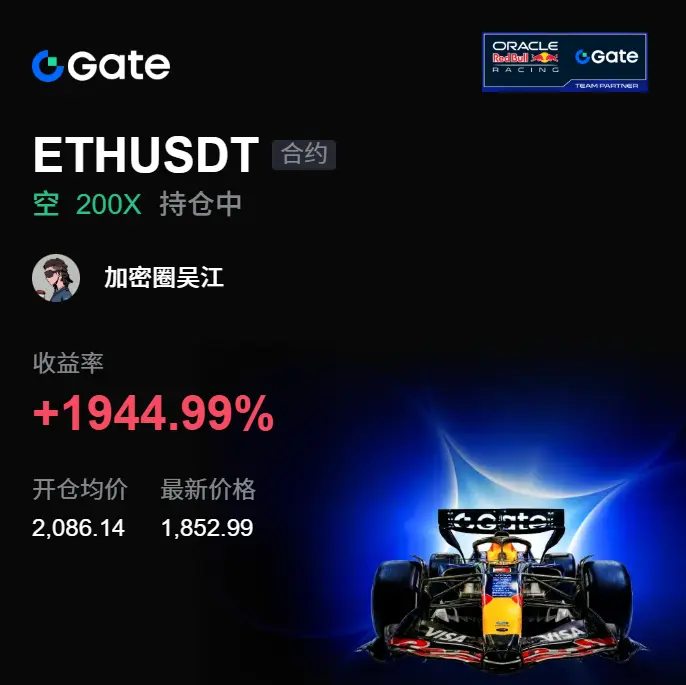
Woke up and immediately felt sharp! 📉😎 In the morning when I opened the chart, $OPEN had already fully unwound the fake rally from a few days ago afternoon. Back then, when everyone was still watching, what I saw was weak rebound momentum and insufficient follow-through—every attempt to surge just lacked that last bit.
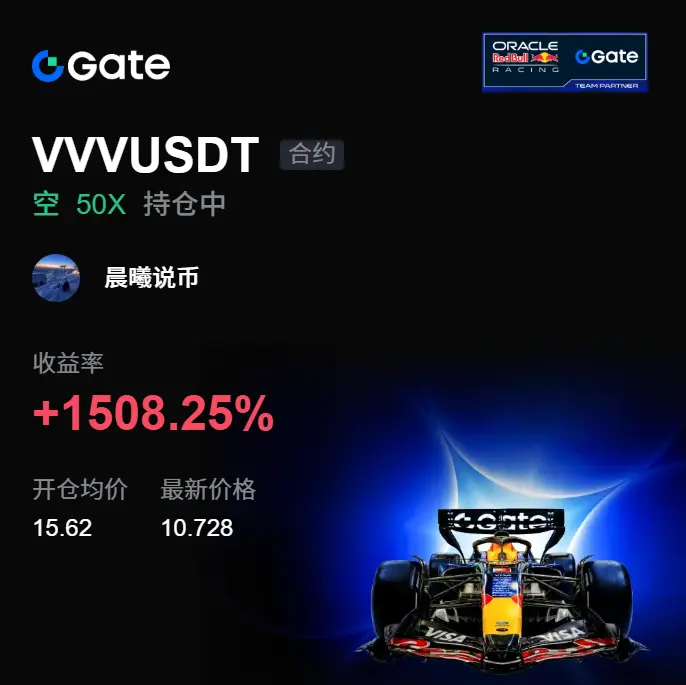
At the time, around 0.1821, the signal to go short was clear; it wasn’t reckless charging, it was that the chart’s signal was too obvious 👀 Now it’s at 0.1469, with a return of +1371.57%. Before that, it was true grind—when it finally played out, it was genuinely delicious �
OPEN-3.40%
BTC-0.11%
ETH0.02%
View Original
post-image
  • Reward
  • Comment
  • Repost
  • Share
🚨 This historical pattern has caught the market's attention.
Since 2002, the S&P 500 has experienced notable corrections following July in several market cycles:
• 2002: -32.4%
• 2006: -9.6%
• 2010: -18.9%
• 2014: -11.0%
• 2018: -19.2%
• 2022: -19.9%
Will 2026 follow history, or break the trend?
History provides context—not certainty. Markets don't always repeat, but they often rhyme. Stay focused on risk management and let price action guide your decisions.
Not financial advice.
#USIranWarCloudsGather #WorldCupChampionPrediction #SKHynixADRIndicativePrice149 #BernsteinSaysMemoryBullMarketToL
SPX500-0.31%
post-image
  • Reward
  • 7
  • Repost
  • Share
TakeAScreenshotBefore:
Only people who’ve gone through a drawdown of that kind—32%—know how painful it is.
View More
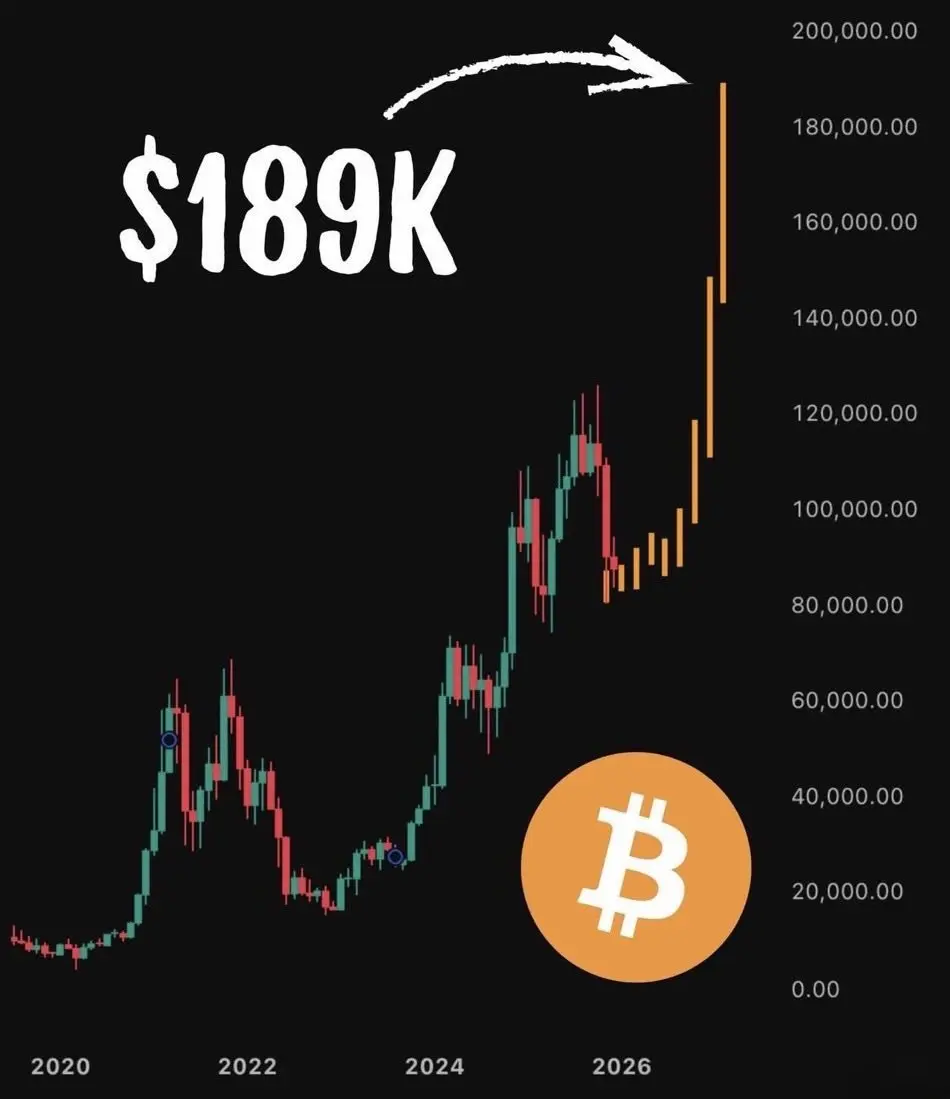
🚨On the BTC chart, a bad situation is about to happen.
Based on historical patterns, BTC could bottom out in 2026, then see the next rally.
The most likely bottom is around $50k.
$BTC
$50k is exactly the largest concentration point for long liquidations.
The market will feel pain, brutality, and utter hopelessness.
That’s when the biggest opportunity will arise.
When I start buying and opening positions, I’ll post it here.
Follow me so you won’t miss that moment.
BTC-0.12%
View Original
post-image
  • Reward
  • Comment
  • Repost
  • Share
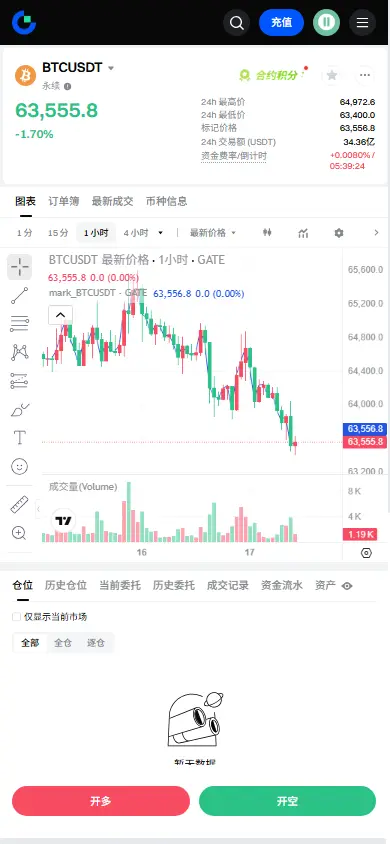
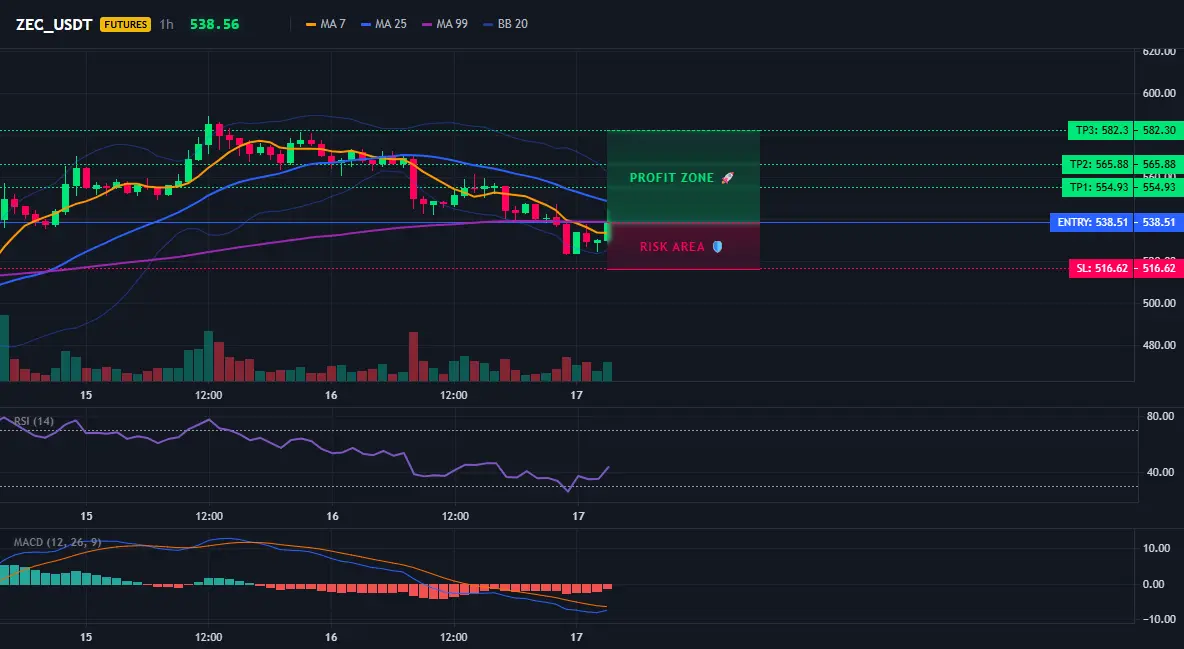
$VANRY Signal】1H long-side rebound + negative funding rate accumulation
$VANRY RSI 1H 55.2. After the 4H MACD golden cross, the histogram bars are shrinking. The dense order range is 0.00644-0.00646. The negative funding rate of -0.1979% suggests shorts are crowded; OI is stable, indicating a clear intent by buyers to provide support.
🎯 Direction: Go long
⚡ Entry/limit orders: 0.00644261 - 0.00646200
🛑 Stop loss: 0.00639738
🚀 Target 1: 0.00655893
🚀 Target 2: 0.00660740
🛡️ Trade management:
- Execution plan: After reaching Target 1, cut 50% position, and move the stop loss up to breakeve
VANRY16.97%
LAB-36.55%
BTC-0.12%
ETH0.06%
SOL-0.42%
View Original
post-image
  • Reward
  • Comment
  • Repost
  • Share
Grinding for a few days, and today it just gives you the answer directly! This drop candle no longer “pretends” on the board—📉🎉$RENDER short positions have been closed and locked in. If you can hold your nerve, this round is just really comfortable to eat. When the price was grinding higher during the session, I could see the overhead suppression had been there the whole time. Even when it pushed up several times, it couldn’t hold, and the volume didn’t come in either—the long-baiting vibe was really strong. At that moment, I told you not to chase the trade. View it with a long-entry mindset
RENDER-0.86%
BTC-0.11%
ETH0.02%
View Original
post-image
  • Reward
  • Comment
  • Repost
  • Share
Guys, who gets it! After this one, the order book stopped pretending📉🔥 A few days ago before bed I was still grinding at the high area, and $FET looked like it wanted to break up but couldn’t. What I saw then was that the overhead resistance was obvious, and volume didn’t keep up— the bounce felt a bit shaky.

While everyone else was still watching, I reminded them not to get led around by fake pull-ups. Put the short orders around 0.2530 first, and wait for it to give its own answer.
This is the rhythm. 🎯

In the morning when I opened the chart, the price had already been driven down to
FET-1.97%
BTC-0.11%
ETH0.02%
View Original
post-image
  • Reward
  • Comment
  • Repost
  • Share
Better to have more than enough money than have less
post-image
  • Reward
  • Comment
  • Repost
  • Share
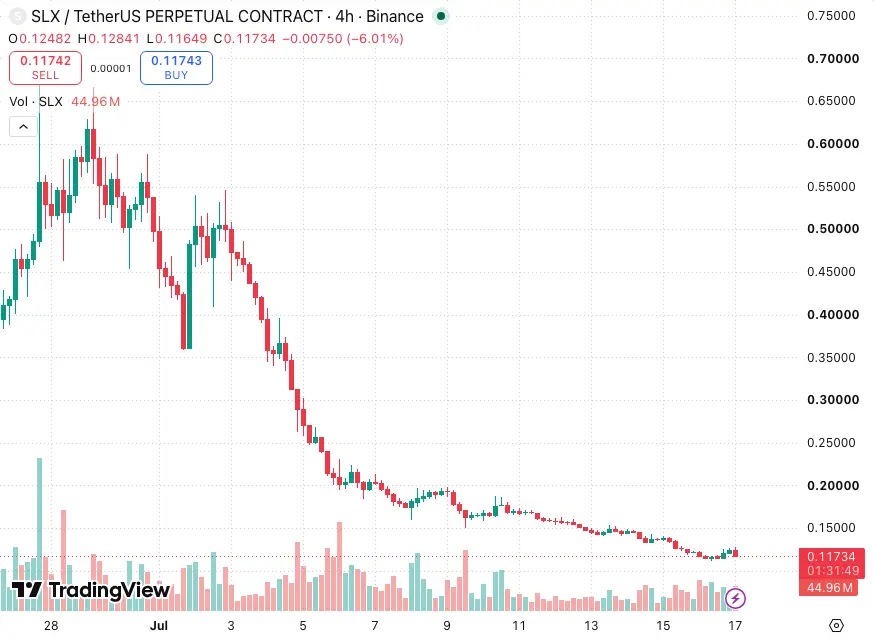
$SLX /USDT 4H bullish divergence signal—who’s quietly accumulating?

$SLX /USDT - Go LONG

Trading plan:
Entry: 0.15062 – 0.15216
SL: 0.14183
TP1: 0.15856
TP2: 0.16334
TP3: 0.17052

Why pay attention to this setup?
- 4H RSI 37.23 in the oversold zone, with a rebound being brewed during the daily consolidation.
- Current price 0.15139, LONG targets TP1: 0.15856 (+4.7%), TP3: 0.17052 (+12.6%).
- Stop loss 0.14183 (-6.3%), risk-reward ratio 1:2, with an enticing profit-loss profile.
- Why now? The 15-minute RSI has already bottomed out, and short-term buy-side momentum is building.

Discussio
SLX-5.25%
View Original
post-image
  • Reward
  • Comment
  • Repost
  • Share
do you know you might have met one of your biggest influencers IRL without knowing and you will never know bcos of anonymity
post-image
  • Reward
  • Comment
  • Repost
  • Share
What really caught my attention this time wasn’t simply the speed of the drop, but the failure after the rebound. The details the price is giving are more informative than the surface-level volatility.
$ESPORTS on this record: the opening price was 0.08377. At the time, I was looking at the key level above that it couldn’t break through for a long time. Now the price has pulled back to 0.01516; after the continuation of the move, the return rate is +1612.65%. This is a comparatively smooth example of rhythm and release.
In my judgment, the most critical thing in a bearish market is not to have
ESPORTS-6.57%
BTC-0.11%
ETH0.02%
View Original
post-image
  • Reward
  • Comment
  • Repost
  • Share
$B The longs did all the hard work, and in the end the shorts walked away with the money—this is the market’s dark humor. This trade +233 USD is in the bag; $EVAA $ETH I’ll keep watching. Sometimes the brothers going long are really just carrying someone else’s sedan—if you don’t pick the right entry, this is the outcome. The market keeps whipsawing—don’t chase too aggressively; control your position and manage the risk yourself.
EVAA-33.84%
View Original
post-image
  • Reward
  • Comment
  • Repost
  • Share
Woke up and I’m fully energized! 😎 A few days ago, my last look before sleep: $BEAT was still grinding at the bottom. The market hadn’t fully activated yet, but the pullback could hold firm, and the buy-side started to strengthen—at that time, I already pointed out that you could keep an eye on longs for the rhythm 📈
Some money isn’t made by impulse.
The entry reference is 1.0013. Now the price has reached 2.7845, and the profit is immediately at +3510.11%. This piece of meat tastes so good 🔥 A few days ago it still looked slow and sluggish—today it straight-up delivers the answer, and the
BEAT15.55%
BTC-0.11%
ETH0.02%
View Original
post-image
  • Reward
  • Comment
  • Repost
  • Share
What is the best investment for the next 5 years?
View Original
post-image
post-image
  • Reward
  • Comment
  • Repost
  • Share
$BEAT Signal】Bullish breakout accelerates, 1H momentum continues
$BEAT RSI 1H is 62.58 and buy-side depth is 1.08, the 4H Bollinger upper band at 3.0011 has been touched but has not seen a breakout with volume. The 1H MACD histogram is shrinking, short-term momentum is slightly weakening, but the funding rate is only 0.0085% with no sell pressure. The 4H MACD still stays bullish_expanding, with EMA20/50 moving averages arranged in a bullish order. Current price is 2.821; placing buy orders around 2.7928 for defense is enough.
🎯 Direction: Long
⚡ Entry/Limit orders: 2.81254 - 2.82100
🛑 Sto
BEAT15.55%
LAB-36.55%
BTC-0.12%
ETH0.06%
SOL-0.42%
View Original
post-image
  • Reward
  • Comment
  • Repost
  • Share
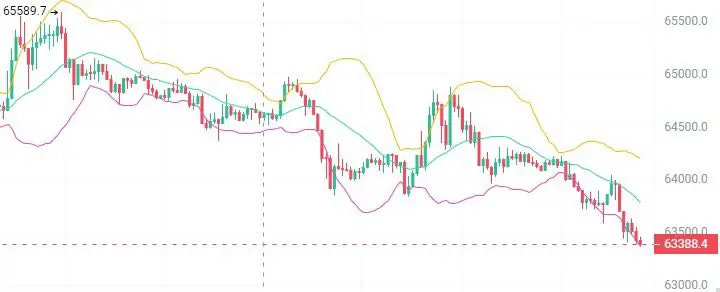
Spot CVD keeps falling, yet the price is actually rising.
The first thing you see on the $BTC order book is:
This is a leveraged-driven fake breakout. The spot market isn’t participating at all—something is likely to collapse at any moment.
But order flow can never be read in isolation from its context.
With the same data signal, placed in different market structures, it can point to completely opposite realities.
First, look at the information the chart is giving:
Aggressive sellers in the spot market keep placing sell-limit orders at market price, smashing the tape and driving spot CVD down
BTC-0.11%
View Original
post-image
  • Reward
  • Comment
  • Repost
  • Share
$PUNDIX Signal】1H high-level range volatility + extremely negative funding rate, targeting a short squeeze
After the 1H breakout, the price has been consolidating around 0.093, with RSI at 78.9 and 4H MACD bullish histogram bars continuing to expand. The funding rate at -0.2089% hit the recent extreme low, and short positions’ entry costs are elevated. The sell-side limit orders’ share is relatively high, but the price hasn’t effectively broken down; there are clear buy-side support actions.
🎯 Direction: Go long
⚡ Entry/Limit orders: 0.0931896 - 0.0934700
🛑 Stop loss: 0.0925353
🚀 Target 1
PUNDIX11.03%
LAB-36.55%
BTC-0.12%
ETH0.06%
SOL-0.42%
View Original
post-image
  • Reward
  • Comment
  • Repost
  • Share
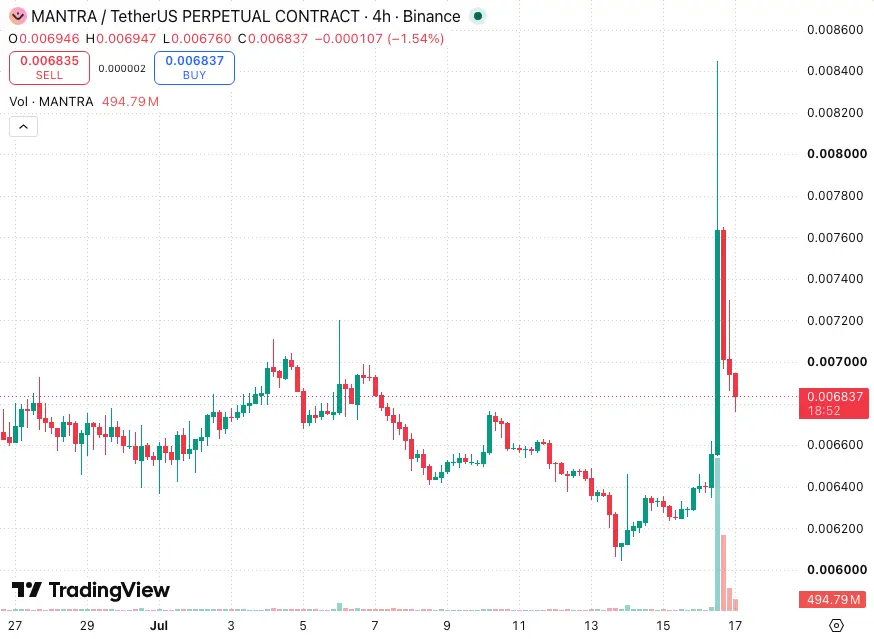
$BROCCOLIF3B | 1h | Range Rejection Short
Bias: Short
Entry Zone: 0.00602 to 0.00608
Stop Loss: 0.00620
Targets:
TP1: 0.00592
TP2: 0.00584
TP3: 0.00575
Invalidation:
Close above 0.00620
Why This Setup:
I see price stalling under the recent local highs after a sharp recovery, with repeated rejections around the 0.0060–0.0061 area. I want to short the failed push into resistance for a move back into the mid-range liquidity below.
post-image
  • Reward
  • Comment
  • Repost
  • Share
market update
gate liveLIVE
1,026
live-coin
  • Reward
  • Comment
  • Repost
  • Share
#SKHynixADRIndicativePrice149
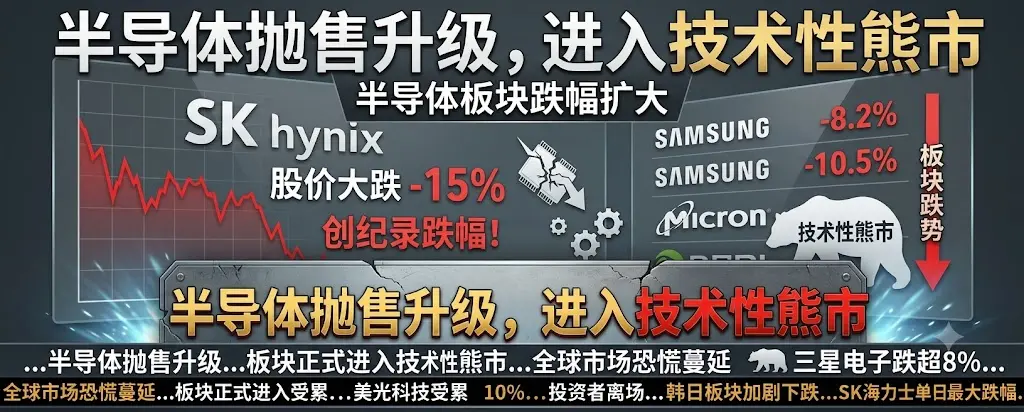
SK Hynix's Historic Wall Street Debut: The $26.5 Billion ADR That Rewrote the Rules
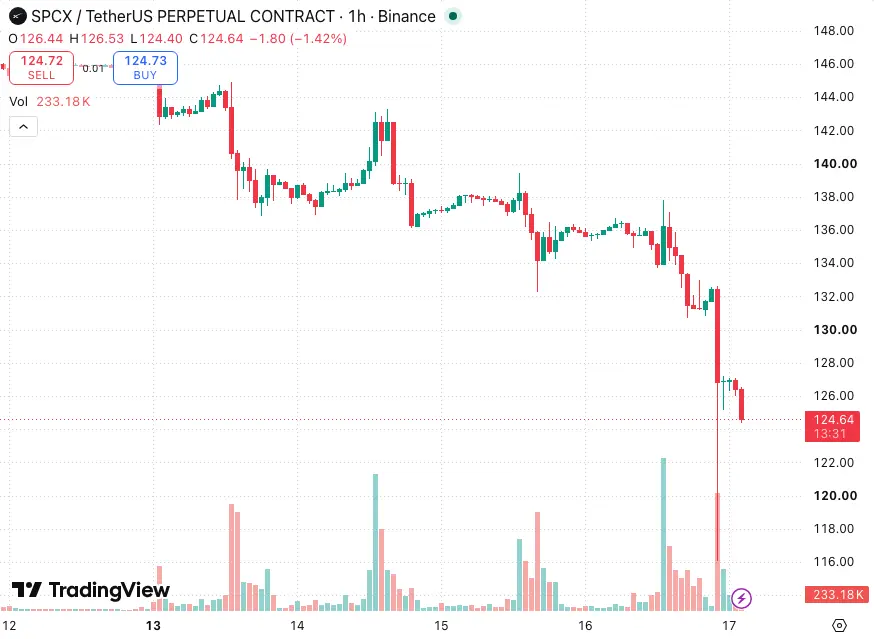
Wall Street just witnessed something it hasn't seen in over a decade a foreign company storming the U.S. capital markets with the largest ADR offering in history. SK Hynix didn't merely list; it arrived with the gravitational pull of a supernova, pricing 177.9 million American Depositary Shares at $149 apiece and raising $26.5 billion. That figure doesn't just edge past Alibaba's $25 billion 2014 record it obliterates it, establishing a new benchmark for international companies se
post-image
post-image
  • Reward
  • Comment
  • Repost
  • Share
Load More

Join 40 M users in our growing community

⚡️ Join 40 M users in the crypto craze discussion
💬 Engage with your favorite top creators
👍 See what interests you
  • Pinned