# tlm

19.42K
#TLM
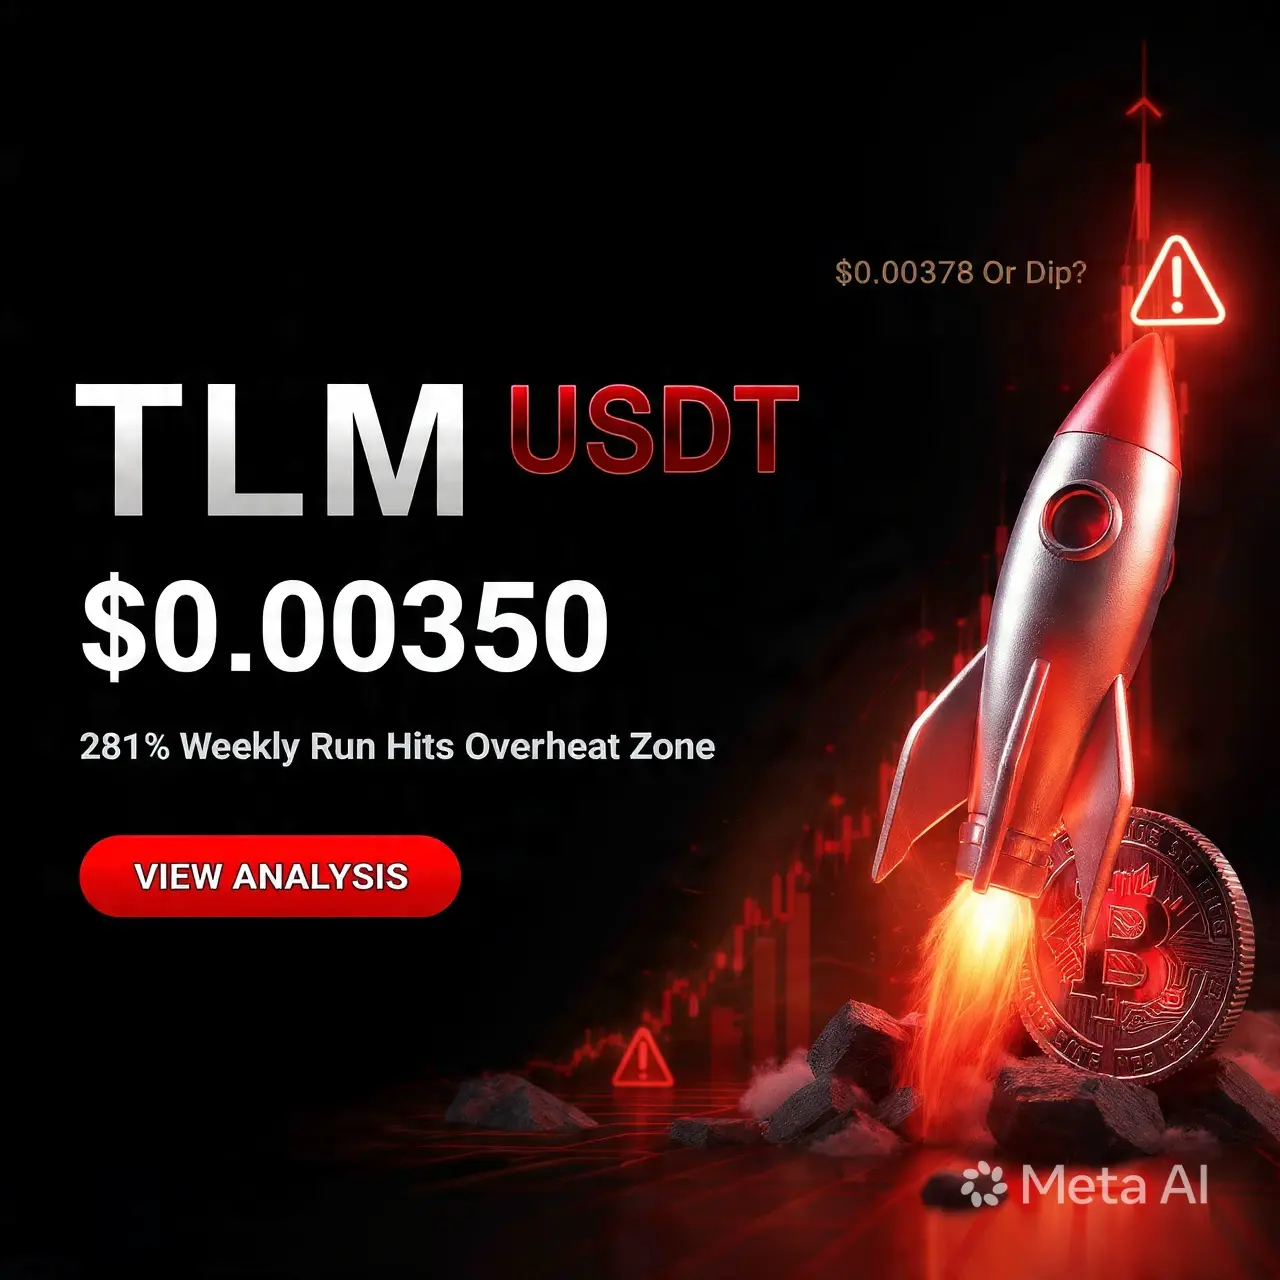
TLM $0.00350: 281% Weekly Run Hits Overheat Zone. $0.00378 Break or $0.00256 Dip?
Quick Look
TLM is at $0.0035029, up 30.51% today and 281% in 7 days. 24h range: $0.00256 to $0.00378. Flow hit 168.88M TLM / $549.24K. After bottoming at $0.0008091, TLM is up 333% in two weeks. This is pure momentum, but heat is building.
The Setup: Strong Trend Meets High Heat
1. Trend Still Firm: 15m, 4h, and daily MAs are stacked bullish. MA5 $0.0026692, MA10 $0.0018310, MA30 $0.0012769. Price holds well above all three. 4h and daily ADX sit over 45. That shows a firm trend, not a weak pop. 2. Big Flo
TLM-16.26%
post-image
  • Reward
  • 35
  • Repost
  • Share
amatsuki_longwei:
2026 GOGOGO 👊
View More
#TLM
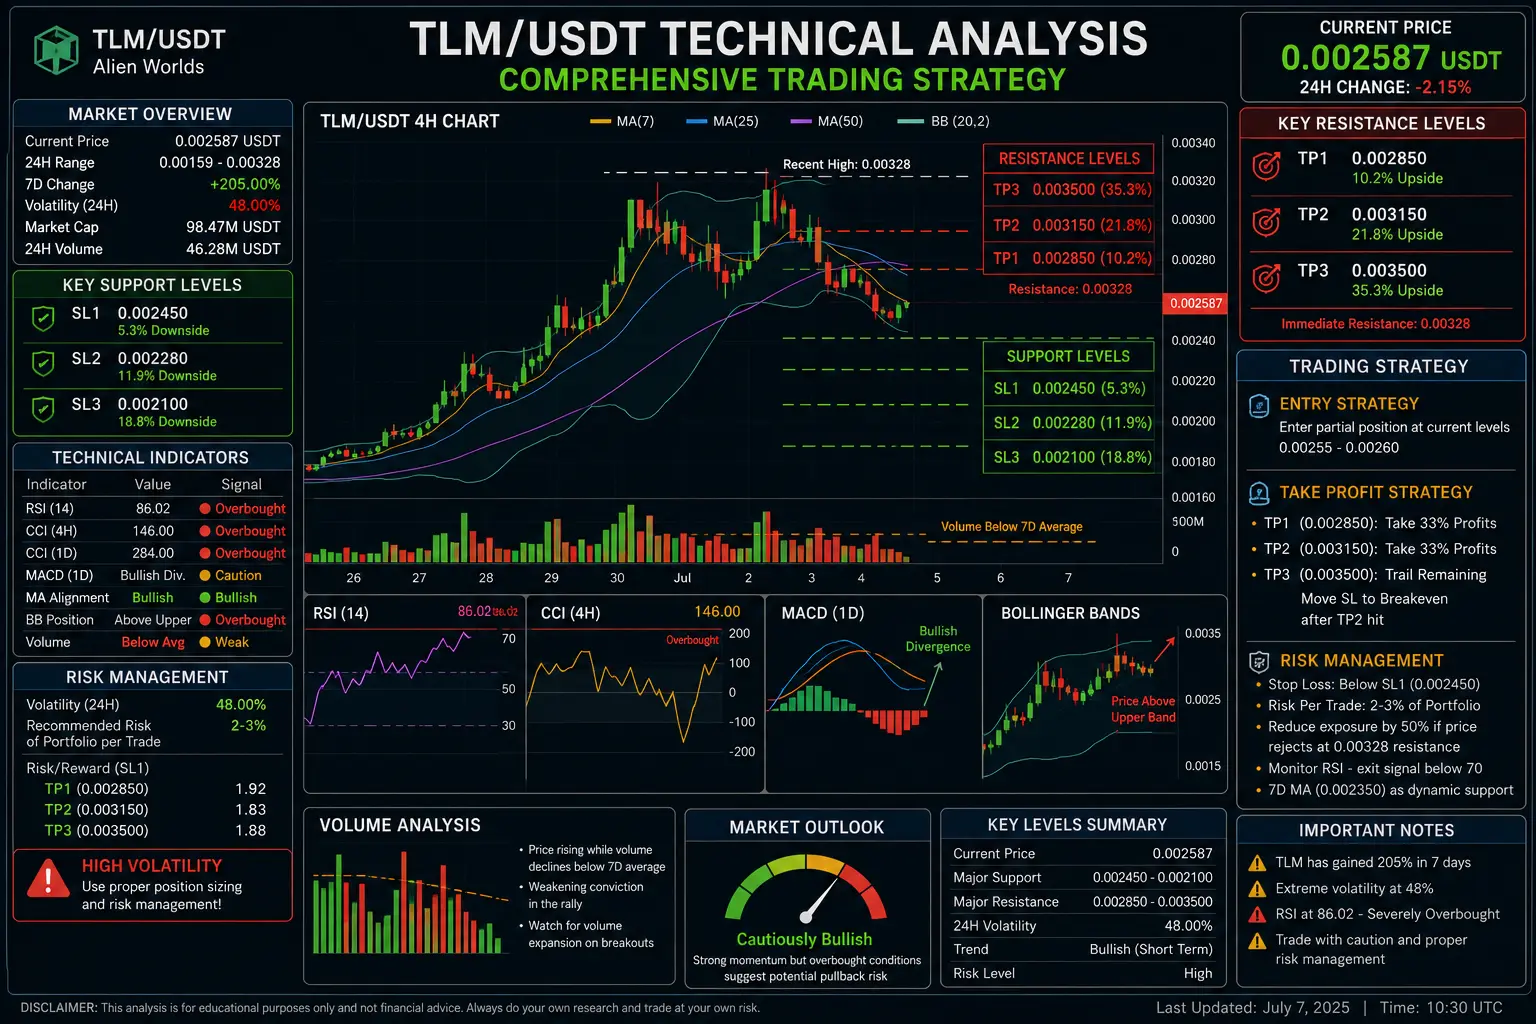
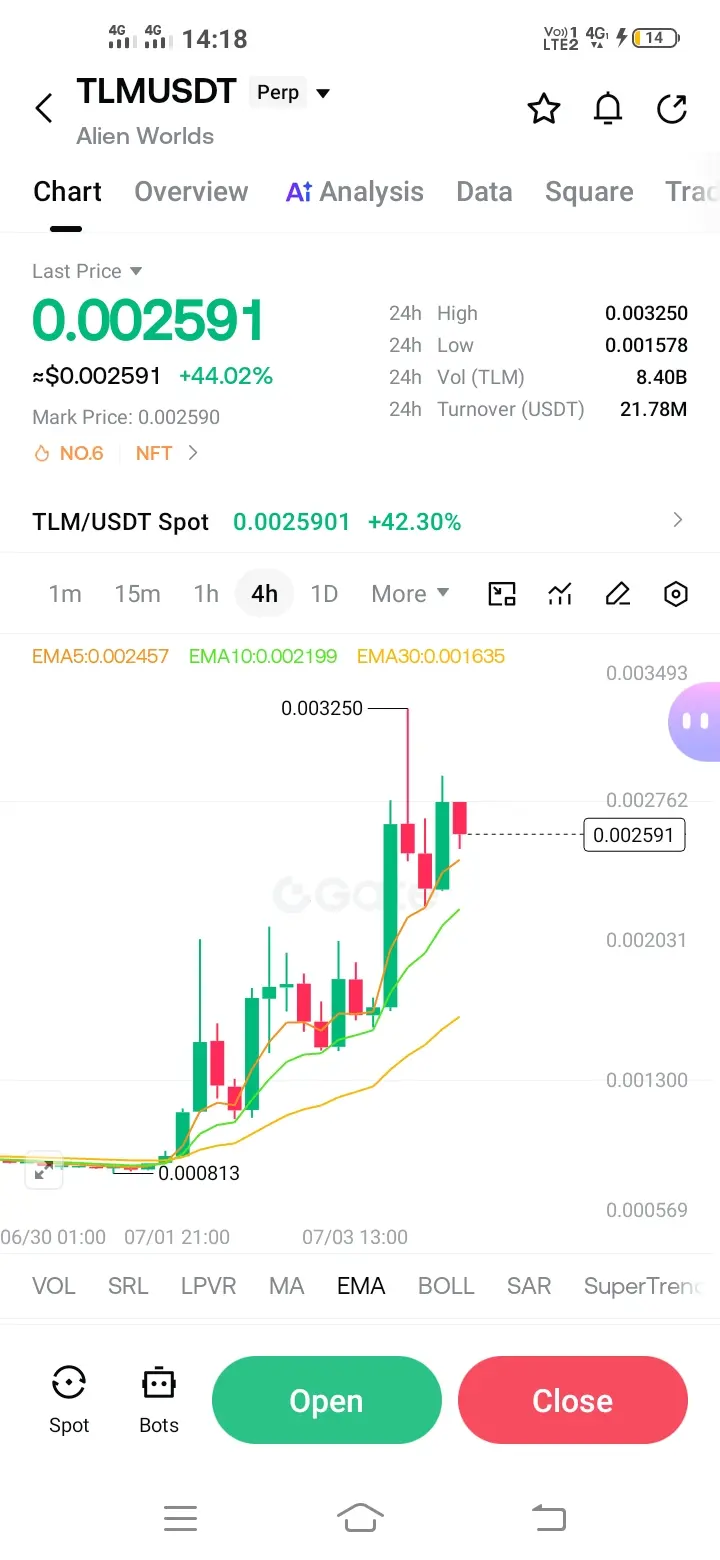
TLM is currently trading within a volatile range after experiencing a remarkable 205% gain over the past 7 days, with price fluctuating between 0.00159 and 0.00328 USDT in the last 24 hours. This represents a 48% volatility level, indicating extreme price swings that require careful position management.
Key Support Levels are identified at three critical zones. SL1 sits at 0.002450 representing a 5.3% downside buffer from current price, SL2 at 0.002280 marking an 11.9% decline threshold, and SL3 at 0.002100 which constitutes an 18.8% risk boundary. These levels align with recent consolid
TLM-16.26%
HighAmbition
#TLM
TLM is currently trading within a volatile range after experiencing a remarkable 205% gain over the past 7 days, with price fluctuating between 0.00159 and 0.00328 USDT in the last 24 hours. This represents a 48% volatility level, indicating extreme price swings that require careful position management.
Key Support Levels are identified at three critical zones. SL1 sits at 0.002450 representing a 5.3% downside buffer from current price, SL2 at 0.002280 marking an 11.9% decline threshold, and SL3 at 0.002100 which constitutes an 18.8% risk boundary. These levels align with recent consolidation zones and psychological round numbers that have historically attracted buying interest.
Key Resistance Levels present upside targets at three distinct tiers. TP1 is positioned at 0.002850 offering a 10.2% gain potential, TP2 at 0.003150 representing a 21.8% upside move, and TP3 at 0.003500 which would deliver a 35.3% return from current levels. The 0.00328 level recently tested serves as immediate overhead resistance.
Technical indicators reveal a mixed picture that traders should monitor closely. The RSI reading of 86.02 indicates severely overbought conditions across multiple timeframes including 15-minute, 4-hour, and daily charts. CCI readings of 146 on the 4-hour and 284 on daily confirm this overbought status. However, bullish moving average alignment persists with prices trading above key MAs. MACD shows bottom divergence on daily timeframe suggesting potential pullback risk. Bollinger Bands have expanded with price breaking above the upper band indicating strong momentum but also elevated reversal probability.
Risk management calculations show optimal position sizing should account for the 48% volatility. A conservative approach allocates 2-3% of portfolio per trade given the elevated risk profile. The risk-reward ratio at TP1 stands at 1.92, at TP2 improves to 1.83, and at TP3 reaches 1.88 when measured against SL1.
Volume analysis reveals a concerning pattern of price rising while volume declines below the 7-day average, suggesting weakening conviction in the rally. This divergence often precedes sharp corrections in small-cap tokens.
Trading Strategy Recommendation involves entering partial positions at current levels with staggered exits. Take 33% profits at TP1, another 33% at TP2, and trail remaining position to TP3 with stop raised to breakeven after TP2 hits. If price rejects at 0.00328 resistance, consider reducing exposure by 50% immediately. Monitor RSI for any drop below 70 as early warning signal. The 7-day moving average at approximately 0.002350 serves as dynamic support for trend continuation assessment.@Gate_Square
repost-content-media
  • Reward
  • 6
  • Repost
  • Share
guroo:
To The Moon 🌕
View More
#TLM
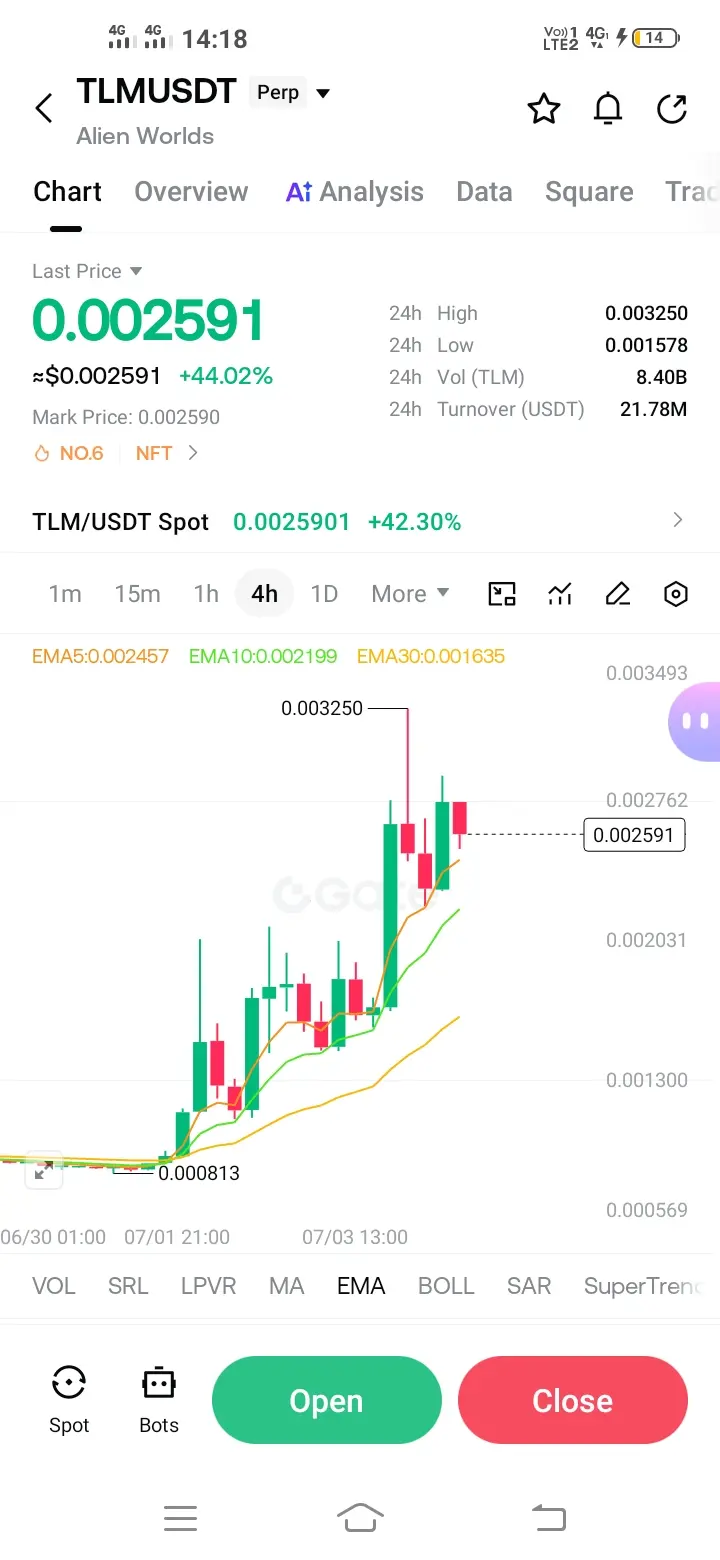
TLM is currently trading within a volatile range after experiencing a remarkable 205% gain over the past 7 days, with price fluctuating between 0.00159 and 0.00328 USDT in the last 24 hours. This represents a 48% volatility level, indicating extreme price swings that require careful position management.
Key Support Levels are identified at three critical zones. SL1 sits at 0.002450 representing a 5.3% downside buffer from current price, SL2 at 0.002280 marking an 11.9% decline threshold, and SL3 at 0.002100 which constitutes an 18.8% risk boundary. These levels align with recent consolid
TLM-16.26%
HighAmbition
#TLM
TLM is currently trading within a volatile range after experiencing a remarkable 205% gain over the past 7 days, with price fluctuating between 0.00159 and 0.00328 USDT in the last 24 hours. This represents a 48% volatility level, indicating extreme price swings that require careful position management.
Key Support Levels are identified at three critical zones. SL1 sits at 0.002450 representing a 5.3% downside buffer from current price, SL2 at 0.002280 marking an 11.9% decline threshold, and SL3 at 0.002100 which constitutes an 18.8% risk boundary. These levels align with recent consolidation zones and psychological round numbers that have historically attracted buying interest.
Key Resistance Levels present upside targets at three distinct tiers. TP1 is positioned at 0.002850 offering a 10.2% gain potential, TP2 at 0.003150 representing a 21.8% upside move, and TP3 at 0.003500 which would deliver a 35.3% return from current levels. The 0.00328 level recently tested serves as immediate overhead resistance.
Technical indicators reveal a mixed picture that traders should monitor closely. The RSI reading of 86.02 indicates severely overbought conditions across multiple timeframes including 15-minute, 4-hour, and daily charts. CCI readings of 146 on the 4-hour and 284 on daily confirm this overbought status. However, bullish moving average alignment persists with prices trading above key MAs. MACD shows bottom divergence on daily timeframe suggesting potential pullback risk. Bollinger Bands have expanded with price breaking above the upper band indicating strong momentum but also elevated reversal probability.
Risk management calculations show optimal position sizing should account for the 48% volatility. A conservative approach allocates 2-3% of portfolio per trade given the elevated risk profile. The risk-reward ratio at TP1 stands at 1.92, at TP2 improves to 1.83, and at TP3 reaches 1.88 when measured against SL1.
Volume analysis reveals a concerning pattern of price rising while volume declines below the 7-day average, suggesting weakening conviction in the rally. This divergence often precedes sharp corrections in small-cap tokens.
Trading Strategy Recommendation involves entering partial positions at current levels with staggered exits. Take 33% profits at TP1, another 33% at TP2, and trail remaining position to TP3 with stop raised to breakeven after TP2 hits. If price rejects at 0.00328 resistance, consider reducing exposure by 50% immediately. Monitor RSI for any drop below 70 as early warning signal. The 7-day moving average at approximately 0.002350 serves as dynamic support for trend continuation assessment.@Gate_Square
repost-content-media
  • Reward
  • 15
  • Repost
  • Share
bandanlage:
Bull Run 🐂Ape In 🚀HODL Tight 💪1000x Vibes 🤑DYOR 🤓
View More
#TLM
TLM is currently trading within a volatile range after experiencing a remarkable 205% gain over the past 7 days, with price fluctuating between 0.00159 and 0.00328 USDT in the last 24 hours. This represents a 48% volatility level, indicating extreme price swings that require careful position management.
Key Support Levels are identified at three critical zones. SL1 sits at 0.002450 representing a 5.3% downside buffer from current price, SL2 at 0.002280 marking an 11.9% decline threshold, and SL3 at 0.002100 which constitutes an 18.8% risk boundary. These levels align with recent consolid
TLM-16.26%
post-image
post-image
  • Reward
  • 32
  • Repost
  • Share
Ai_Power:
To The Moon 🌕
View More
🚀 $TLM JUST EXPLODED +52.8% in 24 Hours! Alien Worlds Breaking Out?
The charts are speaking loud and clear.
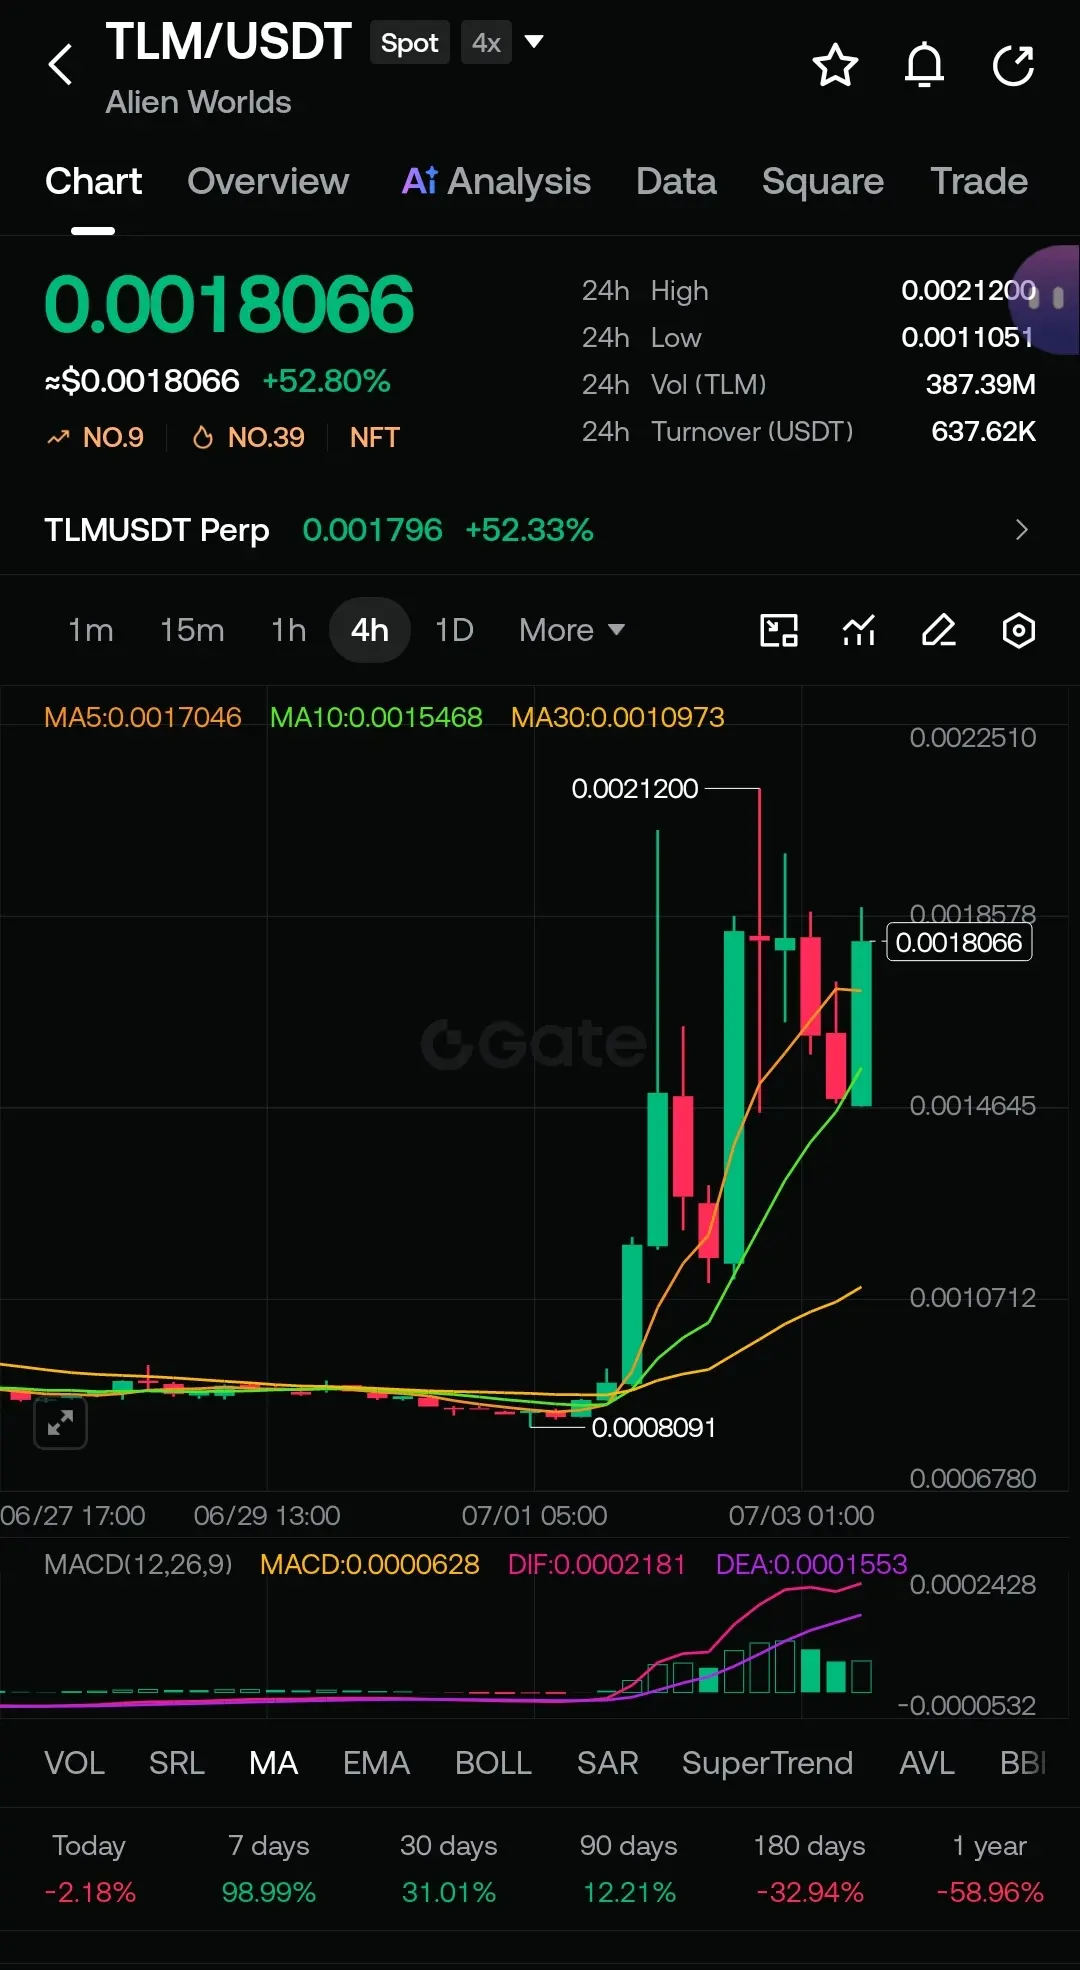
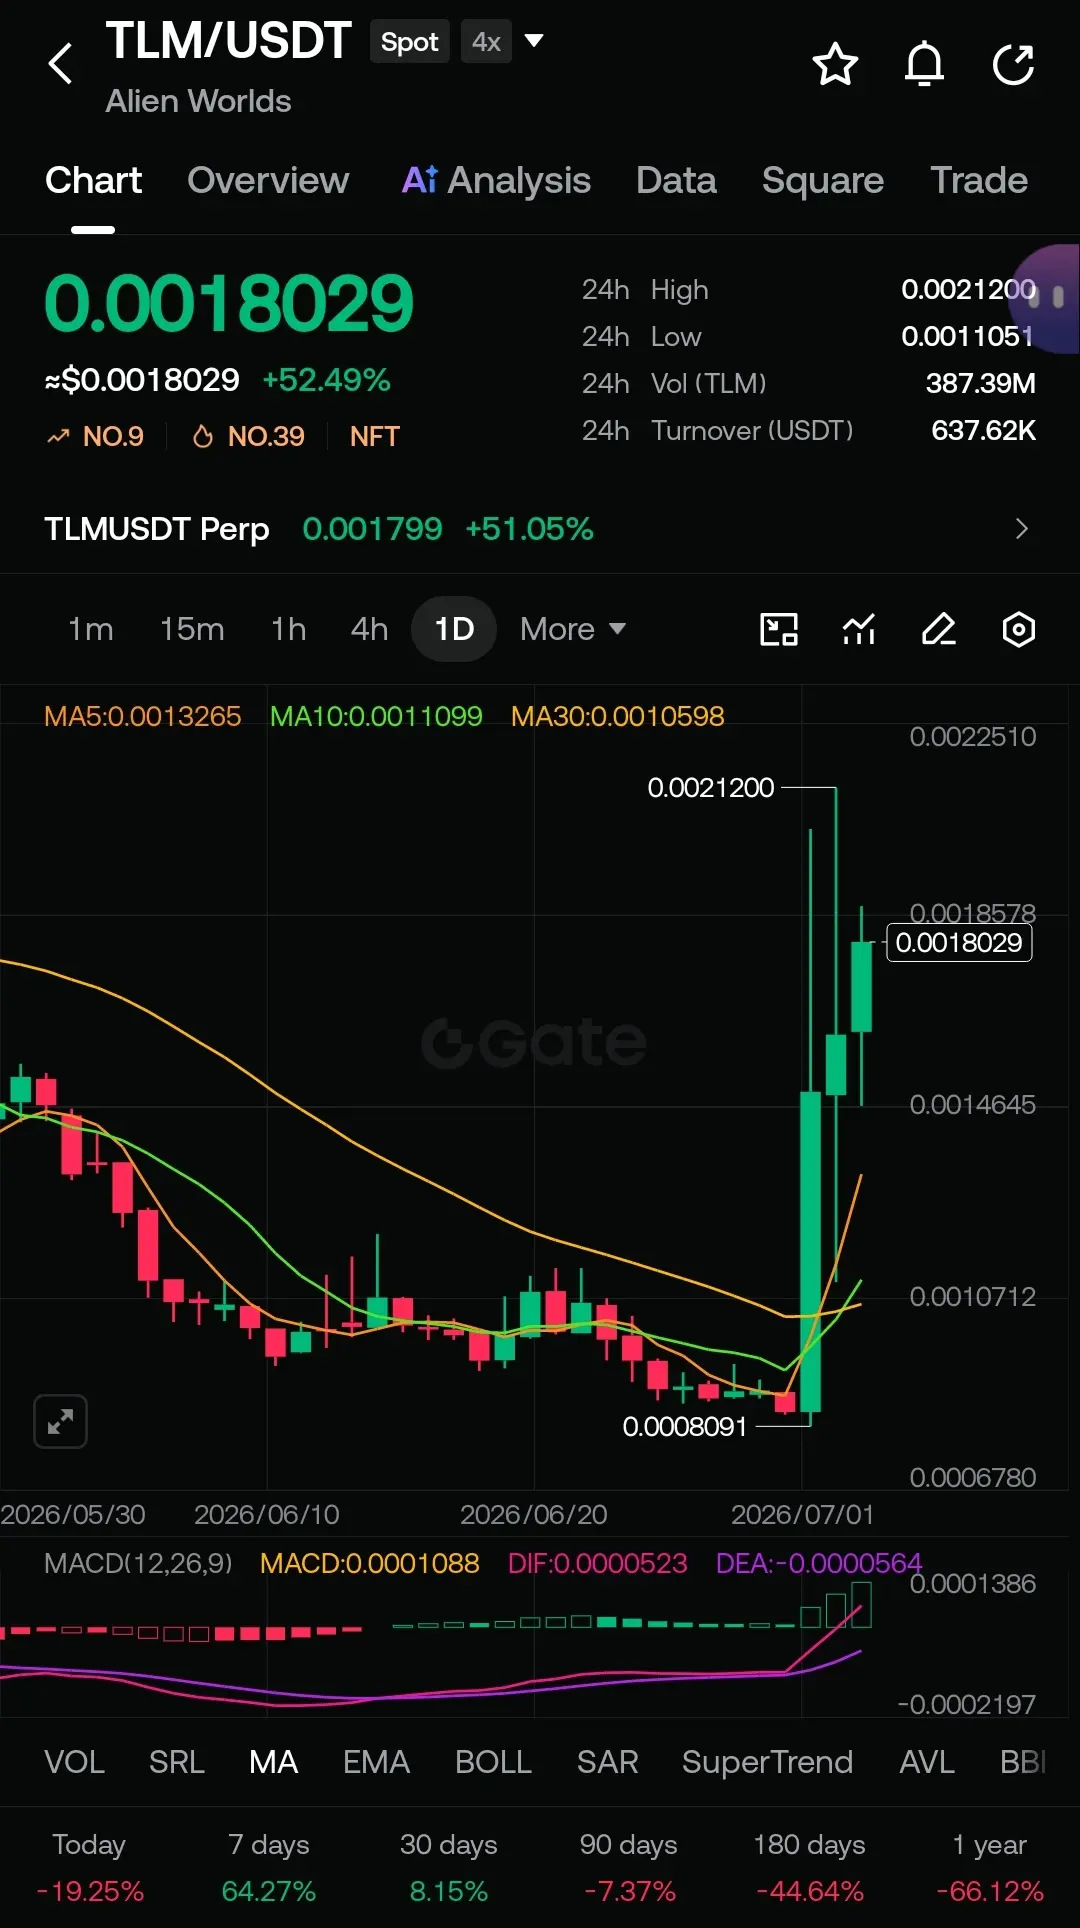
TLM/USDT on Gate.io has delivered a massive breakout with a +52.8% surge in the last 24 hours, pushing the price to $0.0018066.
Key Stats (Spot):
24h High: $0.0021200
24h Low: $0.0011051
24h Volume: 387.39M TLM
24h Turnover: $637.62K
Looking at the 4H and 1D charts, this move is violent — a textbook breakout after months of consolidation, smashing through multiple moving averages with conviction. The volume spike confirms real buying pressure.
Whether this is a short-term momentum play
TLM-16.26%
post-image
post-image
  • Reward
  • 2
  • Repost
  • Share
My_Power:
1000x VIbes 🤑
View More
Legacy GameFi assets can reprice aggressively when the market starts rotating back into gaming narratives.
That is where Alien Worlds becomes interesting again.
$TLM captures exposure to one of the early metaverse and GameFi ecosystems that helped define the previous crypto gaming cycle.
It is not the newest gaming token and that is exactly why traders still watch it.
Crypto markets often revisit recognizable names first when an old sector starts gaining momentum again. Assets with strong cycle memory, exchange access, liquidity, and established narratives tend to attract attention before sma
TLM-16.26%
  • Reward
  • 1
  • Repost
  • Share
GateUser-510a718d:
👍 👍
whales can accumulate it based on volume & chart.
pullback with small risk can give us good profit .
same like $AI , peoples think its done & whales pump it after early sellers out.
so $TLM can follow
#AI #TLM
AI1.27%
TLM-16.26%
  • Reward
  • Comment
  • Repost
  • Share
TLM, also known as Alien Worlds, has been getting a lot of attention these past few days because it surged nearly 3 to 4 times over the past week, but it has already started to drop today. It’s currently around 0.0025u, down nearly 20% on the day.
First, what is this coin for? It’s for an on-chain game. Players mine in the game and earn TLM tokens. This mining model was especially popular in 2021, when it was one of the top on-chain applications by daily active users.
But this game mining model has a fatal problem: the first thing players do with the tokens they mine is sell them, creating con
TLM-16.26%
View Original
  • Reward
  • Comment
  • Repost
  • Share
Short $TLM : ideal resistance zone at 0.00338-0.00348 🎯
Entry: 0.00338 – 0.00348 🔥
Target: 0.00320 🚀
Stop loss: 0.00360 ⚠️
This zone has rejected the price twice in the past 48 hours, and the bearish pressure has not eased. Trading volumes are decreasing with each upward attempt, and that tells me that sellers are still in control. If we see a clear rejection from here, the drop toward 0.00320 may come quickly.
The risk-to-reward ratio is tight if you wait for confirmation at the upper end. Will you take the short trade at 0.00348 or wait for a lower entry?
Not financial advice. Always man
TLM-16.08%
View Original
  • Reward
  • 1
  • Repost
  • Share
GateUser-9bb1ef51:
Thank you for participating. Following market news daily helps in making more informed decisions. I wish you success. 🚀
🔥 The market is boiling.. and the beneficiaries are at their peak excitement!
Today an exceptionally strong session:
🚀 $HMSTR ‌ leads the scene with a fantastic jump **+84.38%**, followed by $TLM و$EPIC و$OGN $GLMR in an unstoppable rising wave.
Those who entered early and sensed the momentum before everyone else — congratulations, you are in the right place.
But remember:
📌 Patience is the key to preserving profits.
📌 Do not chase green candles emotionally.
📌 Wait for confirmation before any step.
The question now:
Who among you is riding this wave? 👀
#HMSTR #TLM #EPIC #OGN #GLMR #Cry
HMSTR13.87%
View Original
  • Reward
  • Comment
  • Repost
  • Share
Load More

Join 40 M users in our growing community

⚡️ Join 40 M users in the crypto craze discussion
💬 Engage with your favorite top creators
👍 See what interests you
  • Pinned