#USStrikesIran
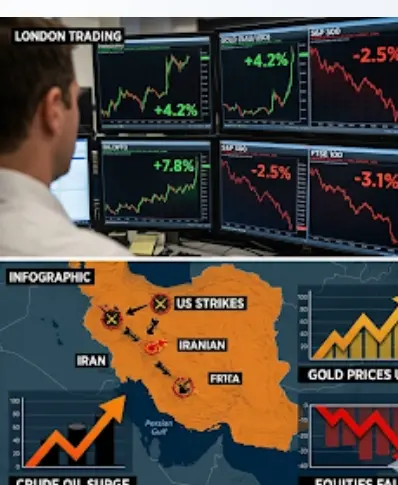
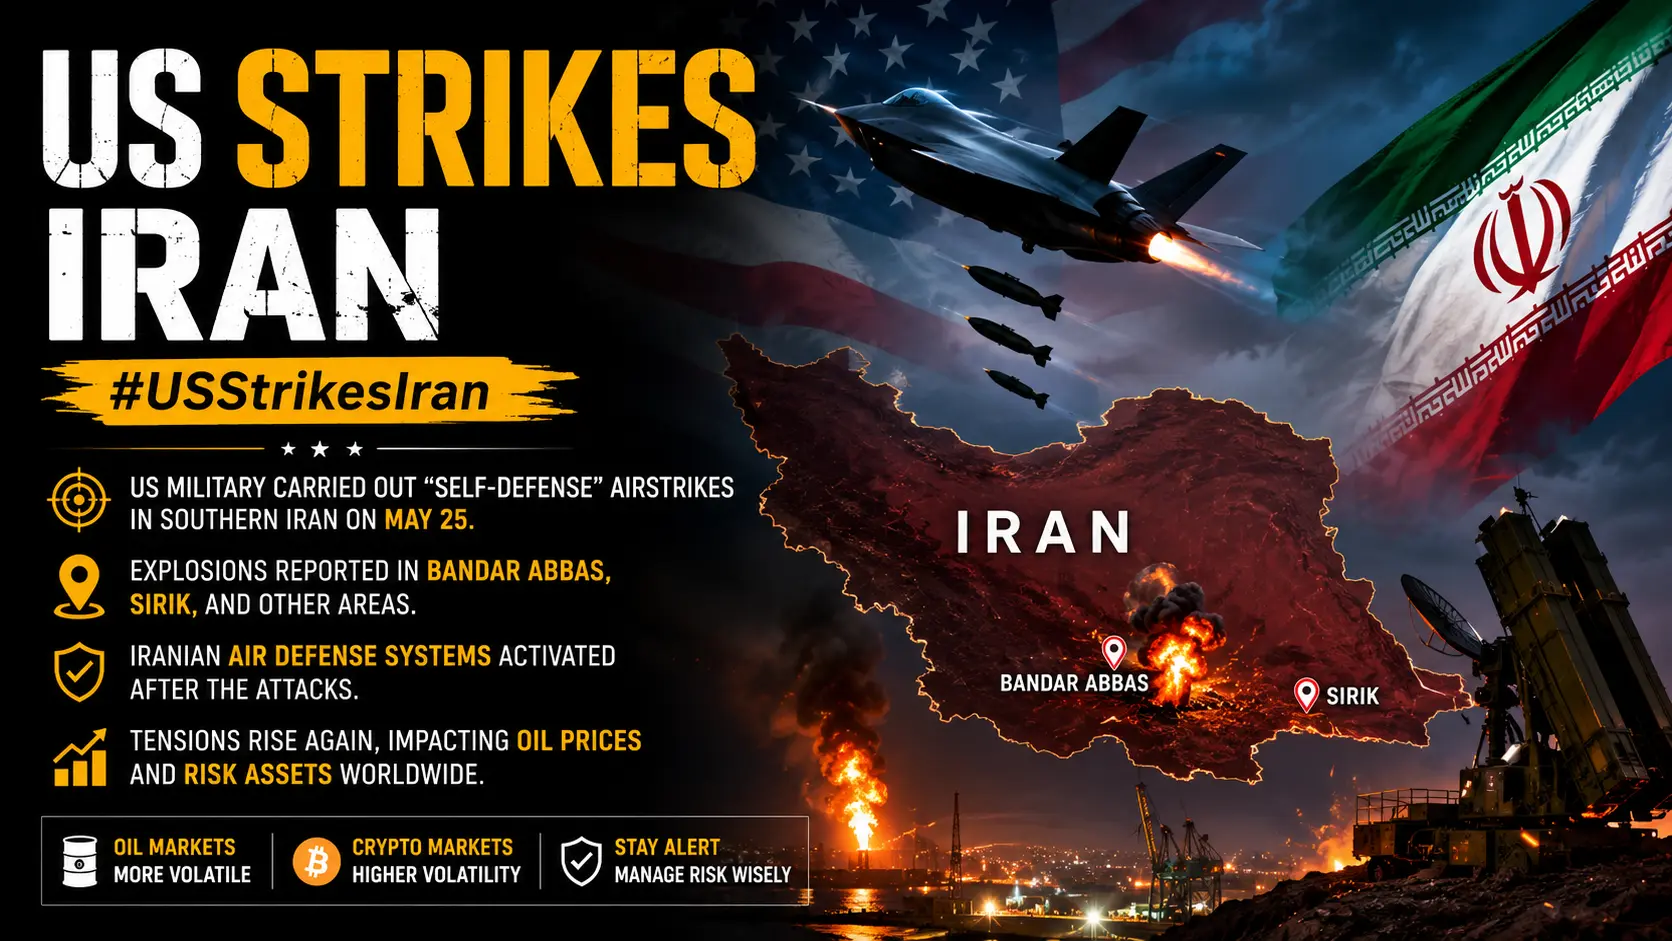
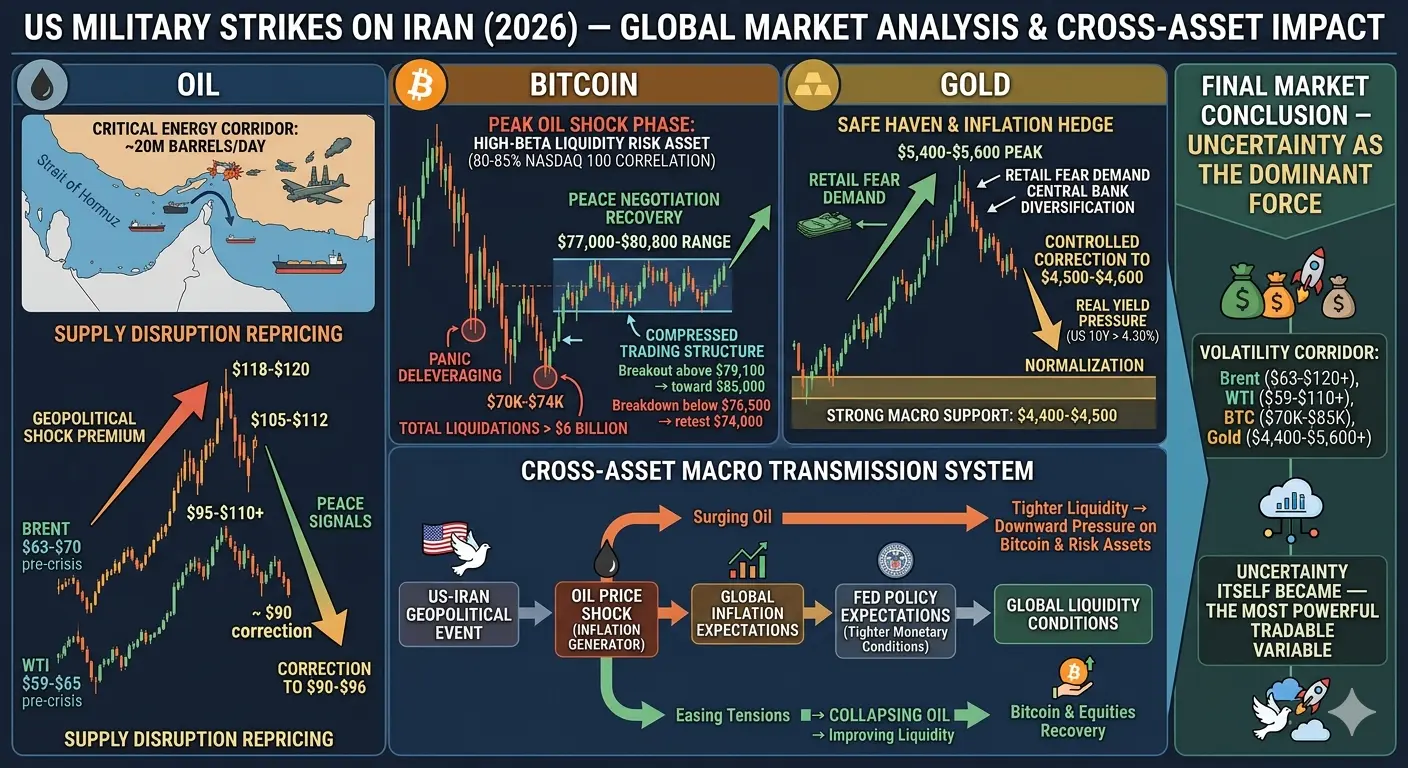
The US military strikes on Iran in 2026 created one of the most intense geopolitical market shocks in recent financial history, because the escalation immediately shifted global attention toward the Strait of Hormuz, which is one of the most strategically important energy corridors in the world responsible for transporting nearly 20 million barrels of crude oil per day, representing roughly one-fifth of global oil consumption, and as soon as military operations intensified, markets rapidly began repricing the probability of supply disruption rather than actual physical shortages, which led to a sharp and aggressive risk premium being added into crude oil pricing, global inflation expectations, and macro volatility indexes, while at the same time forcing investors to reassess liquidity conditions across risk assets, as the entire global system became sensitive not only to actual conflict outcomes but also to headlines, diplomatic signals, and perceived escalation probability.
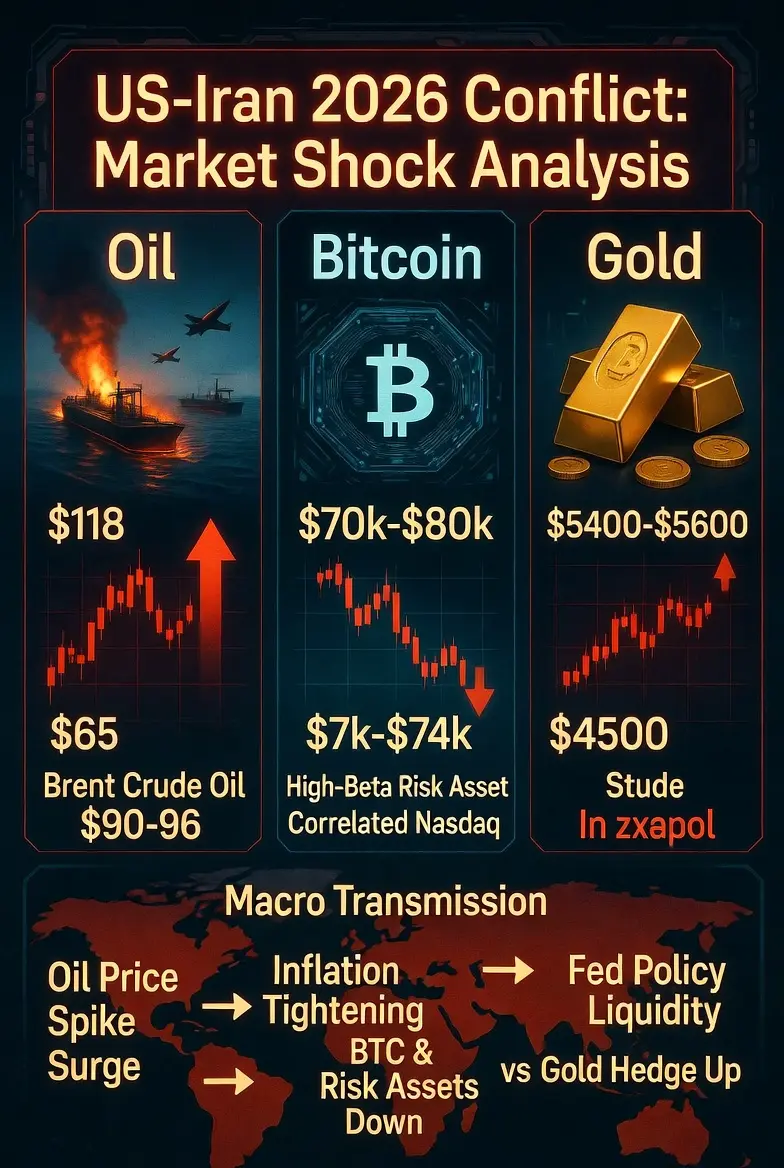
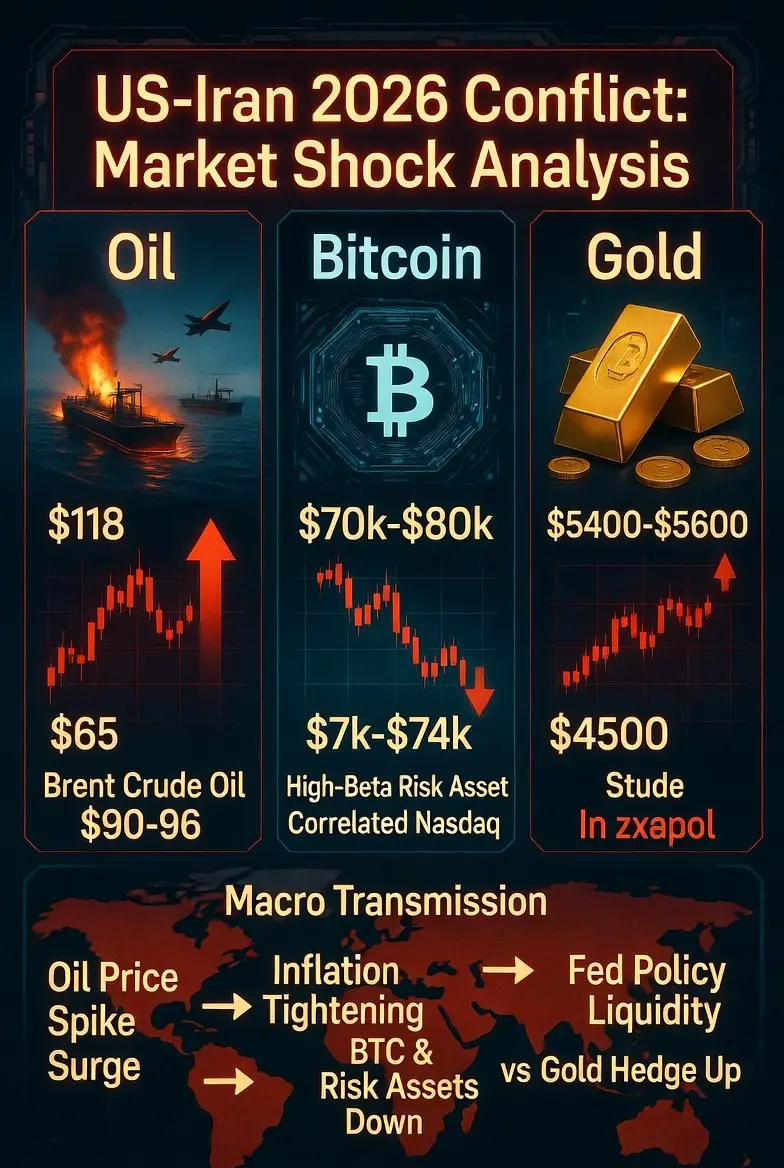
During the initial phase of the conflict, Brent crude oil surged violently from pre-crisis levels in the approximate range of $63 to $70 per barrel into extreme spike zones between $105 and $112 per barrel, with intraday panic extensions reaching as high as $118 to $120 in moments of maximum uncertainty, while WTI crude followed a similar but slightly lower magnitude trajectory, moving from around $59 to $65 into a highly volatile band between $95 and above $110 depending on escalation headlines and shipping risk perceptions, and this movement was not driven by traditional supply-demand fundamentals but rather by geopolitical fear pricing, insurance cost explosions for tanker shipping, and the temporary paralysis of energy logistics through Hormuz, which effectively created a “risk shock premium” estimated between $18 and $48 per barrel depending on market stress intensity.
As the conflict progressed and diplomatic negotiations began to emerge in late May, market structure shifted dramatically once again, particularly after peace signals suggested a potential reopening of the Strait of Hormuz, which triggered a rapid unwinding of geopolitical premiums and caused Brent crude to fall back toward the $90–$96 range, while WTI stabilized closer to the low $90s, demonstrating how deeply the oil market had become dependent on expectations rather than physical disruption, and this rapid repricing cycle highlighted that global commodity markets in 2026 were operating in a high-sensitivity regime where every geopolitical headline had the capacity to move multi-billion-dollar valuations within hours.
2. Bitcoin Market Behavior — Liquidity Driven Risk Asset Dynamics
Bitcoin during this period did not behave like a safe-haven asset as many long-term narratives suggest, but instead functioned as a high-beta liquidity-sensitive risk instrument that was strongly correlated with equity indices such as the Nasdaq 100, with correlation levels reaching as high as approximately 80% to 85% during peak oil shock phases, which clearly demonstrated that BTC was being driven more by macro liquidity conditions than geopolitical fear hedging, and as oil prices surged and inflation expectations increased, markets began pricing in tighter Federal Reserve policy conditions, which reduced expectations for rate cuts and increased the probability of prolonged high interest rates, thereby tightening global liquidity and placing downward pressure on speculative assets including crypto.
During the escalation phase, Bitcoin initially dropped from higher consolidation zones into a volatile range between $70,000 and $74,000, reflecting panic-driven deleveraging and forced liquidation events across futures markets, while total liquidation spikes exceeded hundreds of millions of dollars in single sessions, at times surpassing $6 billion in forced position unwinds during extreme volatility clusters, and this created a structural environment where short-term traders were repeatedly forced out of leveraged positions, amplifying downside movements and accelerating volatility cycles.
However, as geopolitical tension eased and peace negotiations began to dominate market sentiment, Bitcoin recovered sharply into the $77,000 to $80,800 range, with stabilization forming around $77,000 to $77,600 during mid-phase consolidation, and this recovery was supported by improving risk sentiment, partial easing of oil-driven inflation fears, and renewed expectations that central banks might eventually reintroduce liquidity support if energy inflation pressures subsided, while technical analysis showed key resistance forming around the short-term holder cost basis near $79,100 and a broader equilibrium level near $78,200, creating a compressed trading structure where a breakout above $79,100 could potentially unlock upside momentum toward $80,800 and $85,000, whereas a breakdown below $76,500 risked triggering another wave of liquidation-driven volatility and possible retests of $74,000 levels.
3. Oil Market Structure — Geopolitical Premium and Supply Shock Pricing
The oil market remained the central transmission mechanism of the entire crisis, because every escalation in military tension or diplomatic uncertainty directly translated into immediate repricing of crude benchmarks, with Brent crude acting as the global reference benchmark and WTI reflecting domestic US pricing dynamics, and during the peak of the crisis Brent oscillated between extreme levels of $105 to $112 under sustained pressure, while occasionally spiking into the $118–$120 zone during high-risk headlines, and WTI mirrored this movement within a slightly lower but still historically elevated band of $95 to above $110, reflecting the magnitude of perceived disruption risk to Middle Eastern supply routes.
What made this cycle particularly important was that actual physical supply loss remained limited compared to pricing impact, meaning that the majority of the oil price surge was driven by risk premium expansion rather than structural shortage, as global production data still indicated supply exceeding demand in several regions, yet market psychology heavily weighted worst-case scenarios involving prolonged closure of the Strait of Hormuz, which would theoretically remove up to 20% of global oil flows, and this tail-risk scenario alone was sufficient to push prices into extreme valuation zones.
As peace expectations increased, oil prices began correcting aggressively, with Brent falling back into the $90–$96 range and WTI stabilizing near $90, effectively removing a significant portion of the geopolitical premium that had been built into pricing, and this correction also had a cascading effect on global inflation expectations, shipping costs, airline fuel margins, and broader commodity-linked equities, as energy-sensitive sectors quickly rotated in response to changing macro conditions.
4. Gold Market Dynamics — Inflation Hedge vs Real Yield Pressure
Gold initially reacted strongly as a traditional safe-haven and inflation hedge asset, surging into extreme highs between $5,400 and $5,600 per ounce during peak geopolitical panic when oil prices were elevated and inflation expectations were rapidly accelerating, and this movement was supported by both retail fear demand and institutional accumulation as central banks continued long-term diversification away from US dollar reserves, reinforcing gold’s structural bullish narrative.
However, as geopolitical tensions began to ease and peace negotiations gained traction, gold experienced a controlled correction toward the $4,500–$4,600 range, as US dollar strength increased and Treasury yields rose above the 4.30% level on the 10-year bond, increasing the opportunity cost of holding non-yielding assets, which reduced speculative momentum in gold despite its long-term structural support.
Even with this correction, gold maintained strong macro support levels around $4,400 to $4,500, while resistance remained firmly positioned near $4,950 and the previous all-time high near $5,600, indicating that the metal had transitioned from a pure crisis-driven rally into a consolidation phase influenced by competing forces of inflation expectations, interest rate policy, and safe-haven demand normalization.
5. Cross-Asset Macro Transmission System
The most important insight from this entire geopolitical episode is that global markets operated as a tightly integrated transmission system where oil acted as the primary inflation shock generator, Bitcoin functioned as a liquidity-sensitive high-beta risk asset, and gold operated as a hybrid inflation and crisis hedge, but none of these assets moved independently, because oil price shocks directly influenced inflation expectations, which then shaped Federal Reserve policy expectations, which ultimately determined global liquidity conditions, and this liquidity environment dictated the direction of both crypto and equity markets.
When oil surged, inflation expectations increased, forcing central banks toward tighter monetary policy, which reduced liquidity and pressured Bitcoin and risk assets while simultaneously boosting gold as a hedge, but when peace expectations emerged, oil prices collapsed, inflation expectations cooled, liquidity conditions improved, and Bitcoin and equities recovered while gold softened from peak levels, demonstrating a fully synchronized macro feedback loop driven by geopolitical narrative shifts.
6. Uncertainty as the Dominant Force
The US-Iran geopolitical crisis ultimately demonstrated that modern financial markets are no longer driven purely by economic fundamentals but are increasingly dominated by expectation-based pricing of geopolitical risk, liquidity conditions, and central bank reaction functions, and during this period Brent crude fluctuated between $63 and above $120, WTI ranged from $59 to above $110, Bitcoin moved within a $70,000 to $85,000 volatility corridor, and gold oscillated between $4,400 and $5,600+, showing that every major asset class was effectively embedded within a single macro uncertainty framework.
The defining conclusion of this entire phase is that uncertainty itself became the most powerful tradable variable in global markets, because every headline regarding war escalation or peace negotiation instantly reallocated billions of dollars across commodities, crypto, bonds, and equities, proving that in the current financial regime, price action is no longer just a reflection of supply and demand but a real-time expression of global geopolitical probability distribution.@Gate_Square @Gate广场_Official
#StockTradingChallengeUpTo17000U #TradeCFDWinGold #CryptoSurvivalGuide
The US military strikes on Iran in 2026 created one of the most intense geopolitical market shocks in recent financial history, because the escalation immediately shifted global attention toward the Strait of Hormuz, which is one of the most strategically important energy corridors in the world responsible for transporting nearly 20 million barrels of crude oil per day, representing roughly one-fifth of global oil consumption, and as soon as military operations intensified, markets rapidly began repricing the probability of supply disruption rather than actual physical shortages, which led to a sharp and aggressive risk premium being added into crude oil pricing, global inflation expectations, and macro volatility indexes, while at the same time forcing investors to reassess liquidity conditions across risk assets, as the entire global system became sensitive not only to actual conflict outcomes but also to headlines, diplomatic signals, and perceived escalation probability.
During the initial phase of the conflict, Brent crude oil surged violently from pre-crisis levels in the approximate range of $63 to $70 per barrel into extreme spike zones between $105 and $112 per barrel, with intraday panic extensions reaching as high as $118 to $120 in moments of maximum uncertainty, while WTI crude followed a similar but slightly lower magnitude trajectory, moving from around $59 to $65 into a highly volatile band between $95 and above $110 depending on escalation headlines and shipping risk perceptions, and this movement was not driven by traditional supply-demand fundamentals but rather by geopolitical fear pricing, insurance cost explosions for tanker shipping, and the temporary paralysis of energy logistics through Hormuz, which effectively created a “risk shock premium” estimated between $18 and $48 per barrel depending on market stress intensity.
As the conflict progressed and diplomatic negotiations began to emerge in late May, market structure shifted dramatically once again, particularly after peace signals suggested a potential reopening of the Strait of Hormuz, which triggered a rapid unwinding of geopolitical premiums and caused Brent crude to fall back toward the $90–$96 range, while WTI stabilized closer to the low $90s, demonstrating how deeply the oil market had become dependent on expectations rather than physical disruption, and this rapid repricing cycle highlighted that global commodity markets in 2026 were operating in a high-sensitivity regime where every geopolitical headline had the capacity to move multi-billion-dollar valuations within hours.
2. Bitcoin Market Behavior — Liquidity Driven Risk Asset Dynamics
Bitcoin during this period did not behave like a safe-haven asset as many long-term narratives suggest, but instead functioned as a high-beta liquidity-sensitive risk instrument that was strongly correlated with equity indices such as the Nasdaq 100, with correlation levels reaching as high as approximately 80% to 85% during peak oil shock phases, which clearly demonstrated that BTC was being driven more by macro liquidity conditions than geopolitical fear hedging, and as oil prices surged and inflation expectations increased, markets began pricing in tighter Federal Reserve policy conditions, which reduced expectations for rate cuts and increased the probability of prolonged high interest rates, thereby tightening global liquidity and placing downward pressure on speculative assets including crypto.
During the escalation phase, Bitcoin initially dropped from higher consolidation zones into a volatile range between $70,000 and $74,000, reflecting panic-driven deleveraging and forced liquidation events across futures markets, while total liquidation spikes exceeded hundreds of millions of dollars in single sessions, at times surpassing $6 billion in forced position unwinds during extreme volatility clusters, and this created a structural environment where short-term traders were repeatedly forced out of leveraged positions, amplifying downside movements and accelerating volatility cycles.
However, as geopolitical tension eased and peace negotiations began to dominate market sentiment, Bitcoin recovered sharply into the $77,000 to $80,800 range, with stabilization forming around $77,000 to $77,600 during mid-phase consolidation, and this recovery was supported by improving risk sentiment, partial easing of oil-driven inflation fears, and renewed expectations that central banks might eventually reintroduce liquidity support if energy inflation pressures subsided, while technical analysis showed key resistance forming around the short-term holder cost basis near $79,100 and a broader equilibrium level near $78,200, creating a compressed trading structure where a breakout above $79,100 could potentially unlock upside momentum toward $80,800 and $85,000, whereas a breakdown below $76,500 risked triggering another wave of liquidation-driven volatility and possible retests of $74,000 levels.
3. Oil Market Structure — Geopolitical Premium and Supply Shock Pricing
The oil market remained the central transmission mechanism of the entire crisis, because every escalation in military tension or diplomatic uncertainty directly translated into immediate repricing of crude benchmarks, with Brent crude acting as the global reference benchmark and WTI reflecting domestic US pricing dynamics, and during the peak of the crisis Brent oscillated between extreme levels of $105 to $112 under sustained pressure, while occasionally spiking into the $118–$120 zone during high-risk headlines, and WTI mirrored this movement within a slightly lower but still historically elevated band of $95 to above $110, reflecting the magnitude of perceived disruption risk to Middle Eastern supply routes.
What made this cycle particularly important was that actual physical supply loss remained limited compared to pricing impact, meaning that the majority of the oil price surge was driven by risk premium expansion rather than structural shortage, as global production data still indicated supply exceeding demand in several regions, yet market psychology heavily weighted worst-case scenarios involving prolonged closure of the Strait of Hormuz, which would theoretically remove up to 20% of global oil flows, and this tail-risk scenario alone was sufficient to push prices into extreme valuation zones.
As peace expectations increased, oil prices began correcting aggressively, with Brent falling back into the $90–$96 range and WTI stabilizing near $90, effectively removing a significant portion of the geopolitical premium that had been built into pricing, and this correction also had a cascading effect on global inflation expectations, shipping costs, airline fuel margins, and broader commodity-linked equities, as energy-sensitive sectors quickly rotated in response to changing macro conditions.
4. Gold Market Dynamics — Inflation Hedge vs Real Yield Pressure
Gold initially reacted strongly as a traditional safe-haven and inflation hedge asset, surging into extreme highs between $5,400 and $5,600 per ounce during peak geopolitical panic when oil prices were elevated and inflation expectations were rapidly accelerating, and this movement was supported by both retail fear demand and institutional accumulation as central banks continued long-term diversification away from US dollar reserves, reinforcing gold’s structural bullish narrative.
However, as geopolitical tensions began to ease and peace negotiations gained traction, gold experienced a controlled correction toward the $4,500–$4,600 range, as US dollar strength increased and Treasury yields rose above the 4.30% level on the 10-year bond, increasing the opportunity cost of holding non-yielding assets, which reduced speculative momentum in gold despite its long-term structural support.
Even with this correction, gold maintained strong macro support levels around $4,400 to $4,500, while resistance remained firmly positioned near $4,950 and the previous all-time high near $5,600, indicating that the metal had transitioned from a pure crisis-driven rally into a consolidation phase influenced by competing forces of inflation expectations, interest rate policy, and safe-haven demand normalization.
5. Cross-Asset Macro Transmission System
The most important insight from this entire geopolitical episode is that global markets operated as a tightly integrated transmission system where oil acted as the primary inflation shock generator, Bitcoin functioned as a liquidity-sensitive high-beta risk asset, and gold operated as a hybrid inflation and crisis hedge, but none of these assets moved independently, because oil price shocks directly influenced inflation expectations, which then shaped Federal Reserve policy expectations, which ultimately determined global liquidity conditions, and this liquidity environment dictated the direction of both crypto and equity markets.
When oil surged, inflation expectations increased, forcing central banks toward tighter monetary policy, which reduced liquidity and pressured Bitcoin and risk assets while simultaneously boosting gold as a hedge, but when peace expectations emerged, oil prices collapsed, inflation expectations cooled, liquidity conditions improved, and Bitcoin and equities recovered while gold softened from peak levels, demonstrating a fully synchronized macro feedback loop driven by geopolitical narrative shifts.
6. Uncertainty as the Dominant Force
The US-Iran geopolitical crisis ultimately demonstrated that modern financial markets are no longer driven purely by economic fundamentals but are increasingly dominated by expectation-based pricing of geopolitical risk, liquidity conditions, and central bank reaction functions, and during this period Brent crude fluctuated between $63 and above $120, WTI ranged from $59 to above $110, Bitcoin moved within a $70,000 to $85,000 volatility corridor, and gold oscillated between $4,400 and $5,600+, showing that every major asset class was effectively embedded within a single macro uncertainty framework.
The defining conclusion of this entire phase is that uncertainty itself became the most powerful tradable variable in global markets, because every headline regarding war escalation or peace negotiation instantly reallocated billions of dollars across commodities, crypto, bonds, and equities, proving that in the current financial regime, price action is no longer just a reflection of supply and demand but a real-time expression of global geopolitical probability distribution.@Gate_Square @Gate广场_Official
#StockTradingChallengeUpTo17000U #TradeCFDWinGold #CryptoSurvivalGuide