Dream379

vip
Age 3.8 Year
Peak Tier 1
No content yet
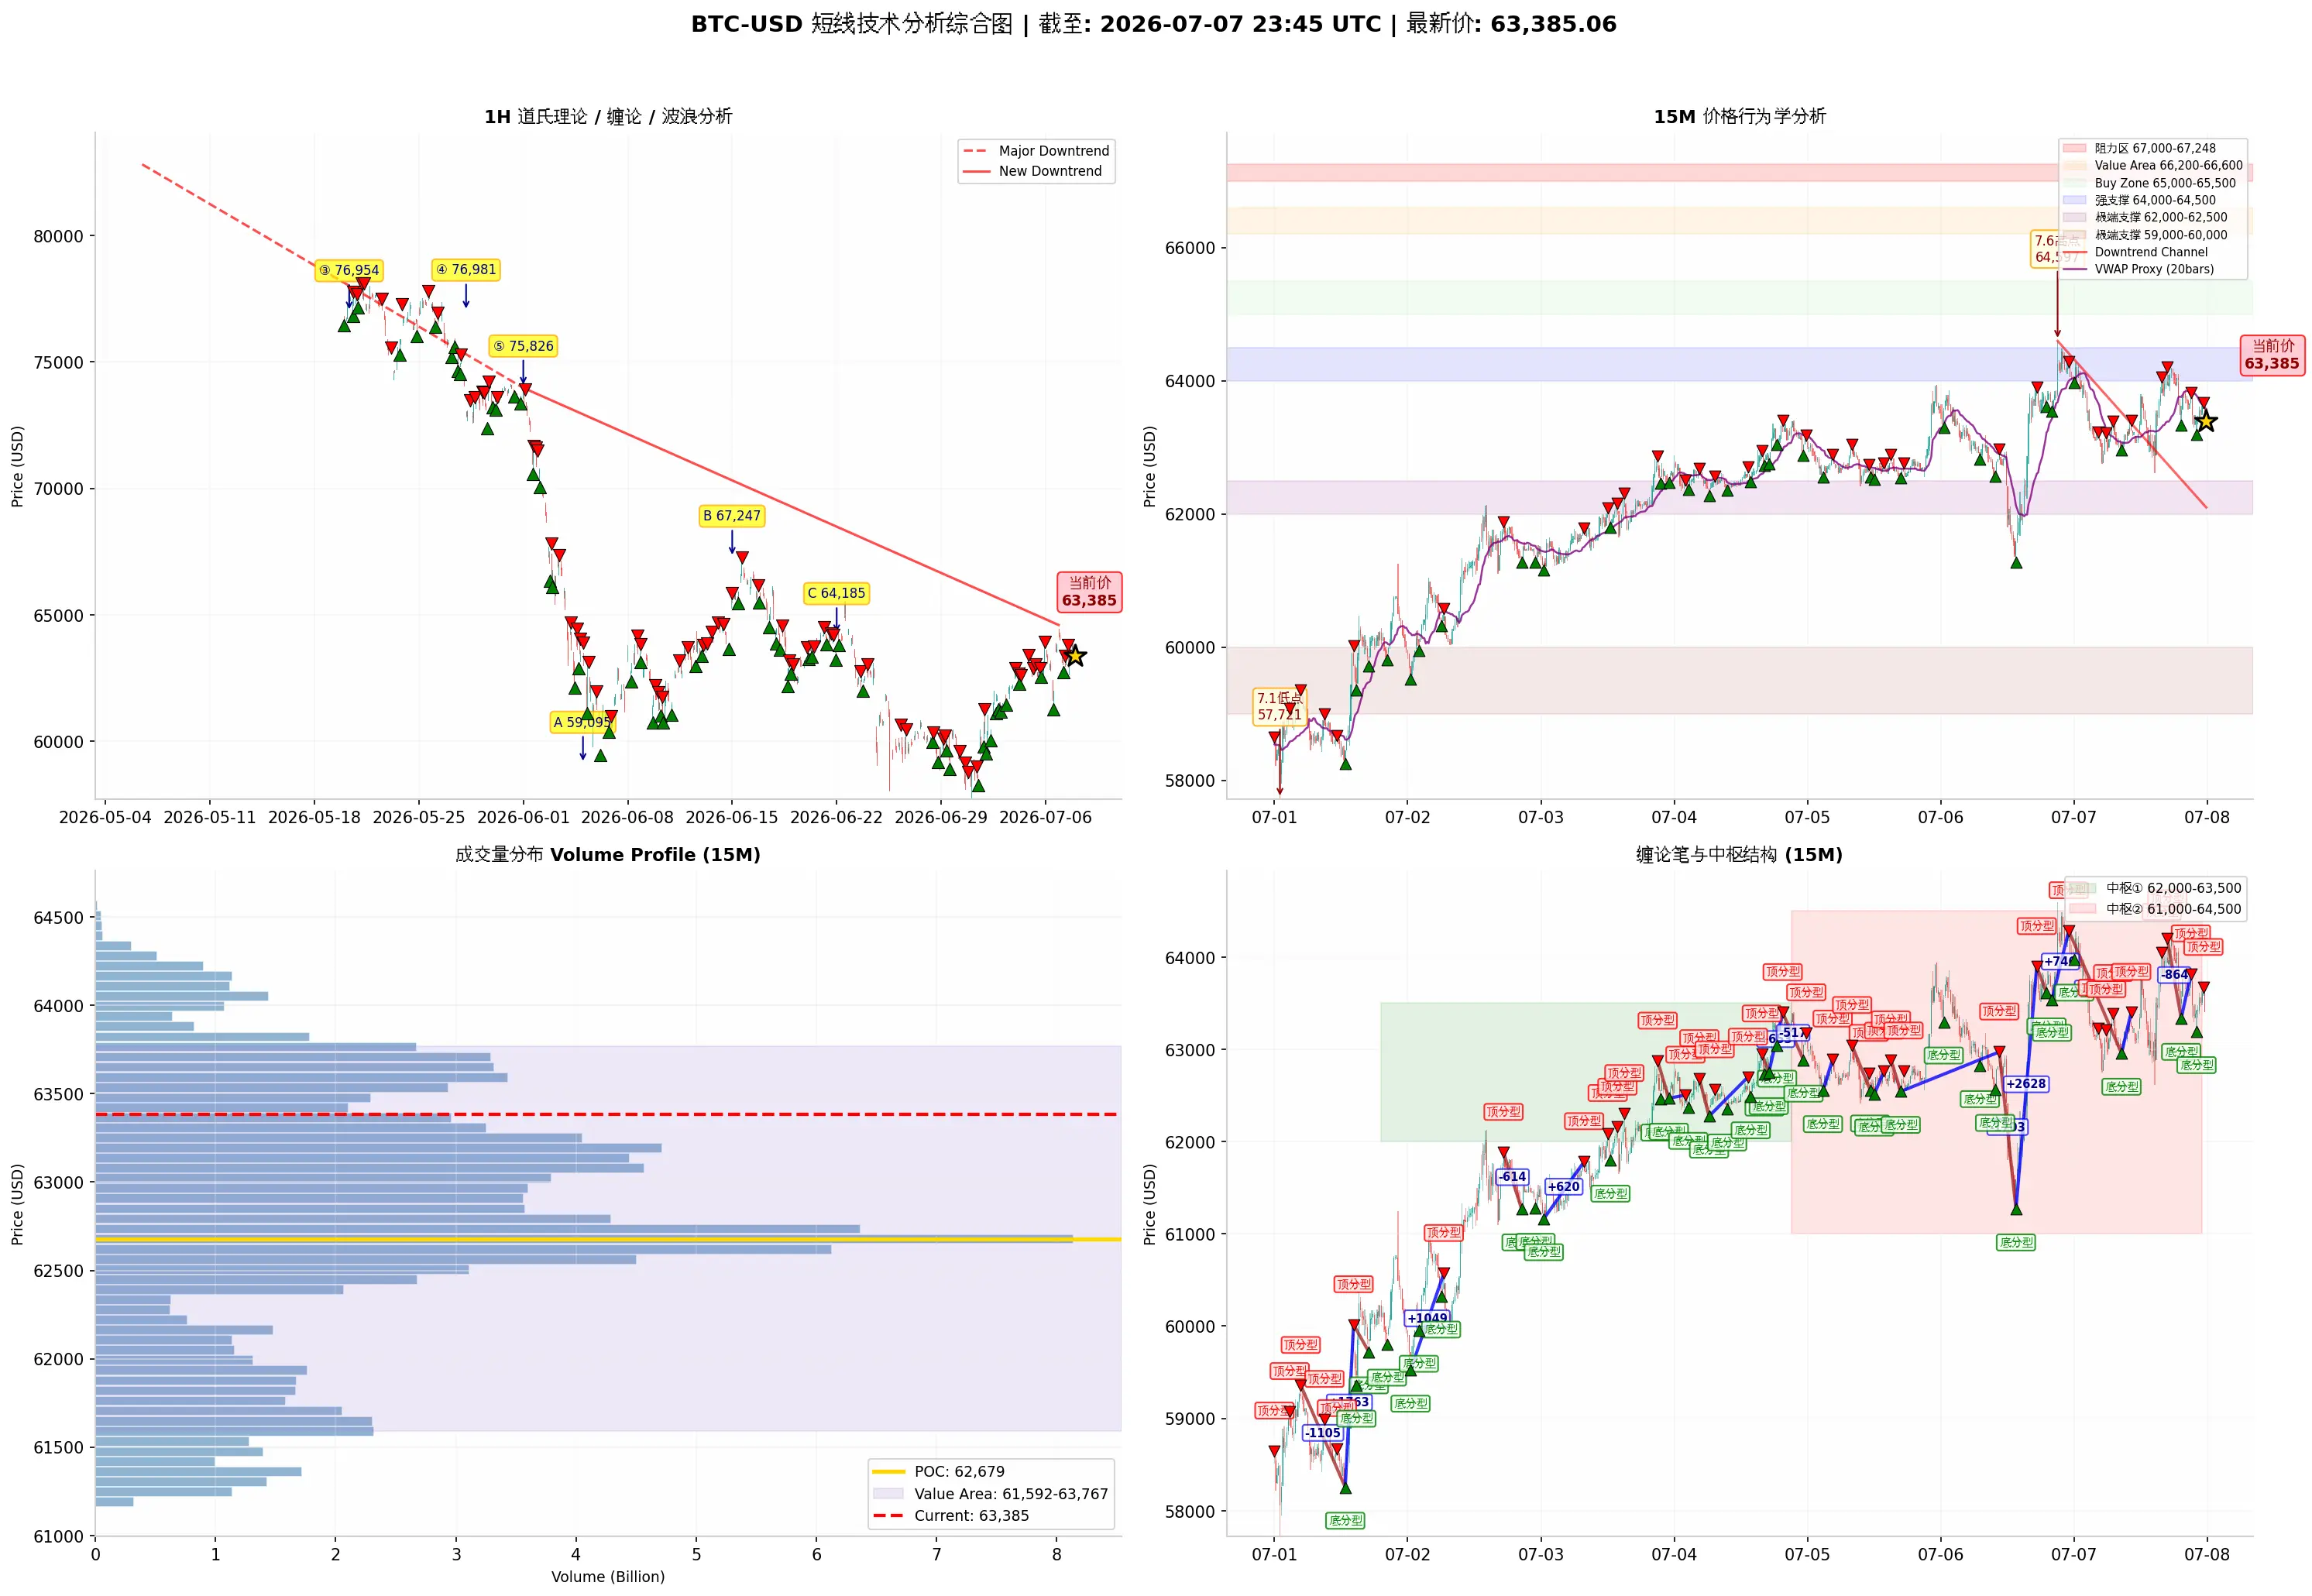
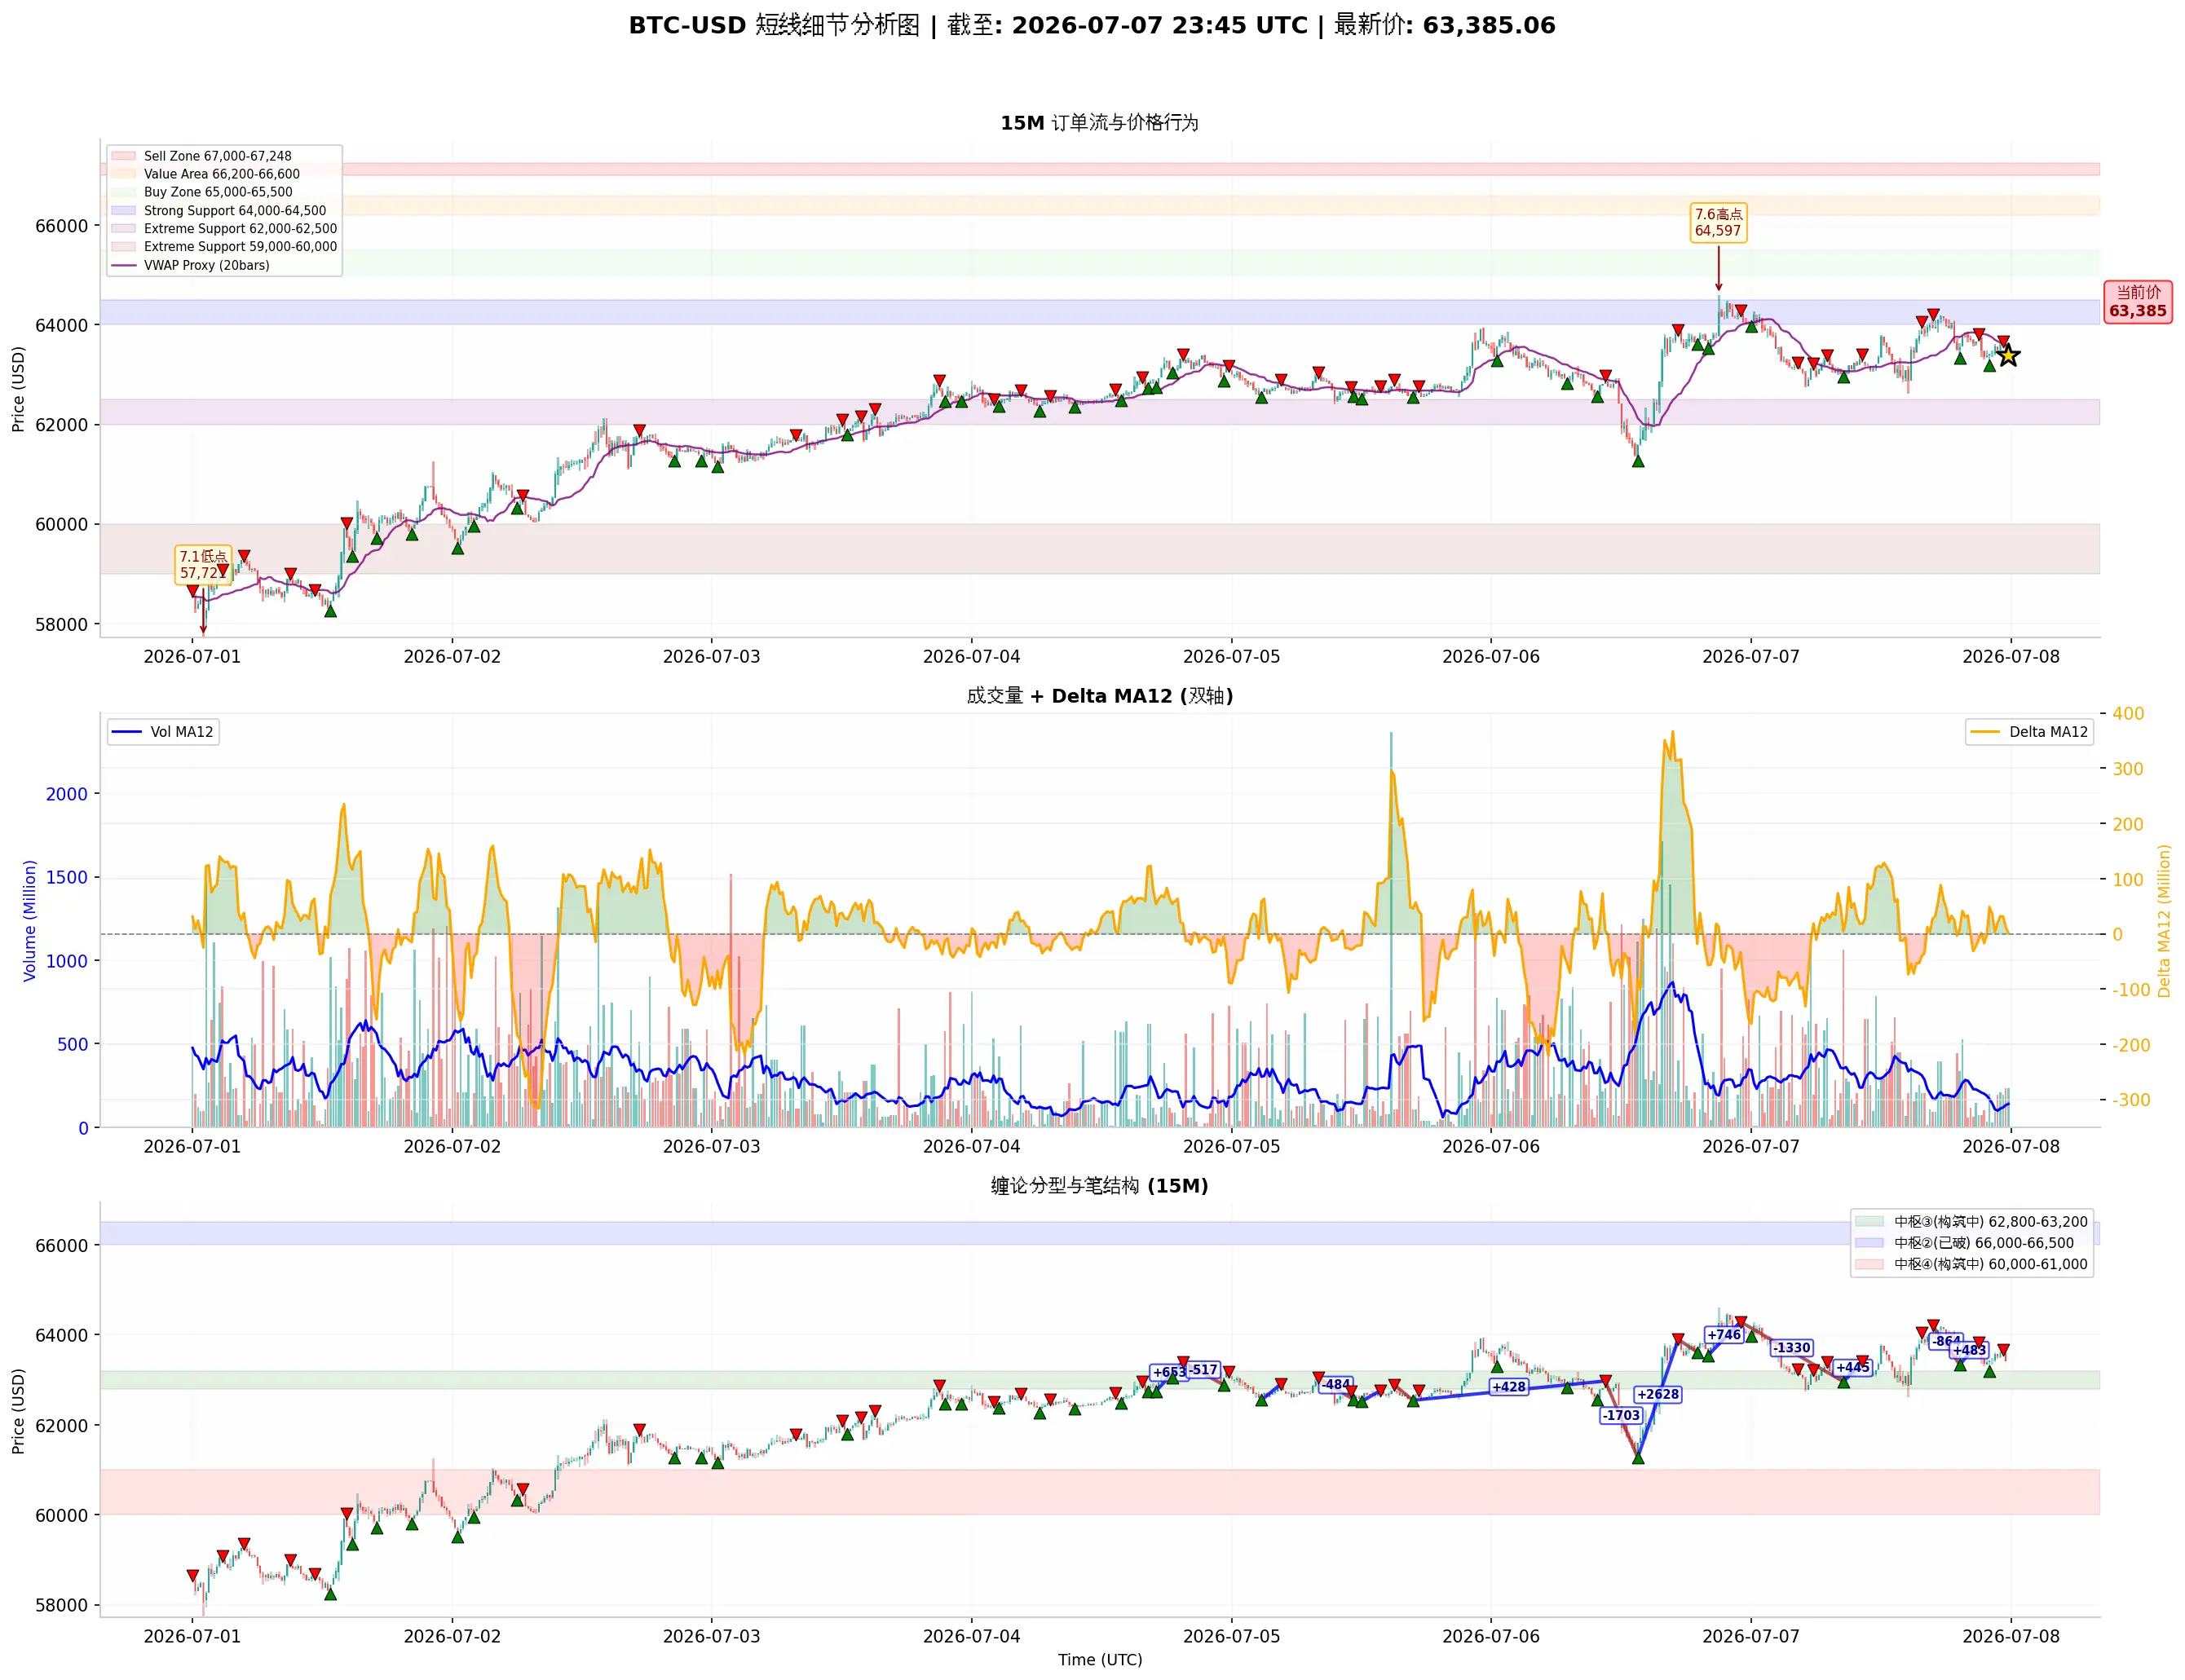
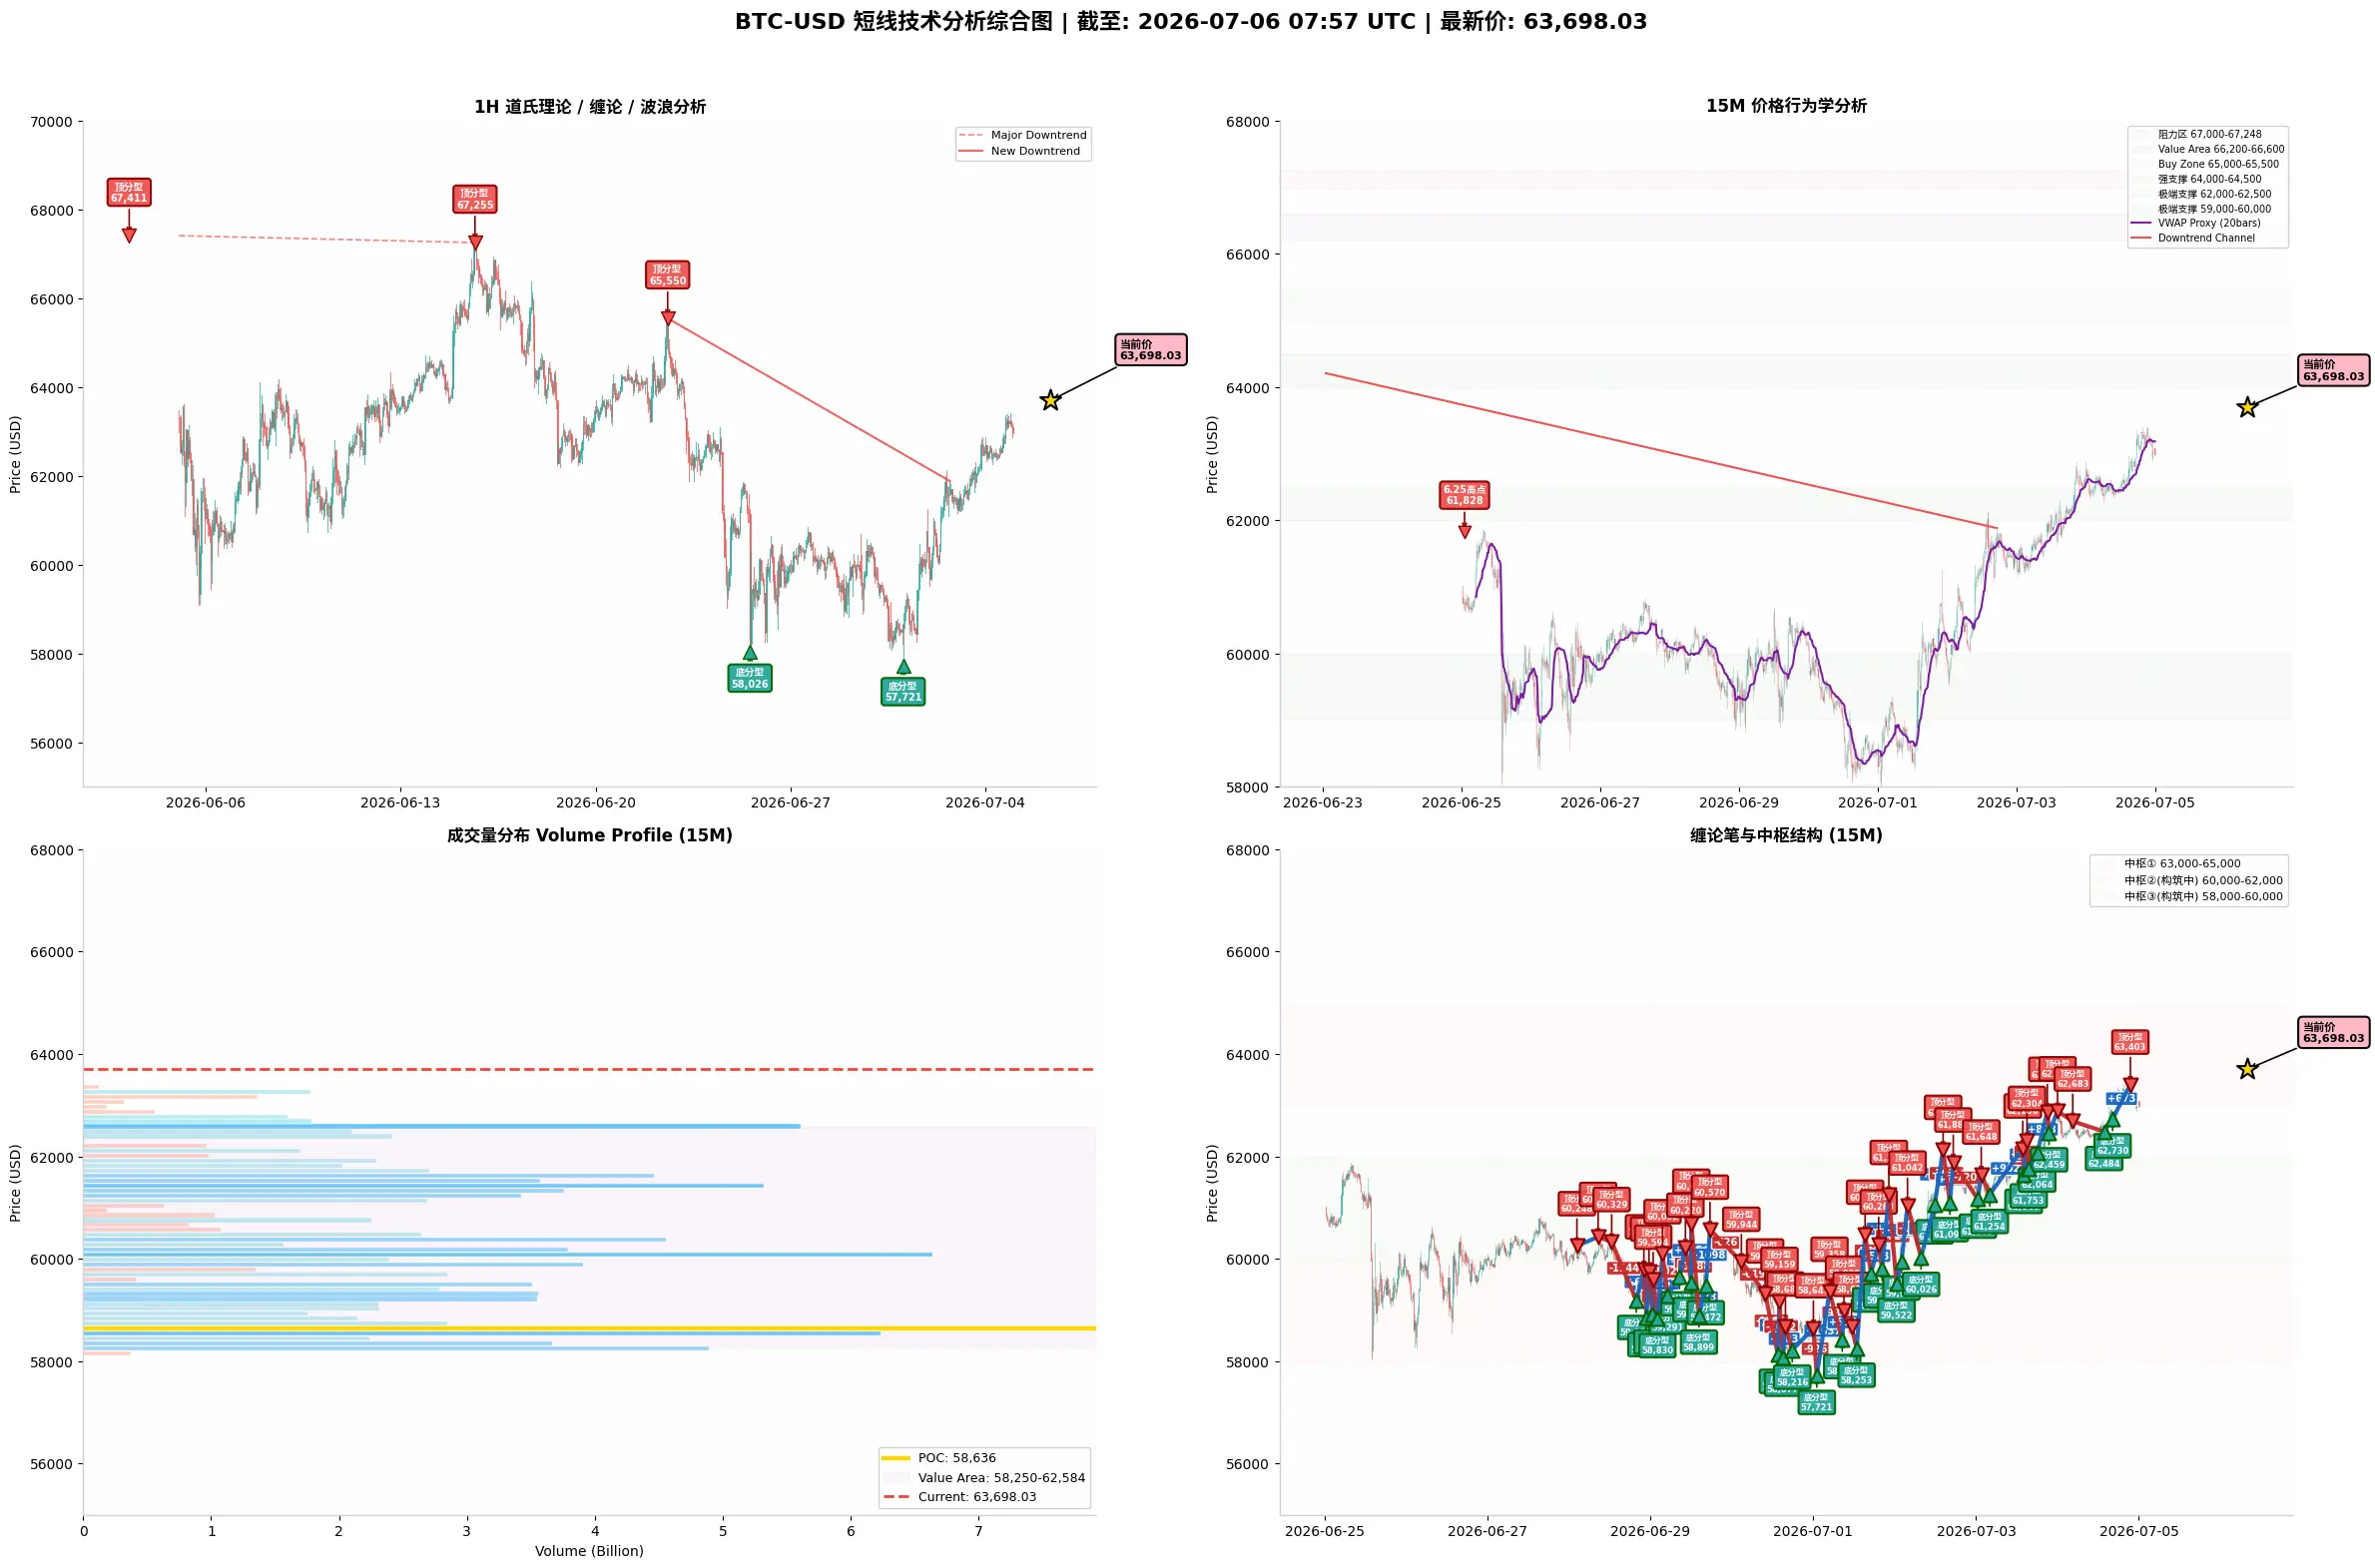
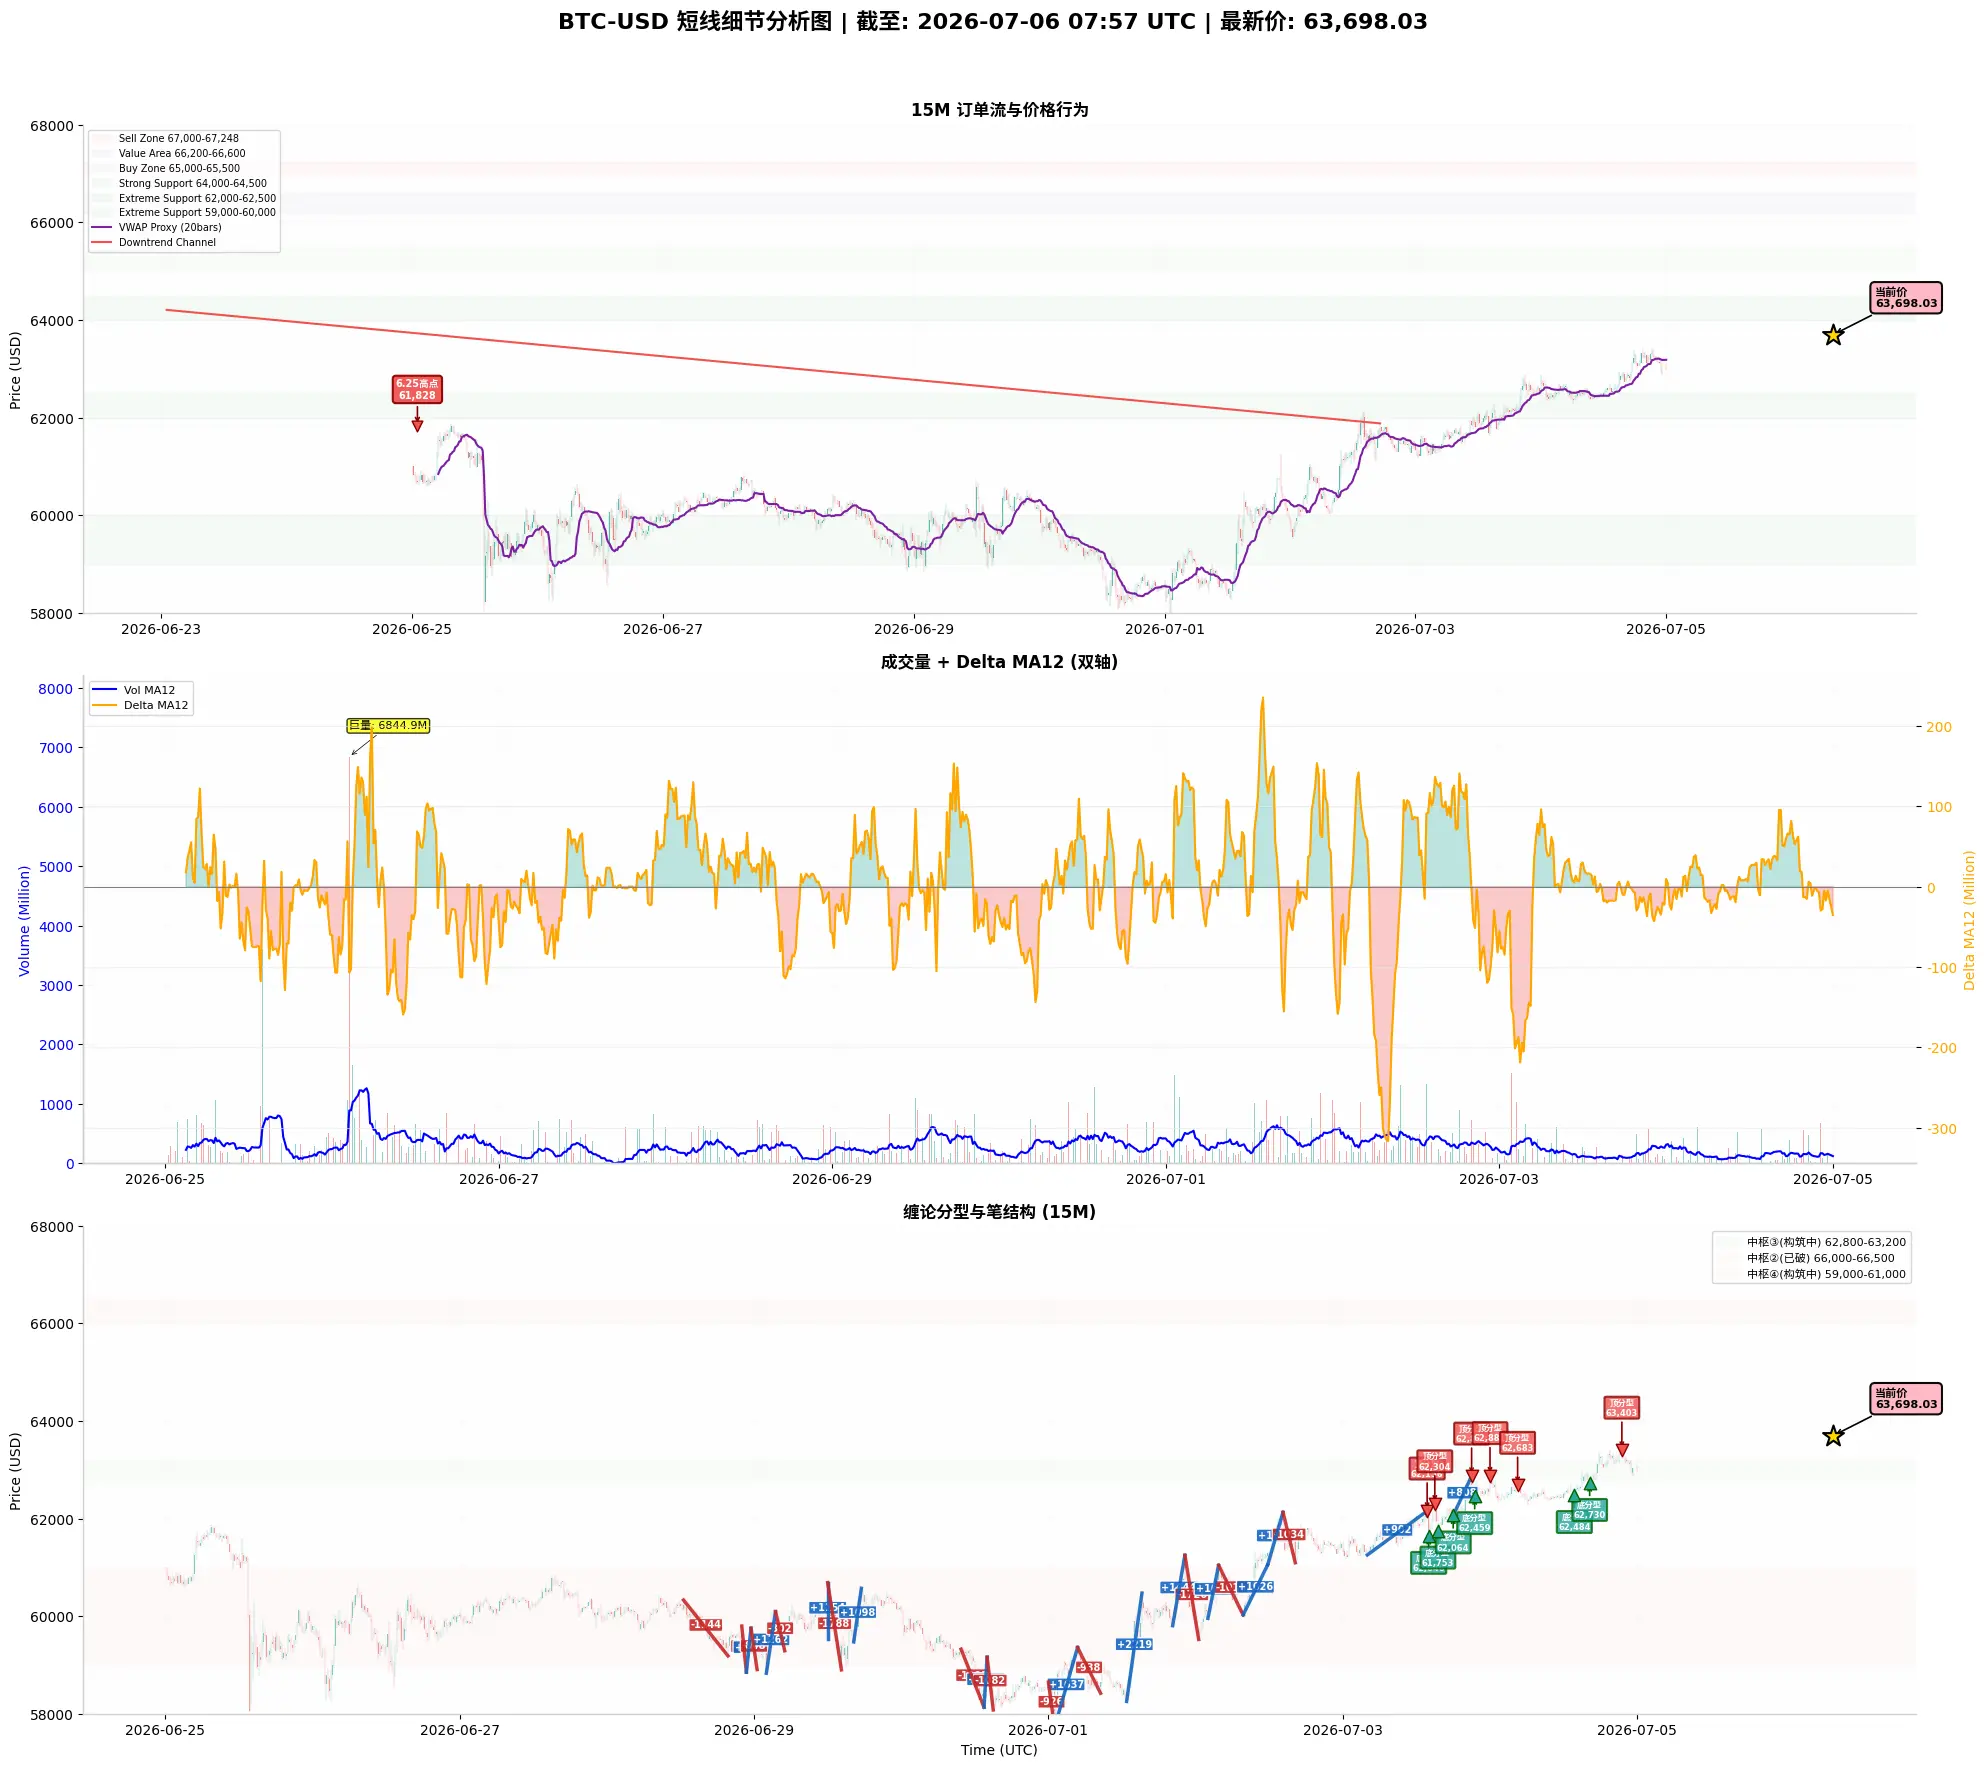
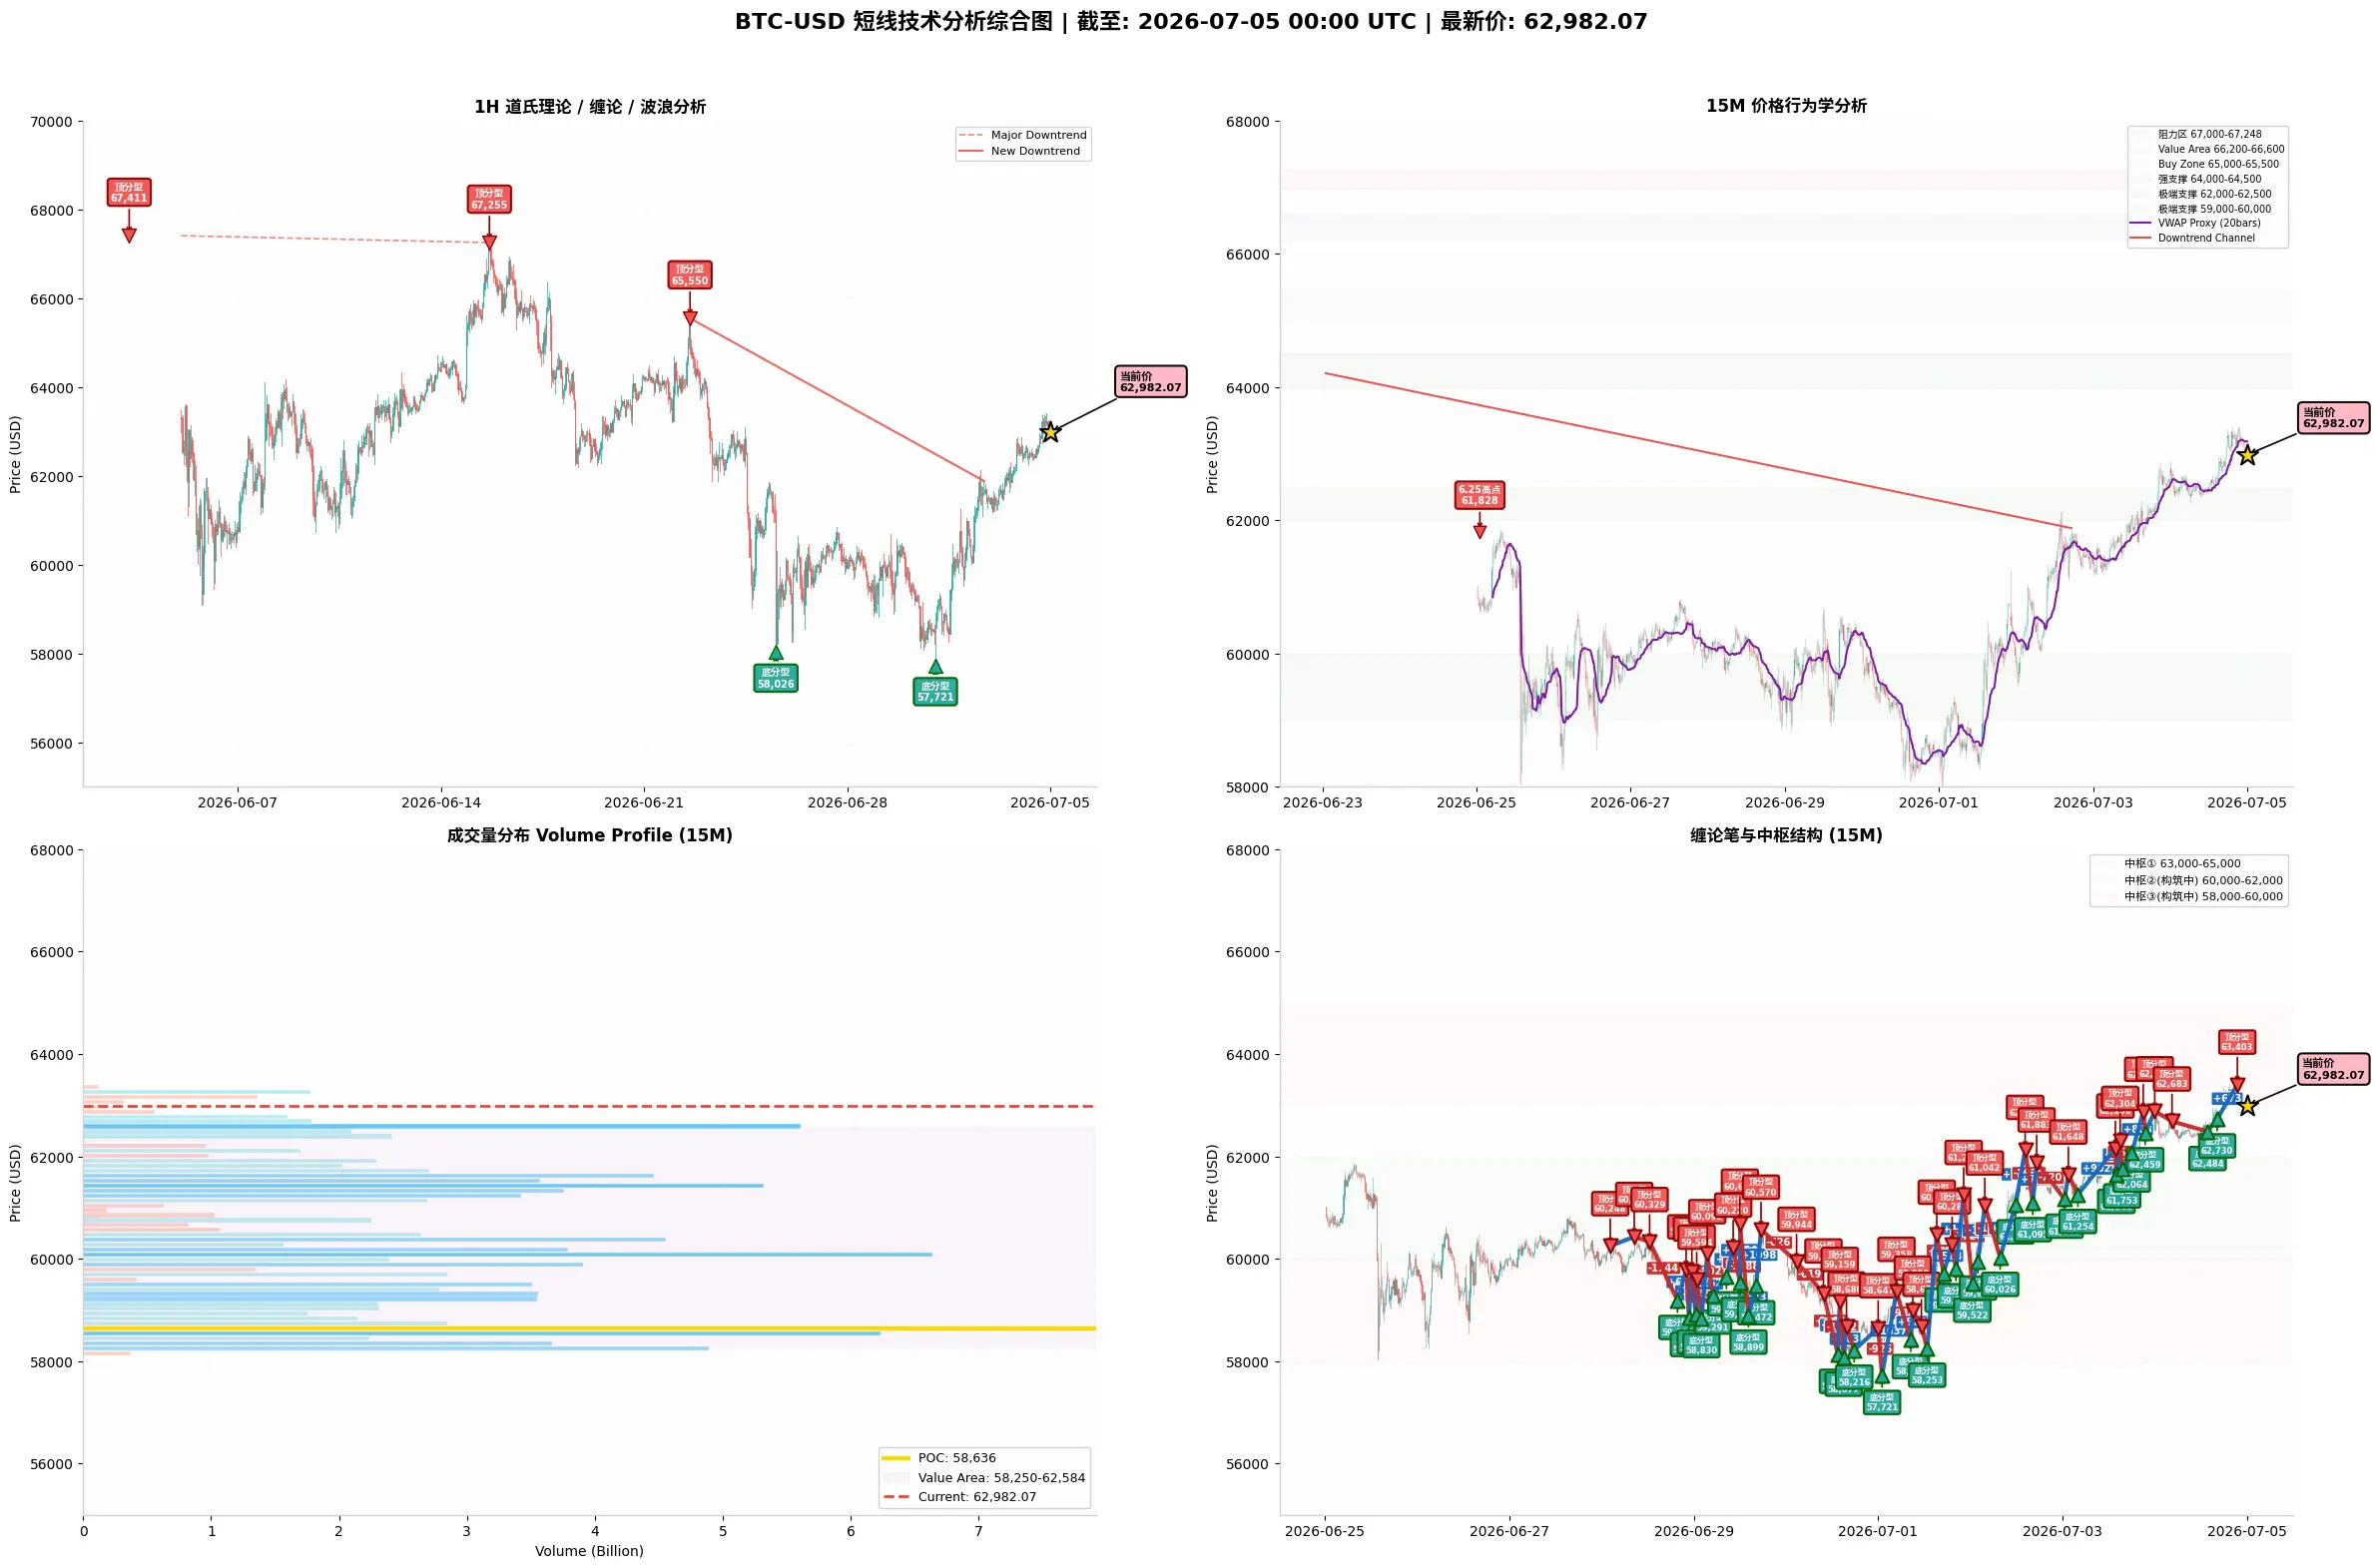
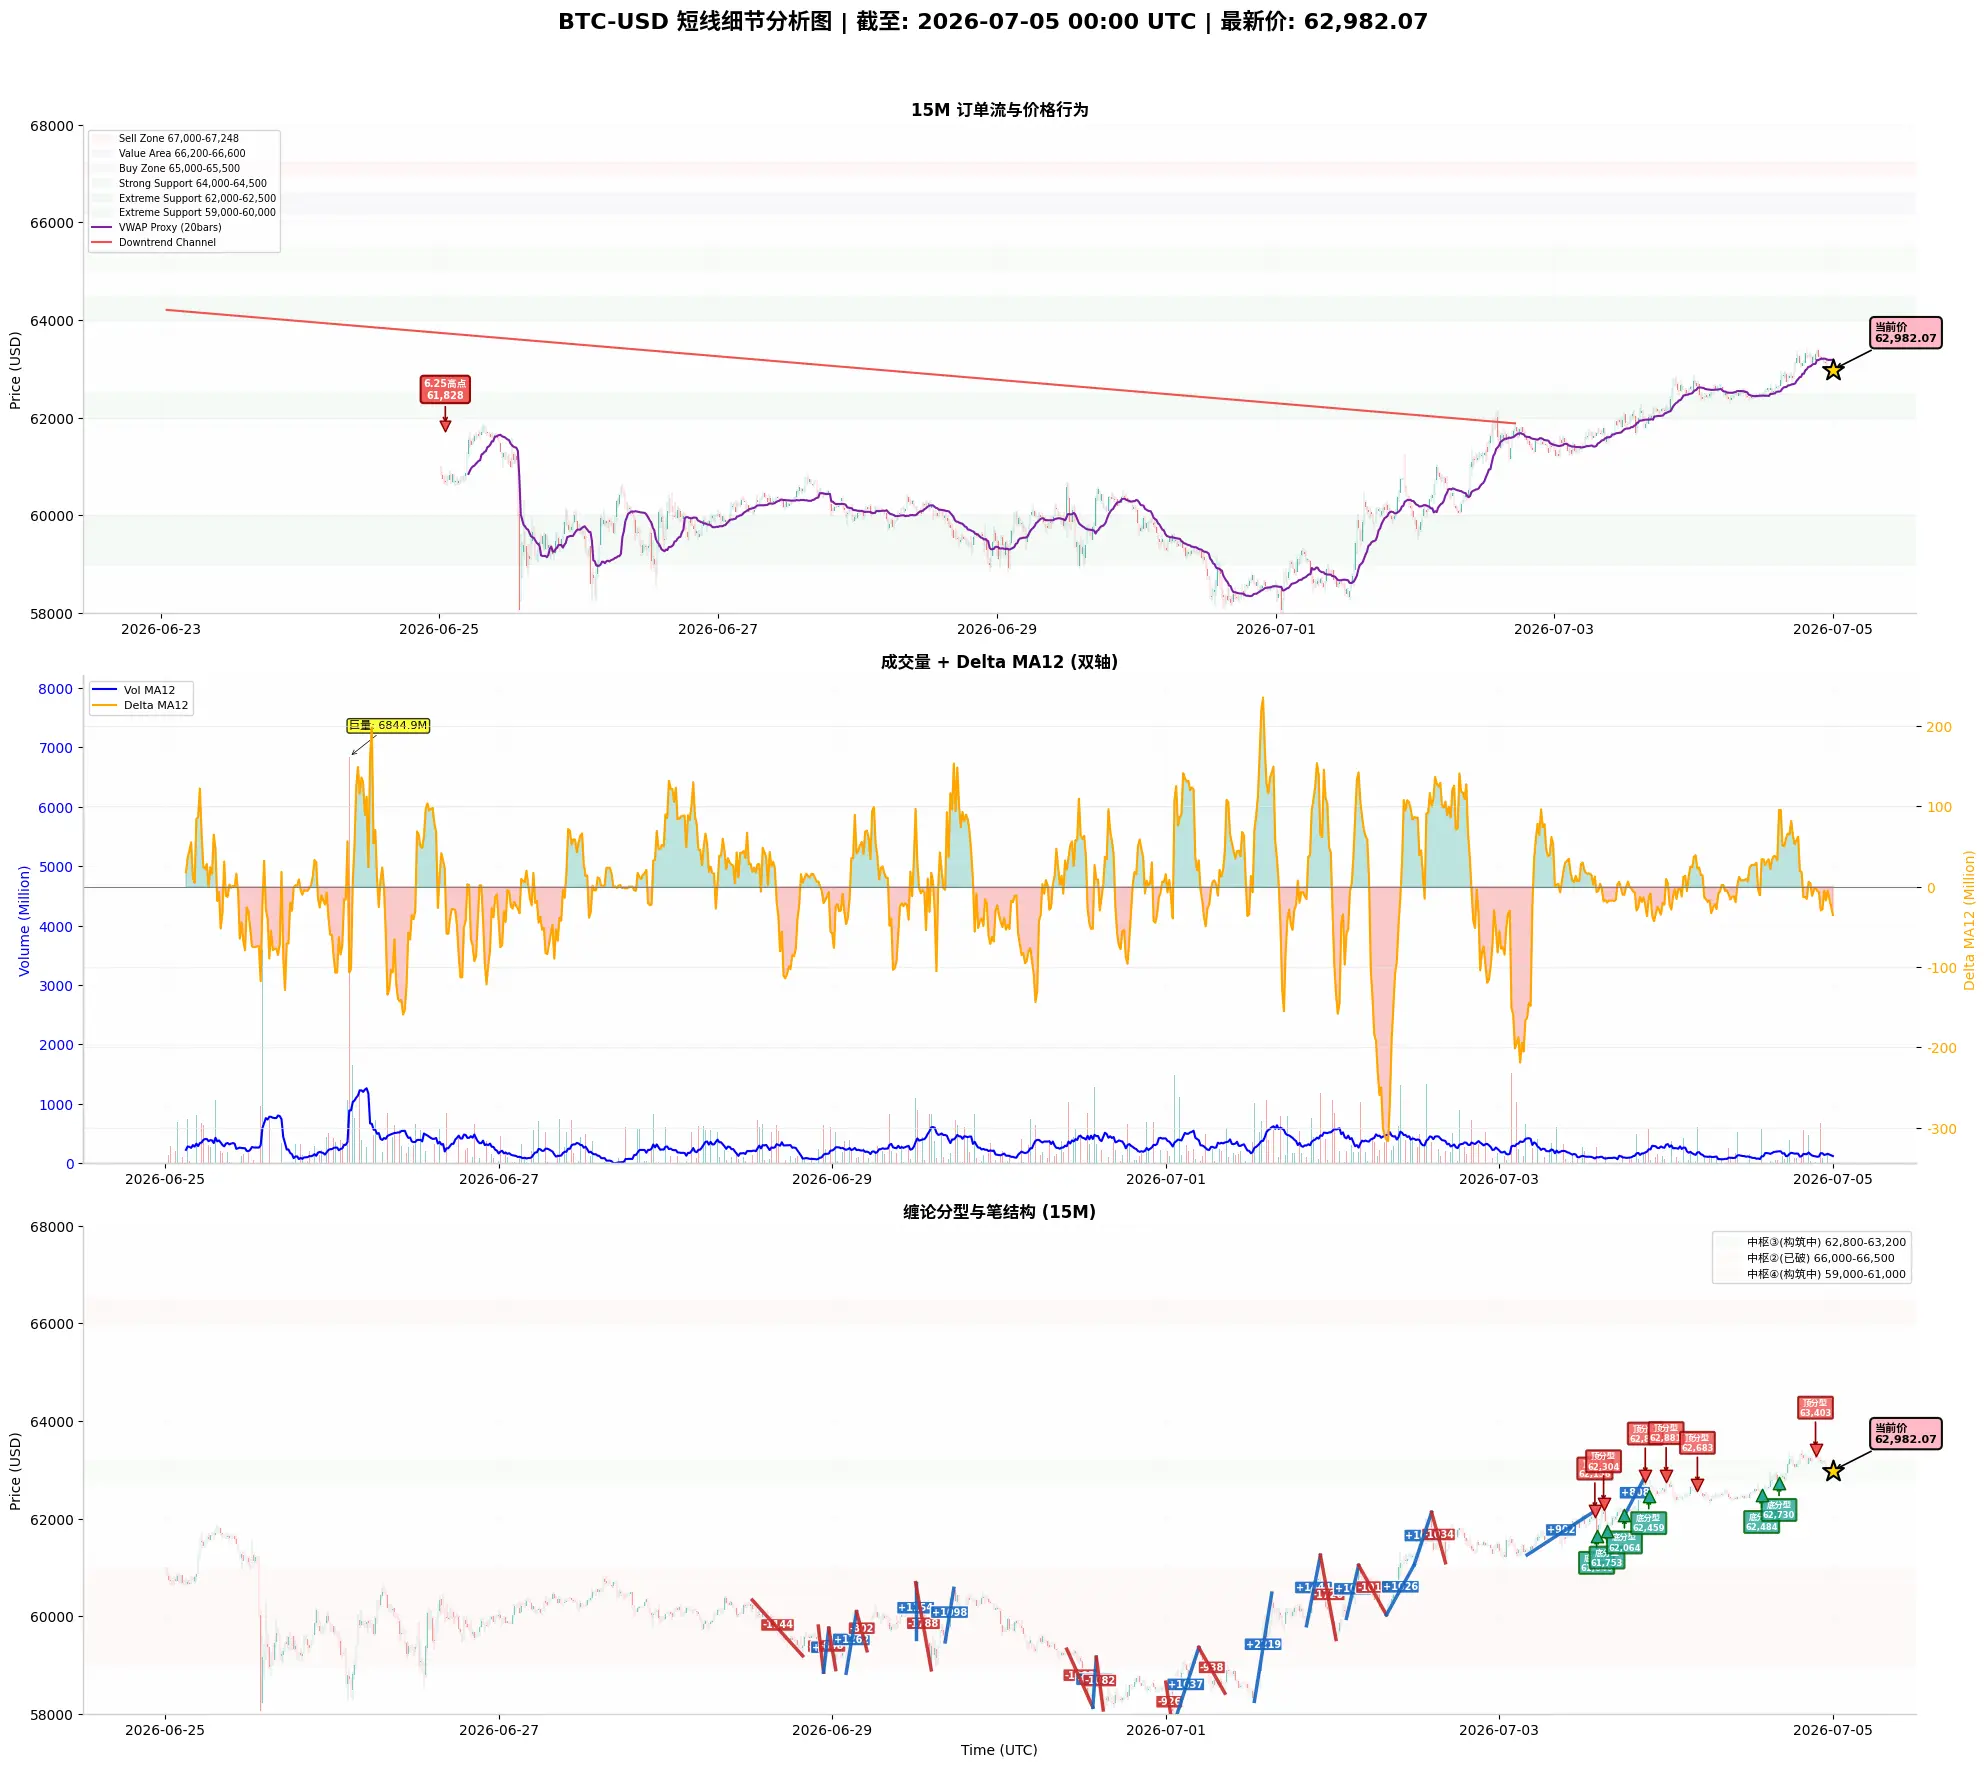
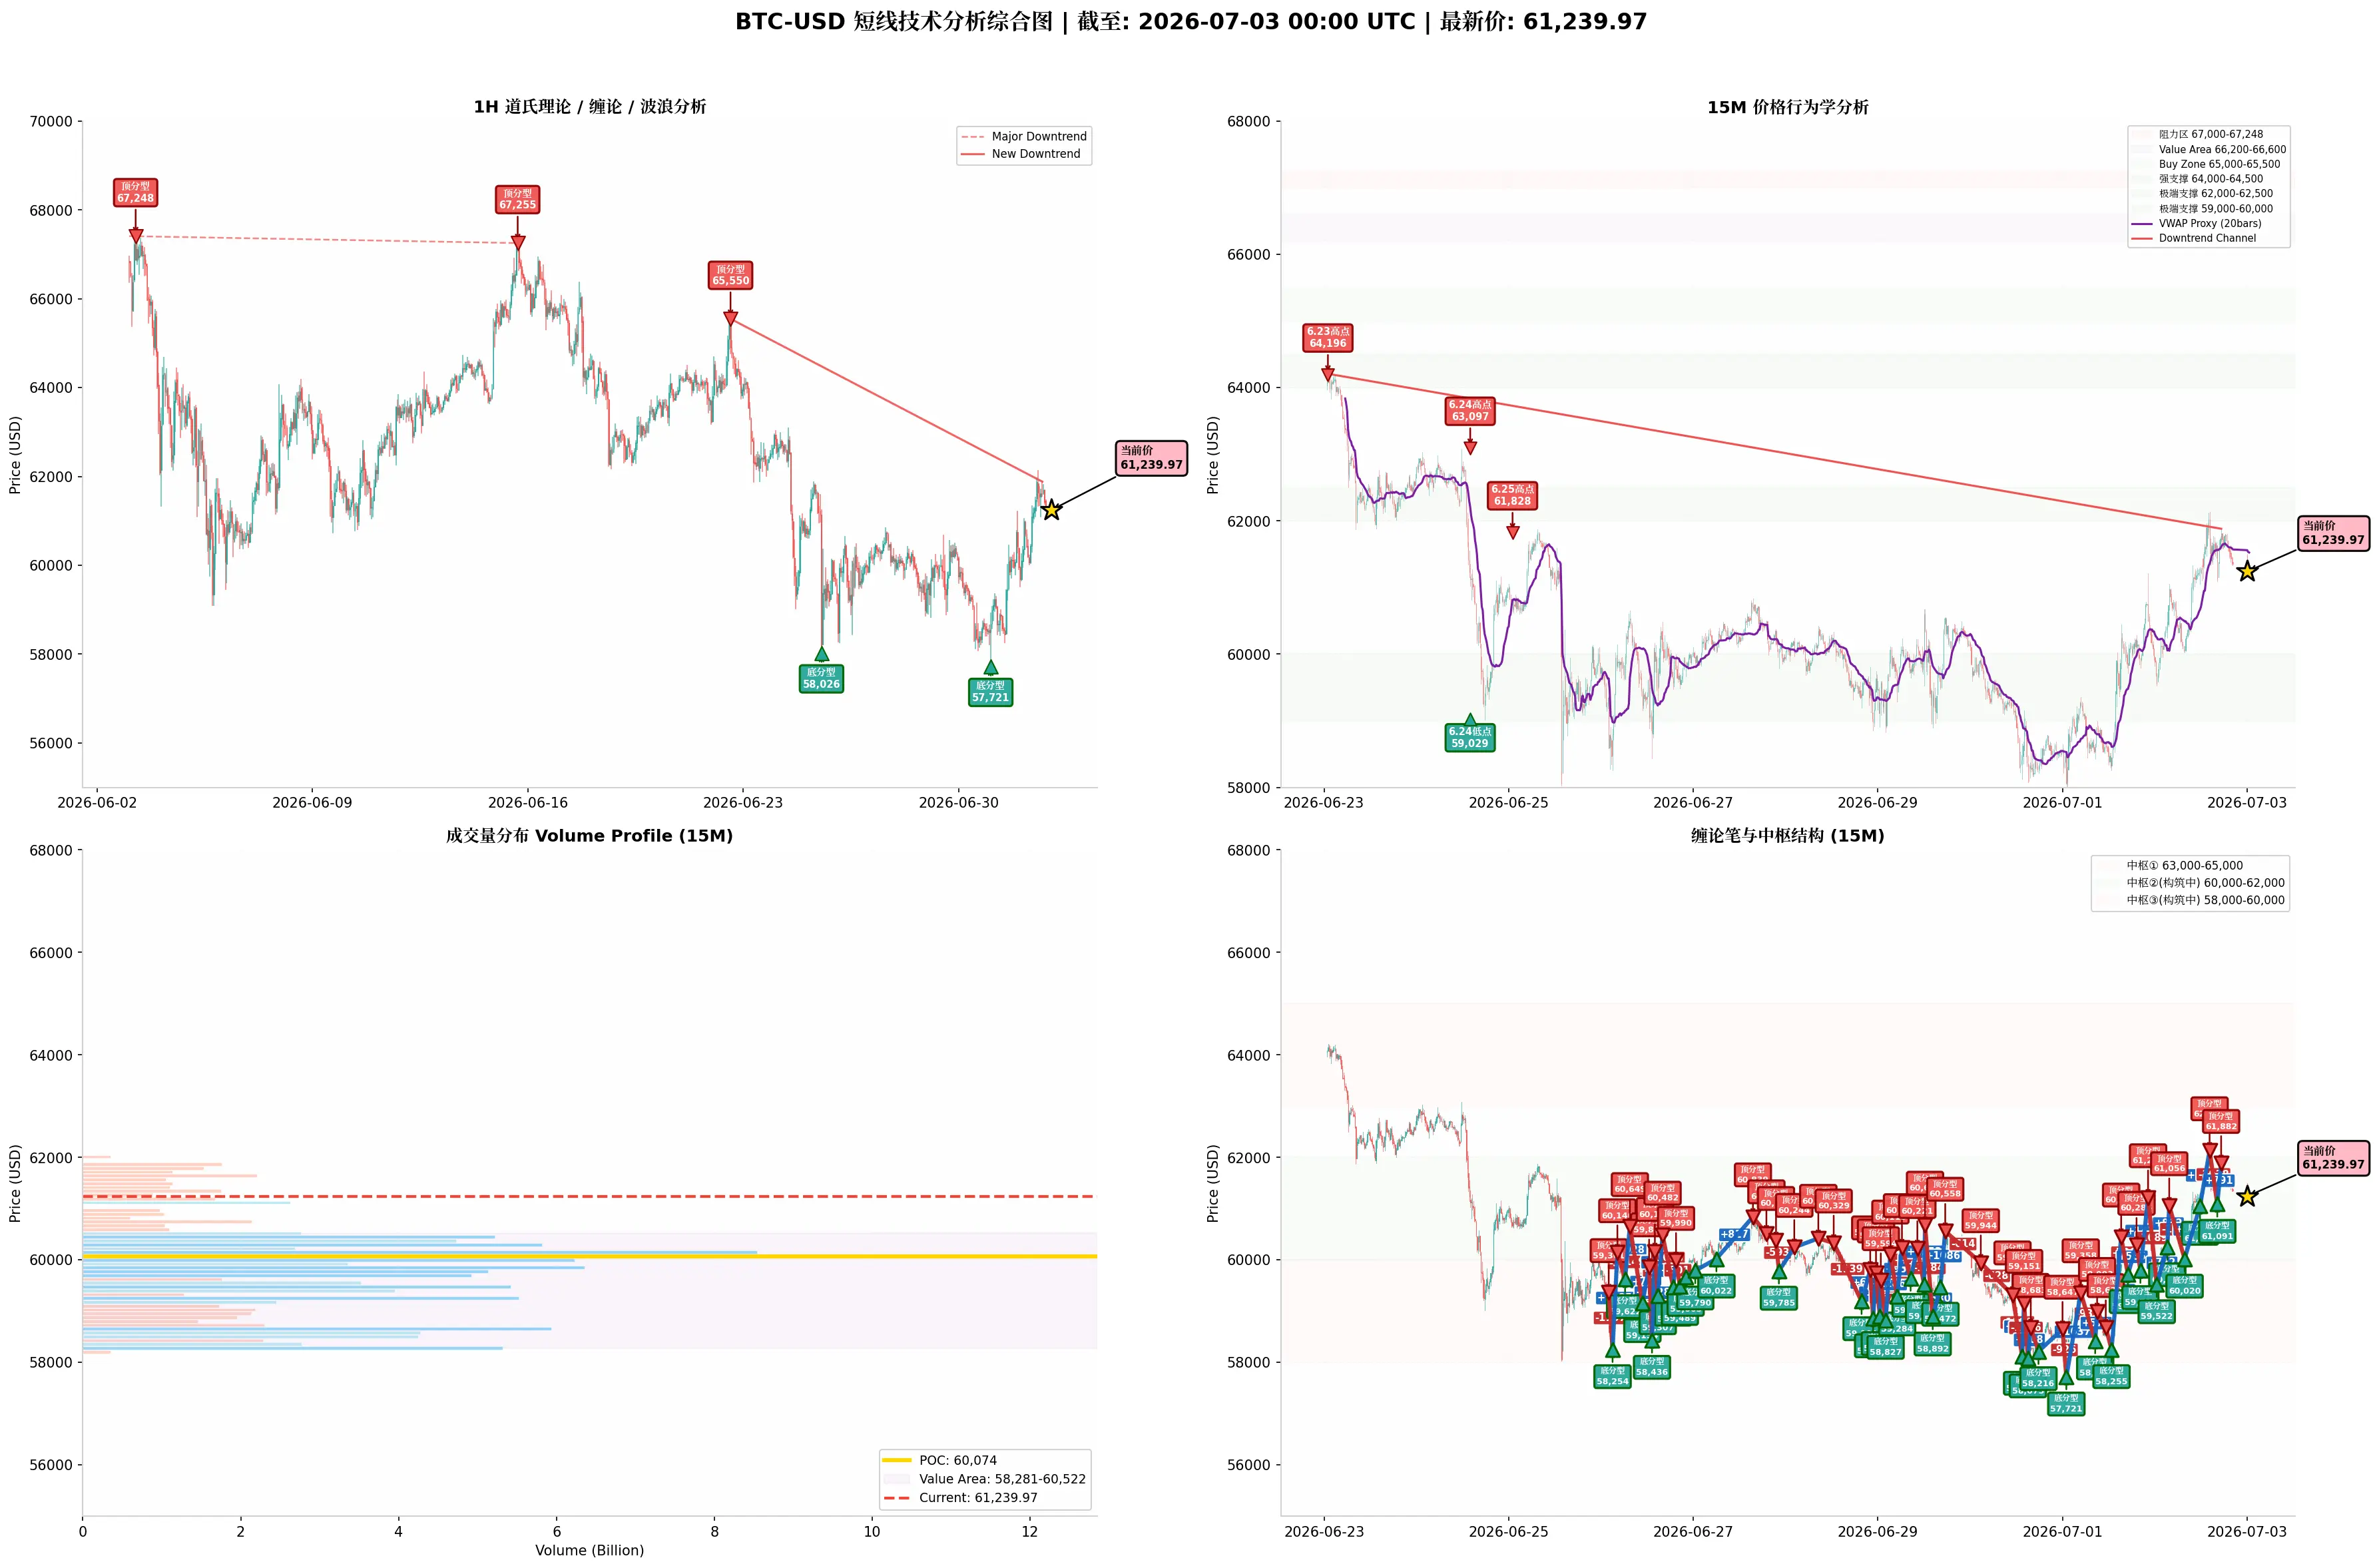
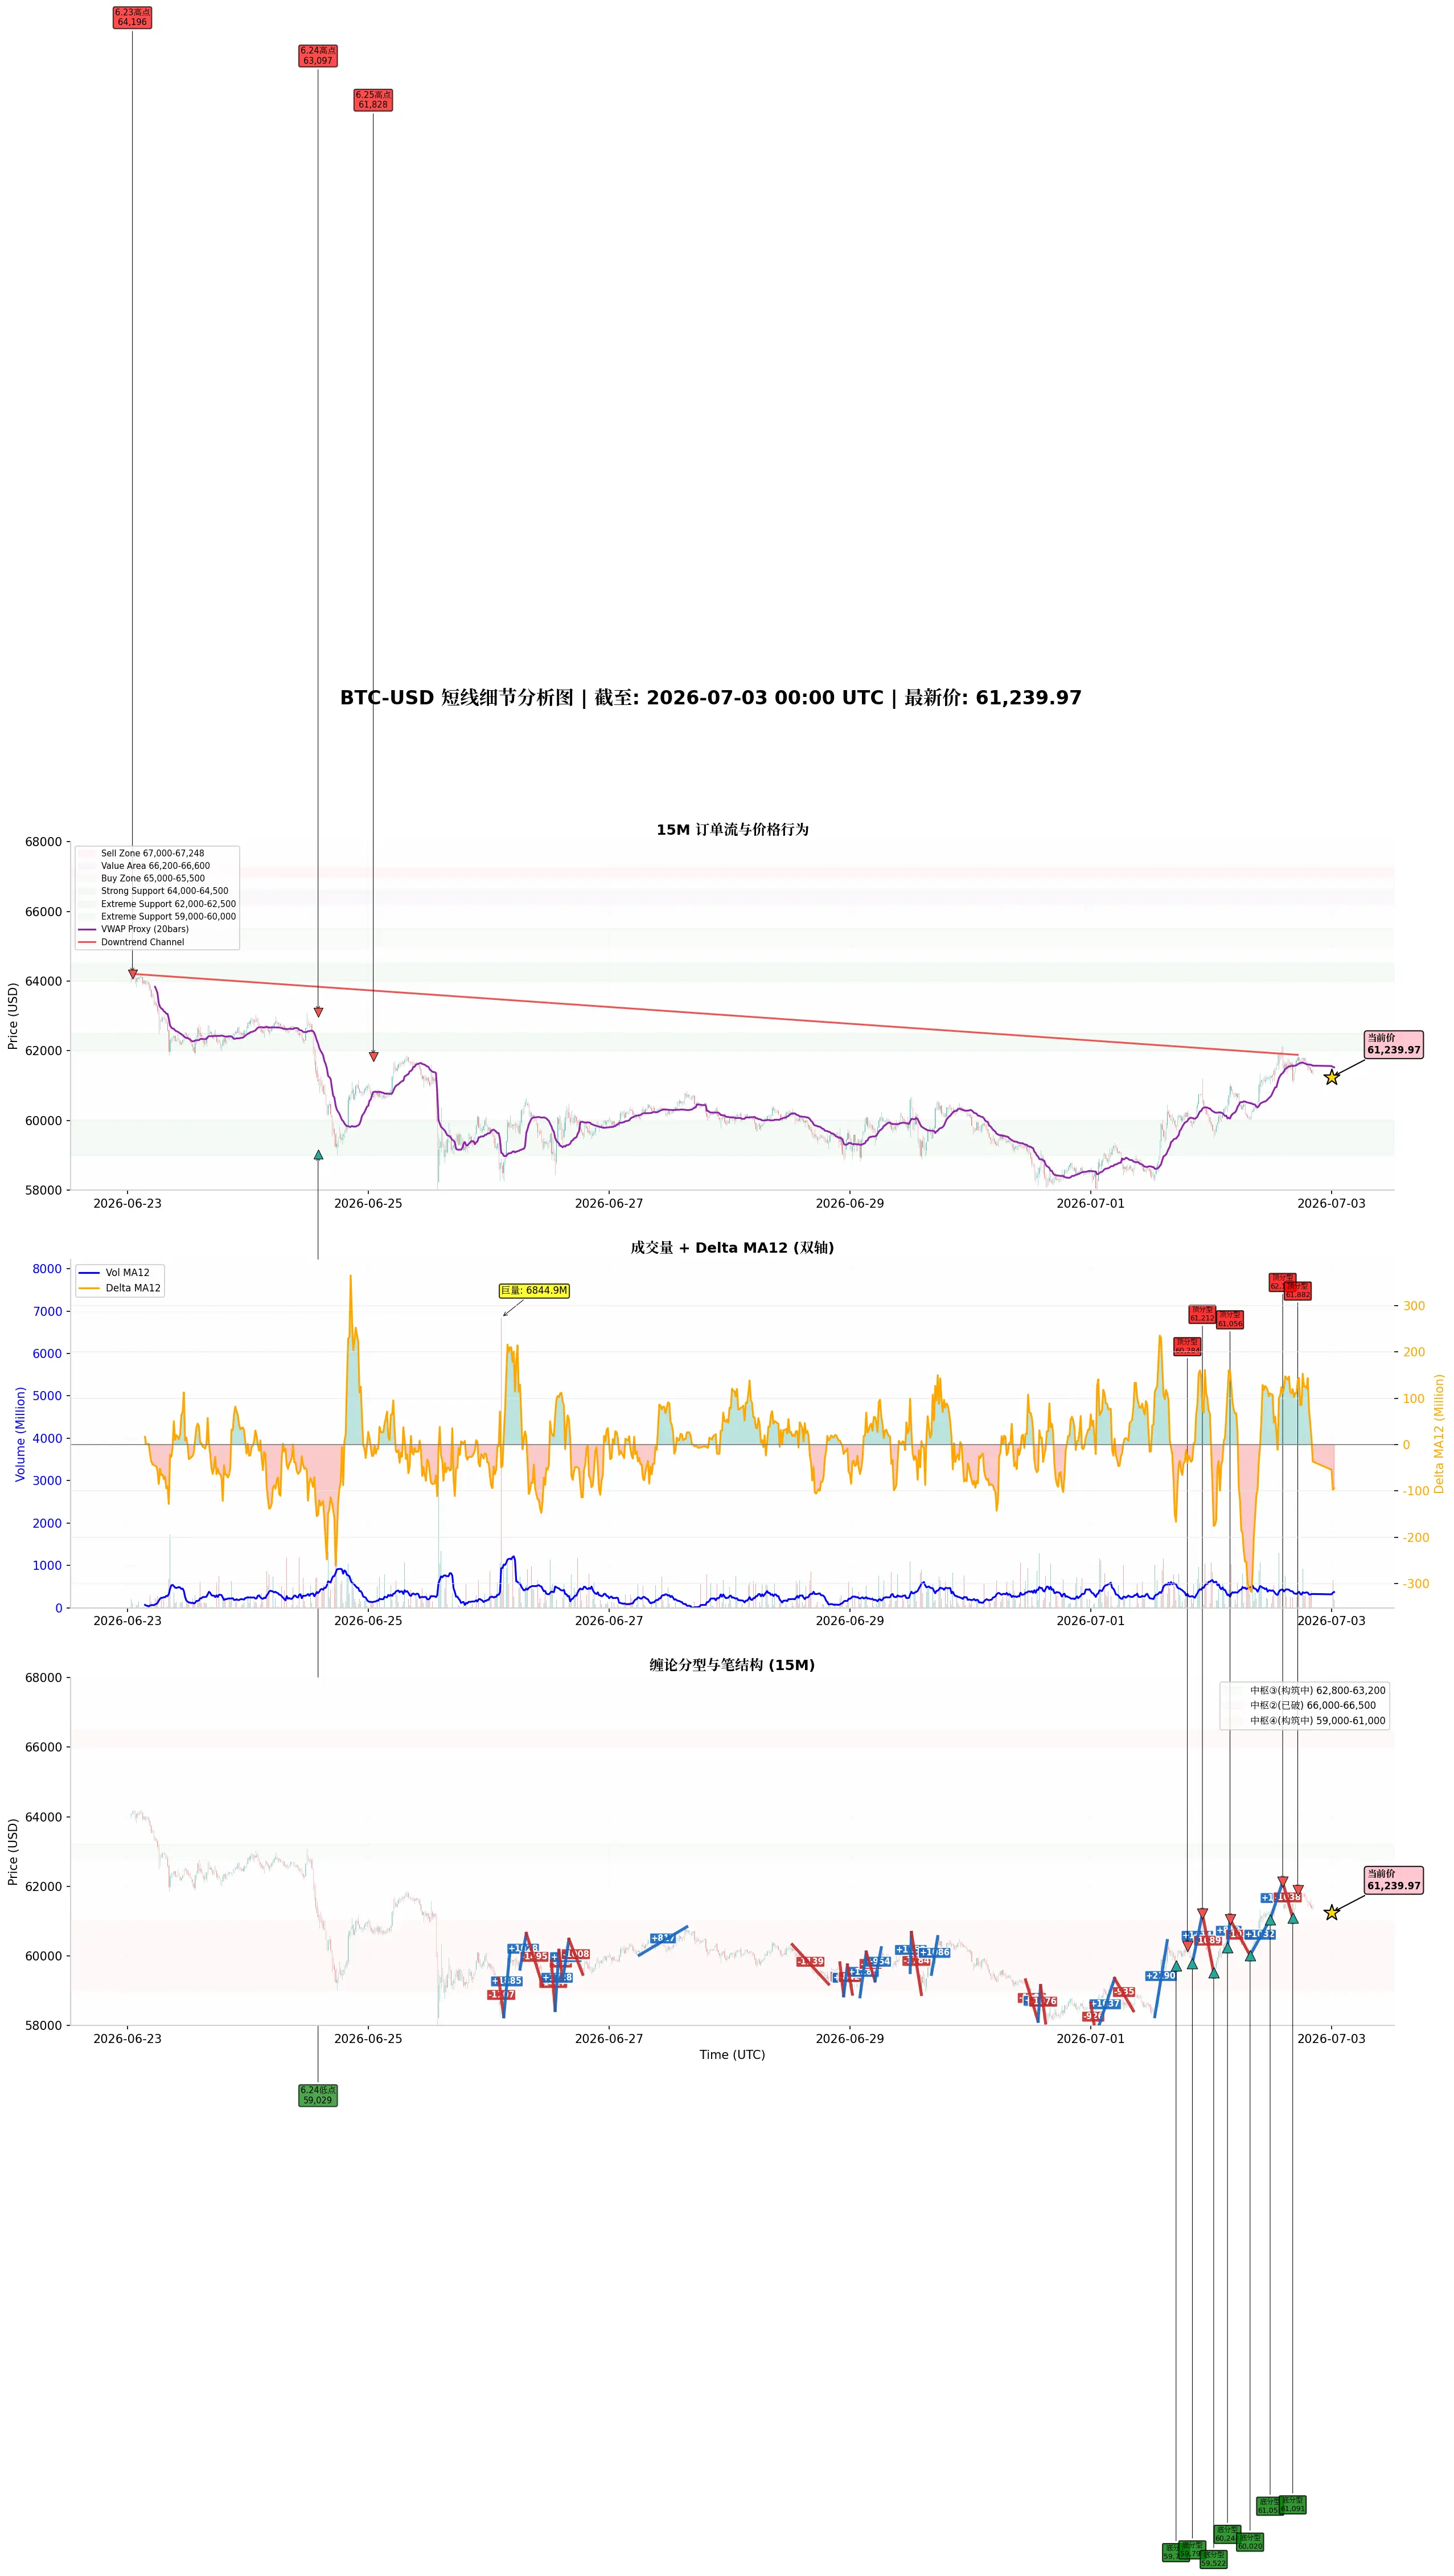
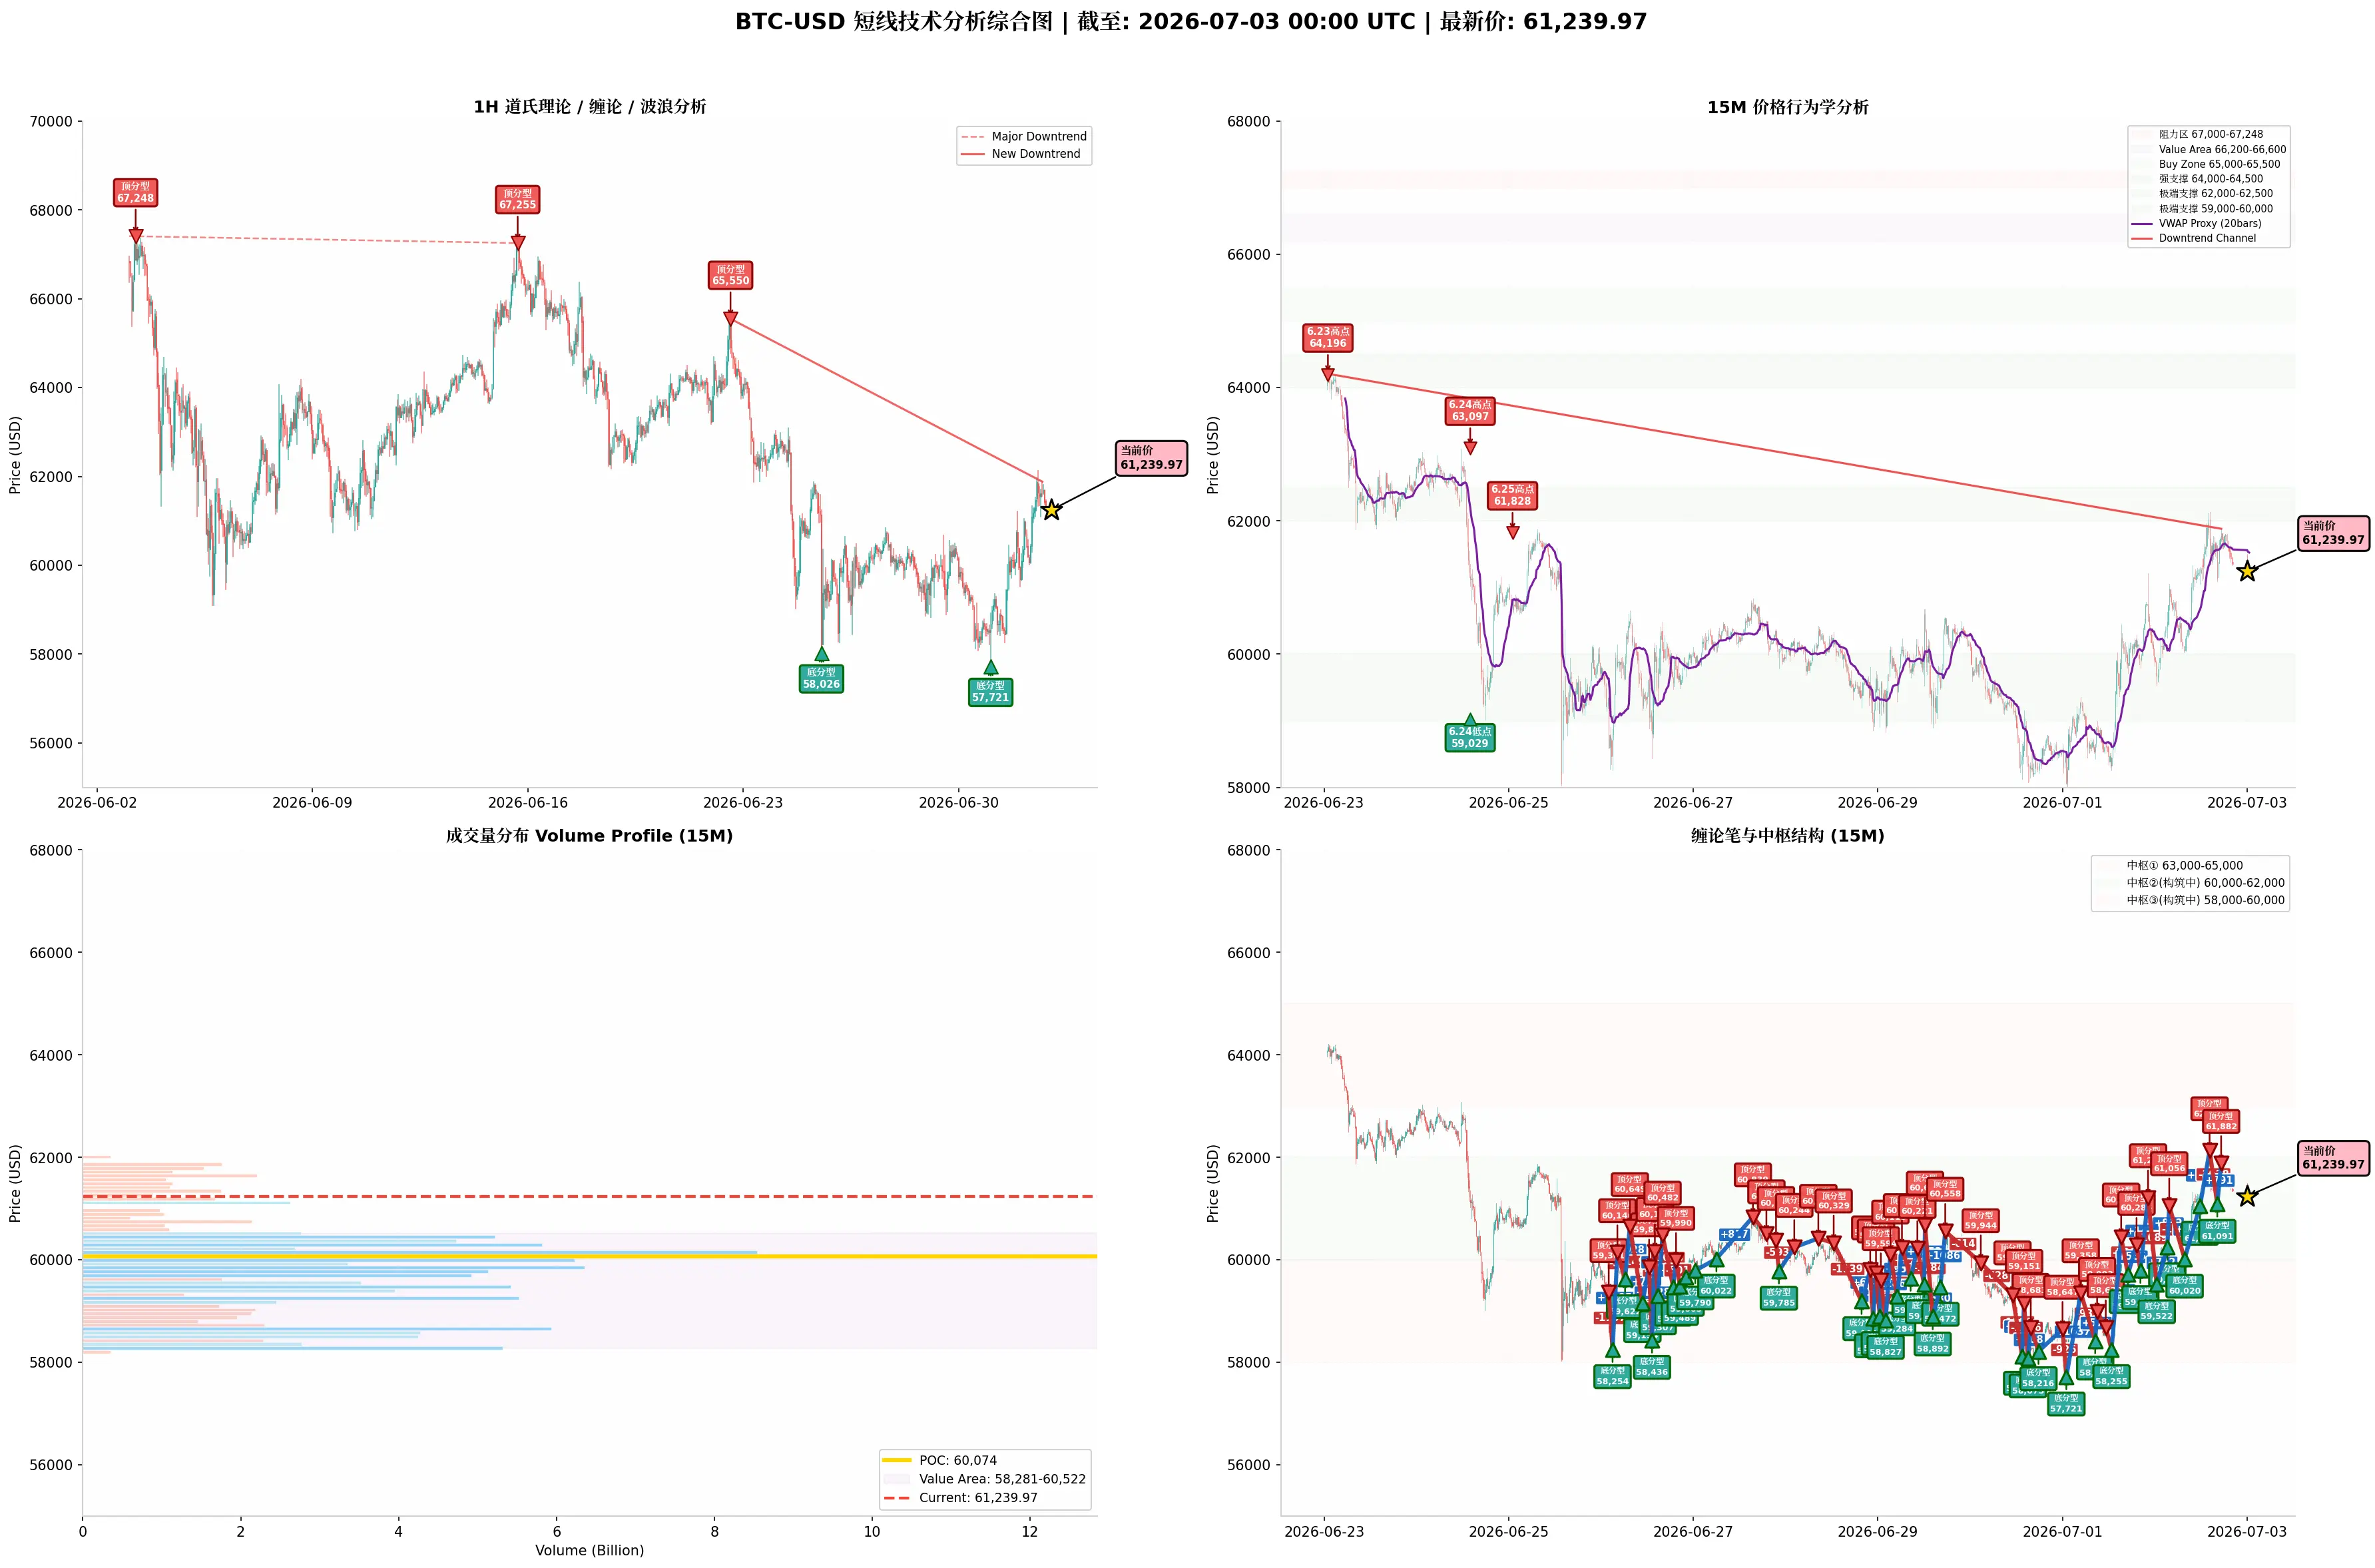
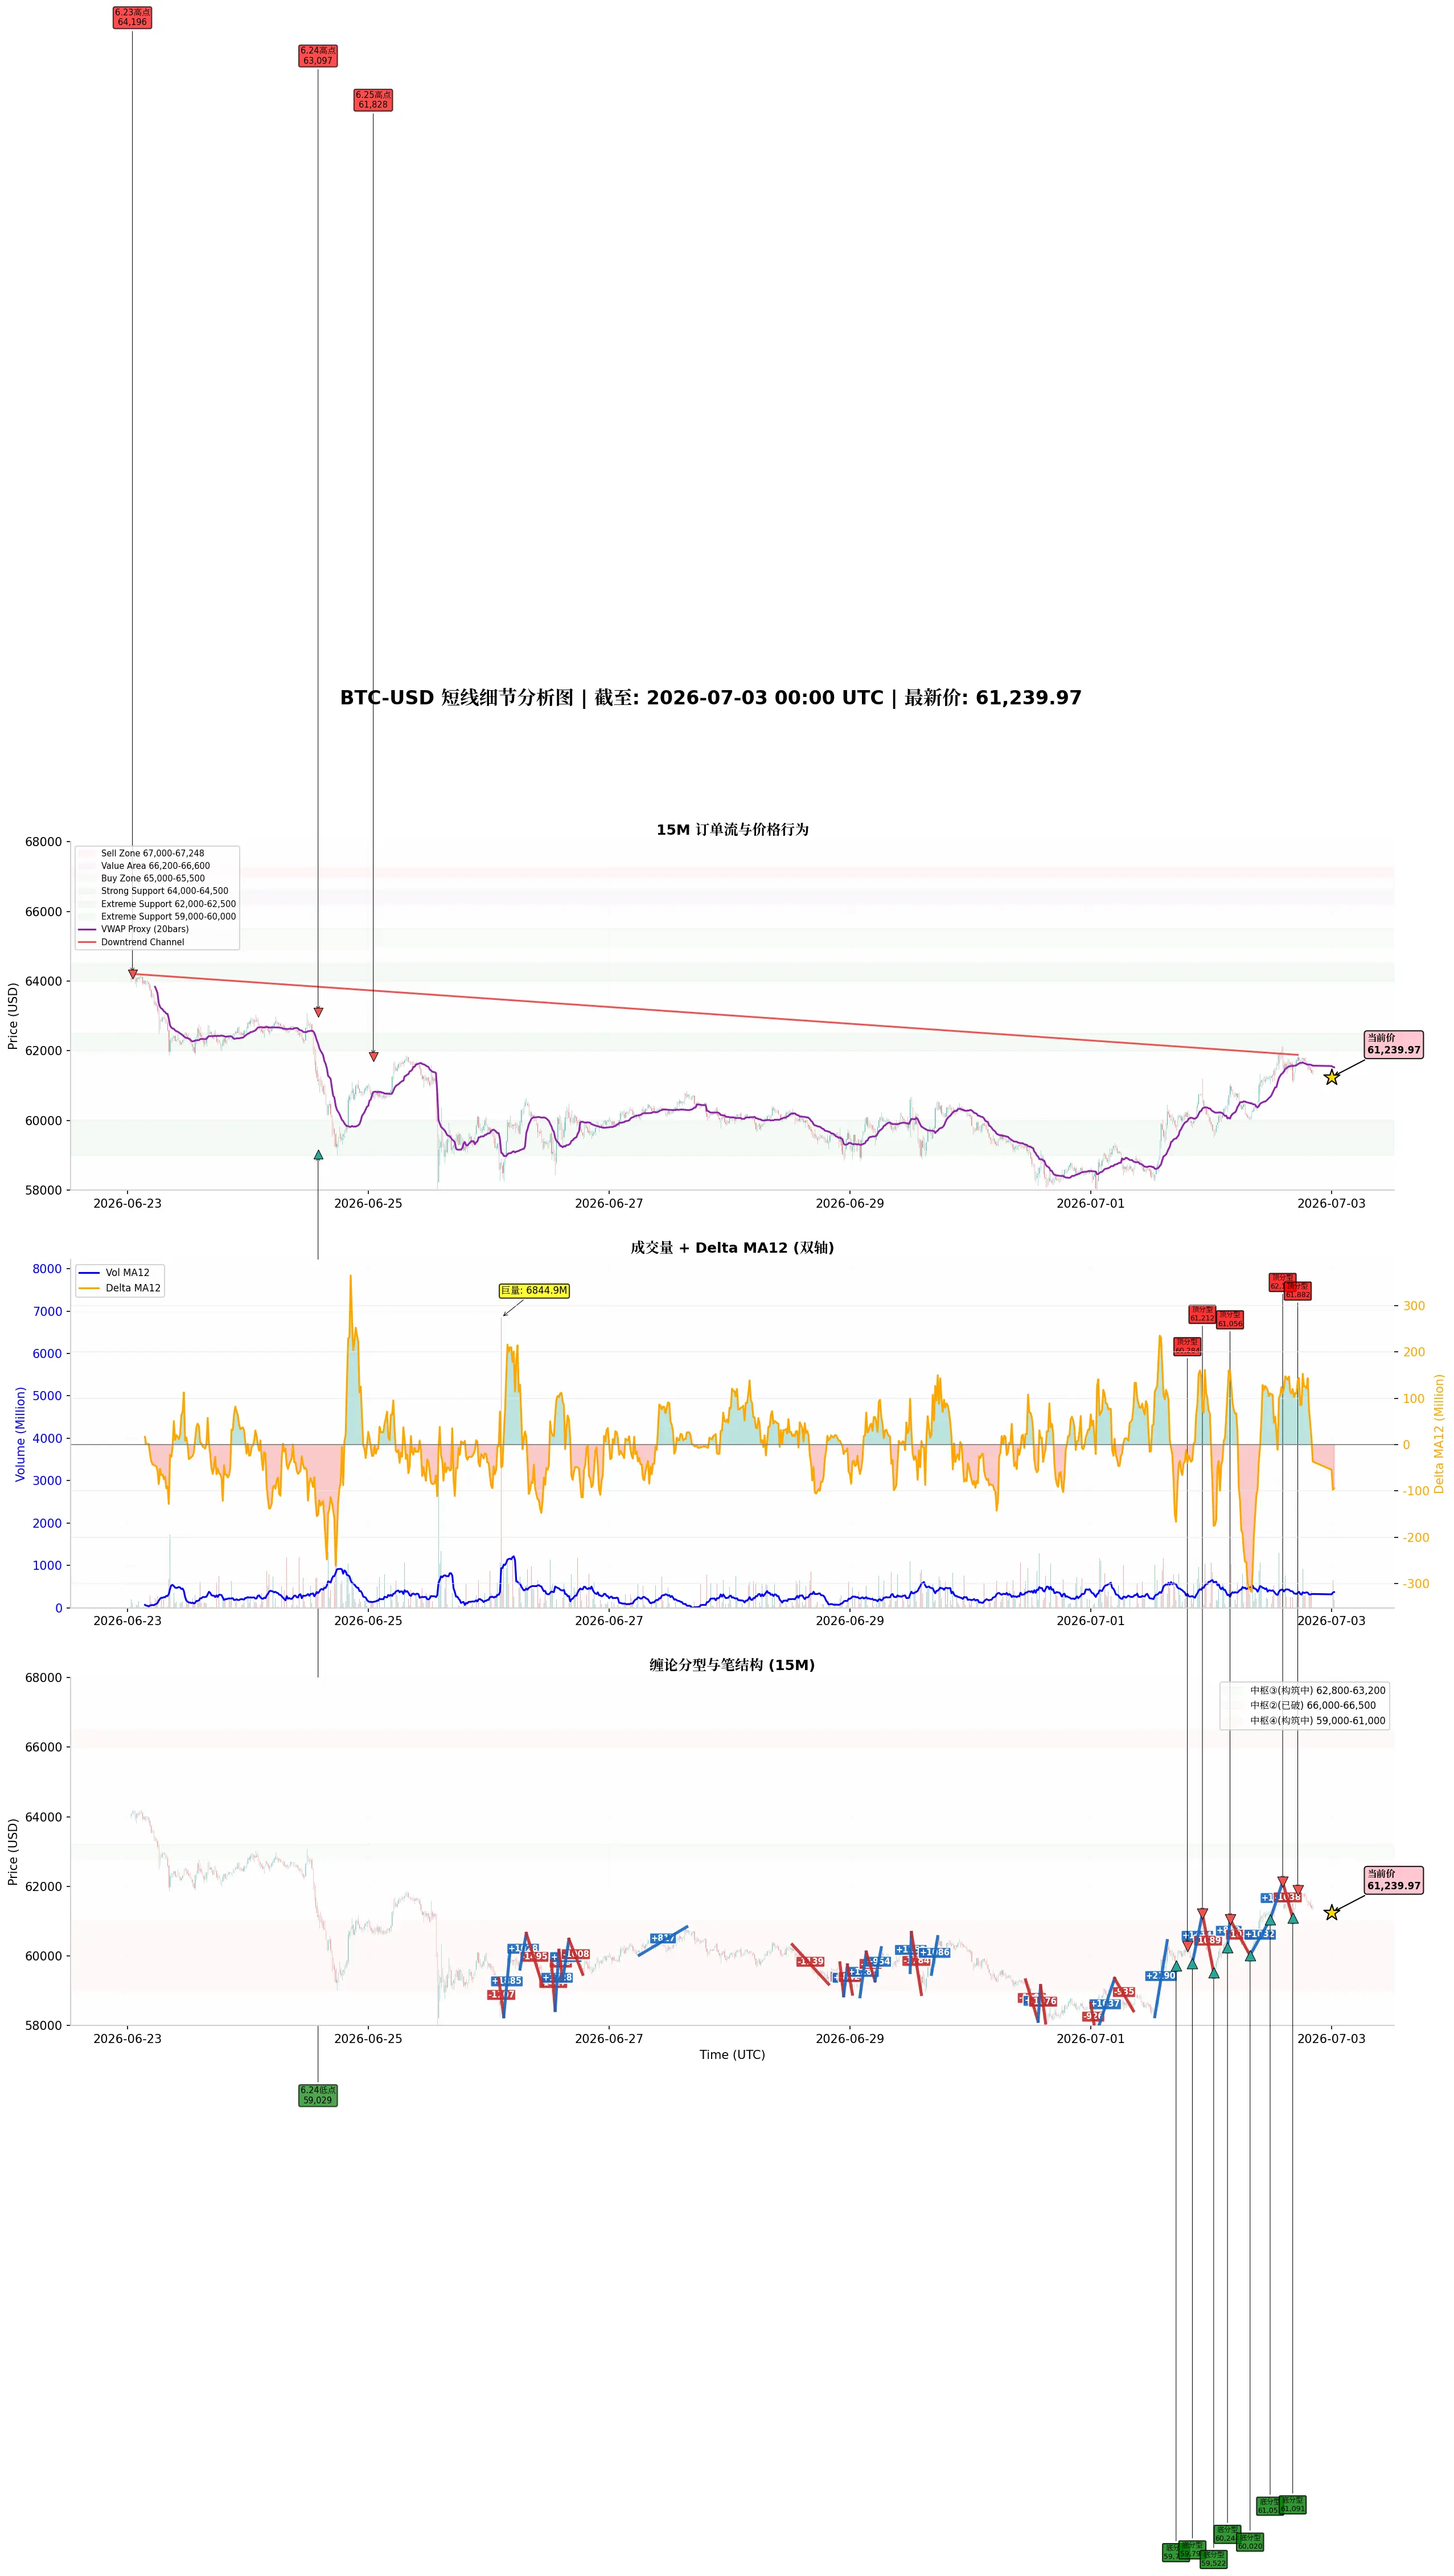
From Dow Theory, Chan Theory, Elliott Wave Theory, Volume-Price Analysis, Order Flow, and Price Action, a brief analysis of BTC’s short-term trend
$BTC ‌I. Dow Theory
Primary Trend (1-hour level): The primary downtrend from the historical high of 82,814 on May 6 saw a significant turning point on July 1. Prices plummeted from 82,814 through the secondary high of 73,974 on June 1 to a low of 57,721 on July 1, with a cumulative decline of 25,093. After hitting bottom on July 1, bulls launched a strong counterattack, rebounding to 64,597 on July 6, forming a pattern of "significantly higher lows
BTC-1.56%
View Original
post-image
post-image
  • Reward
  • Comment
  • Repost
  • Share
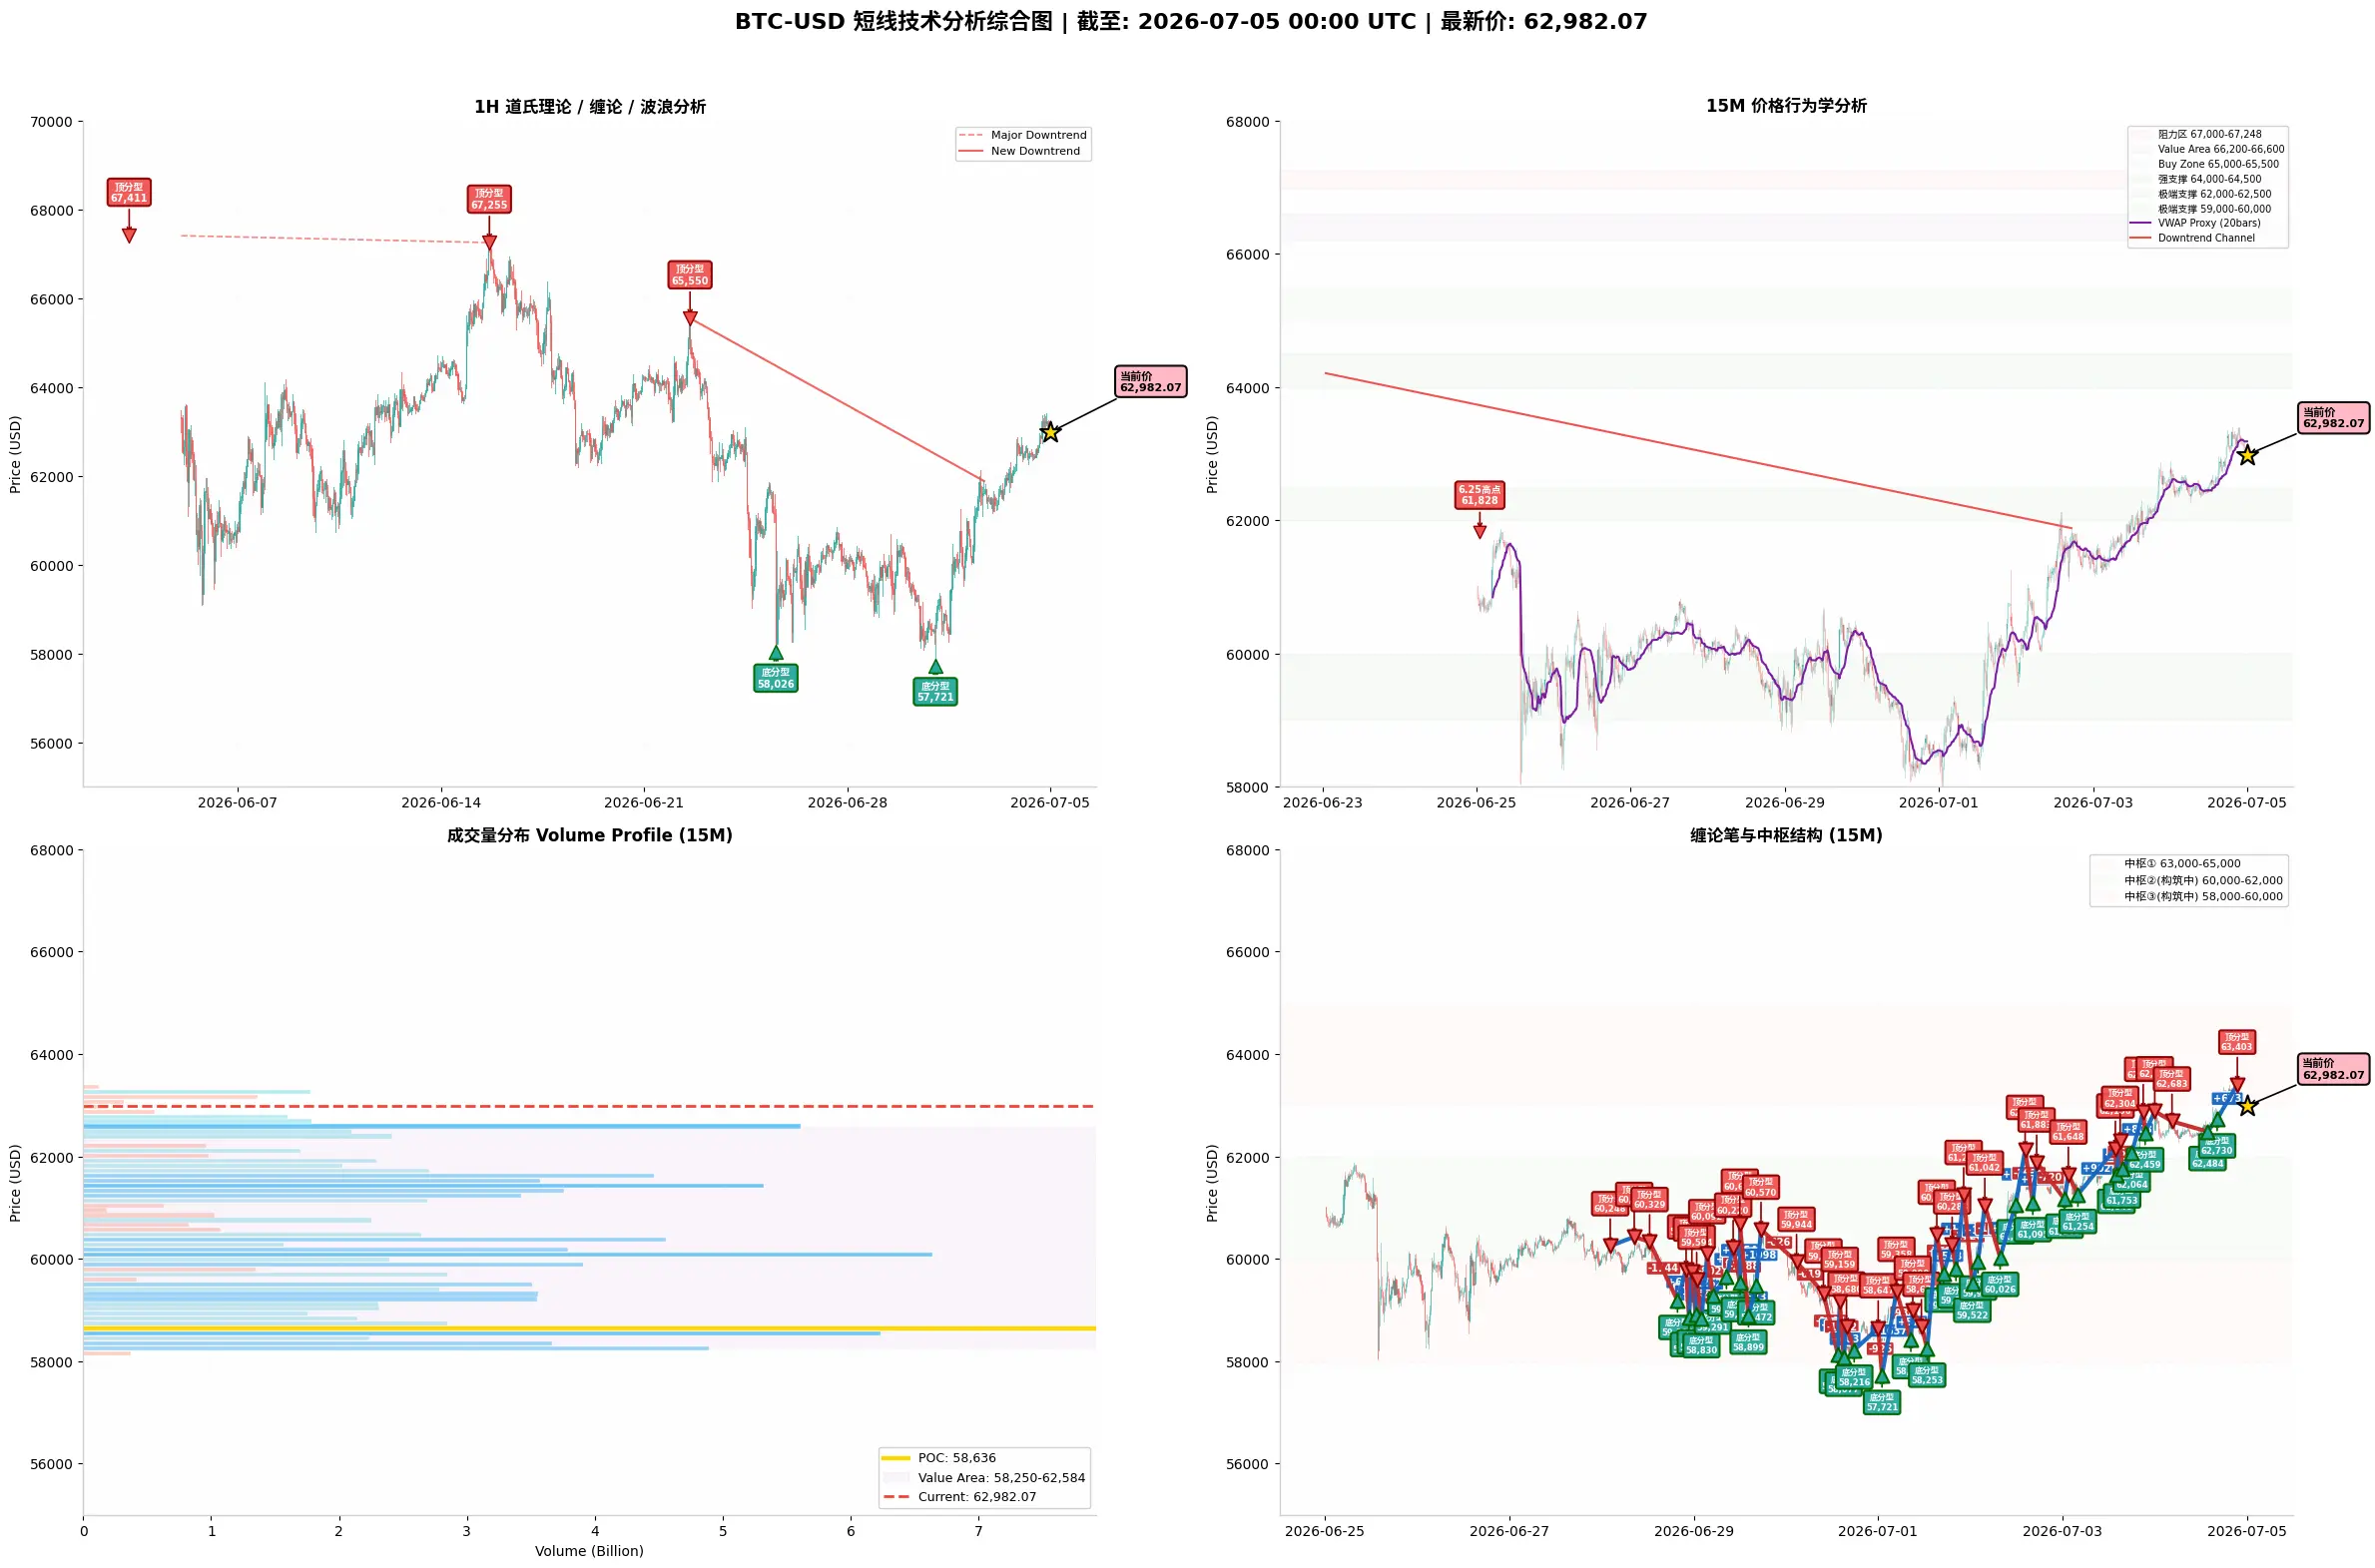
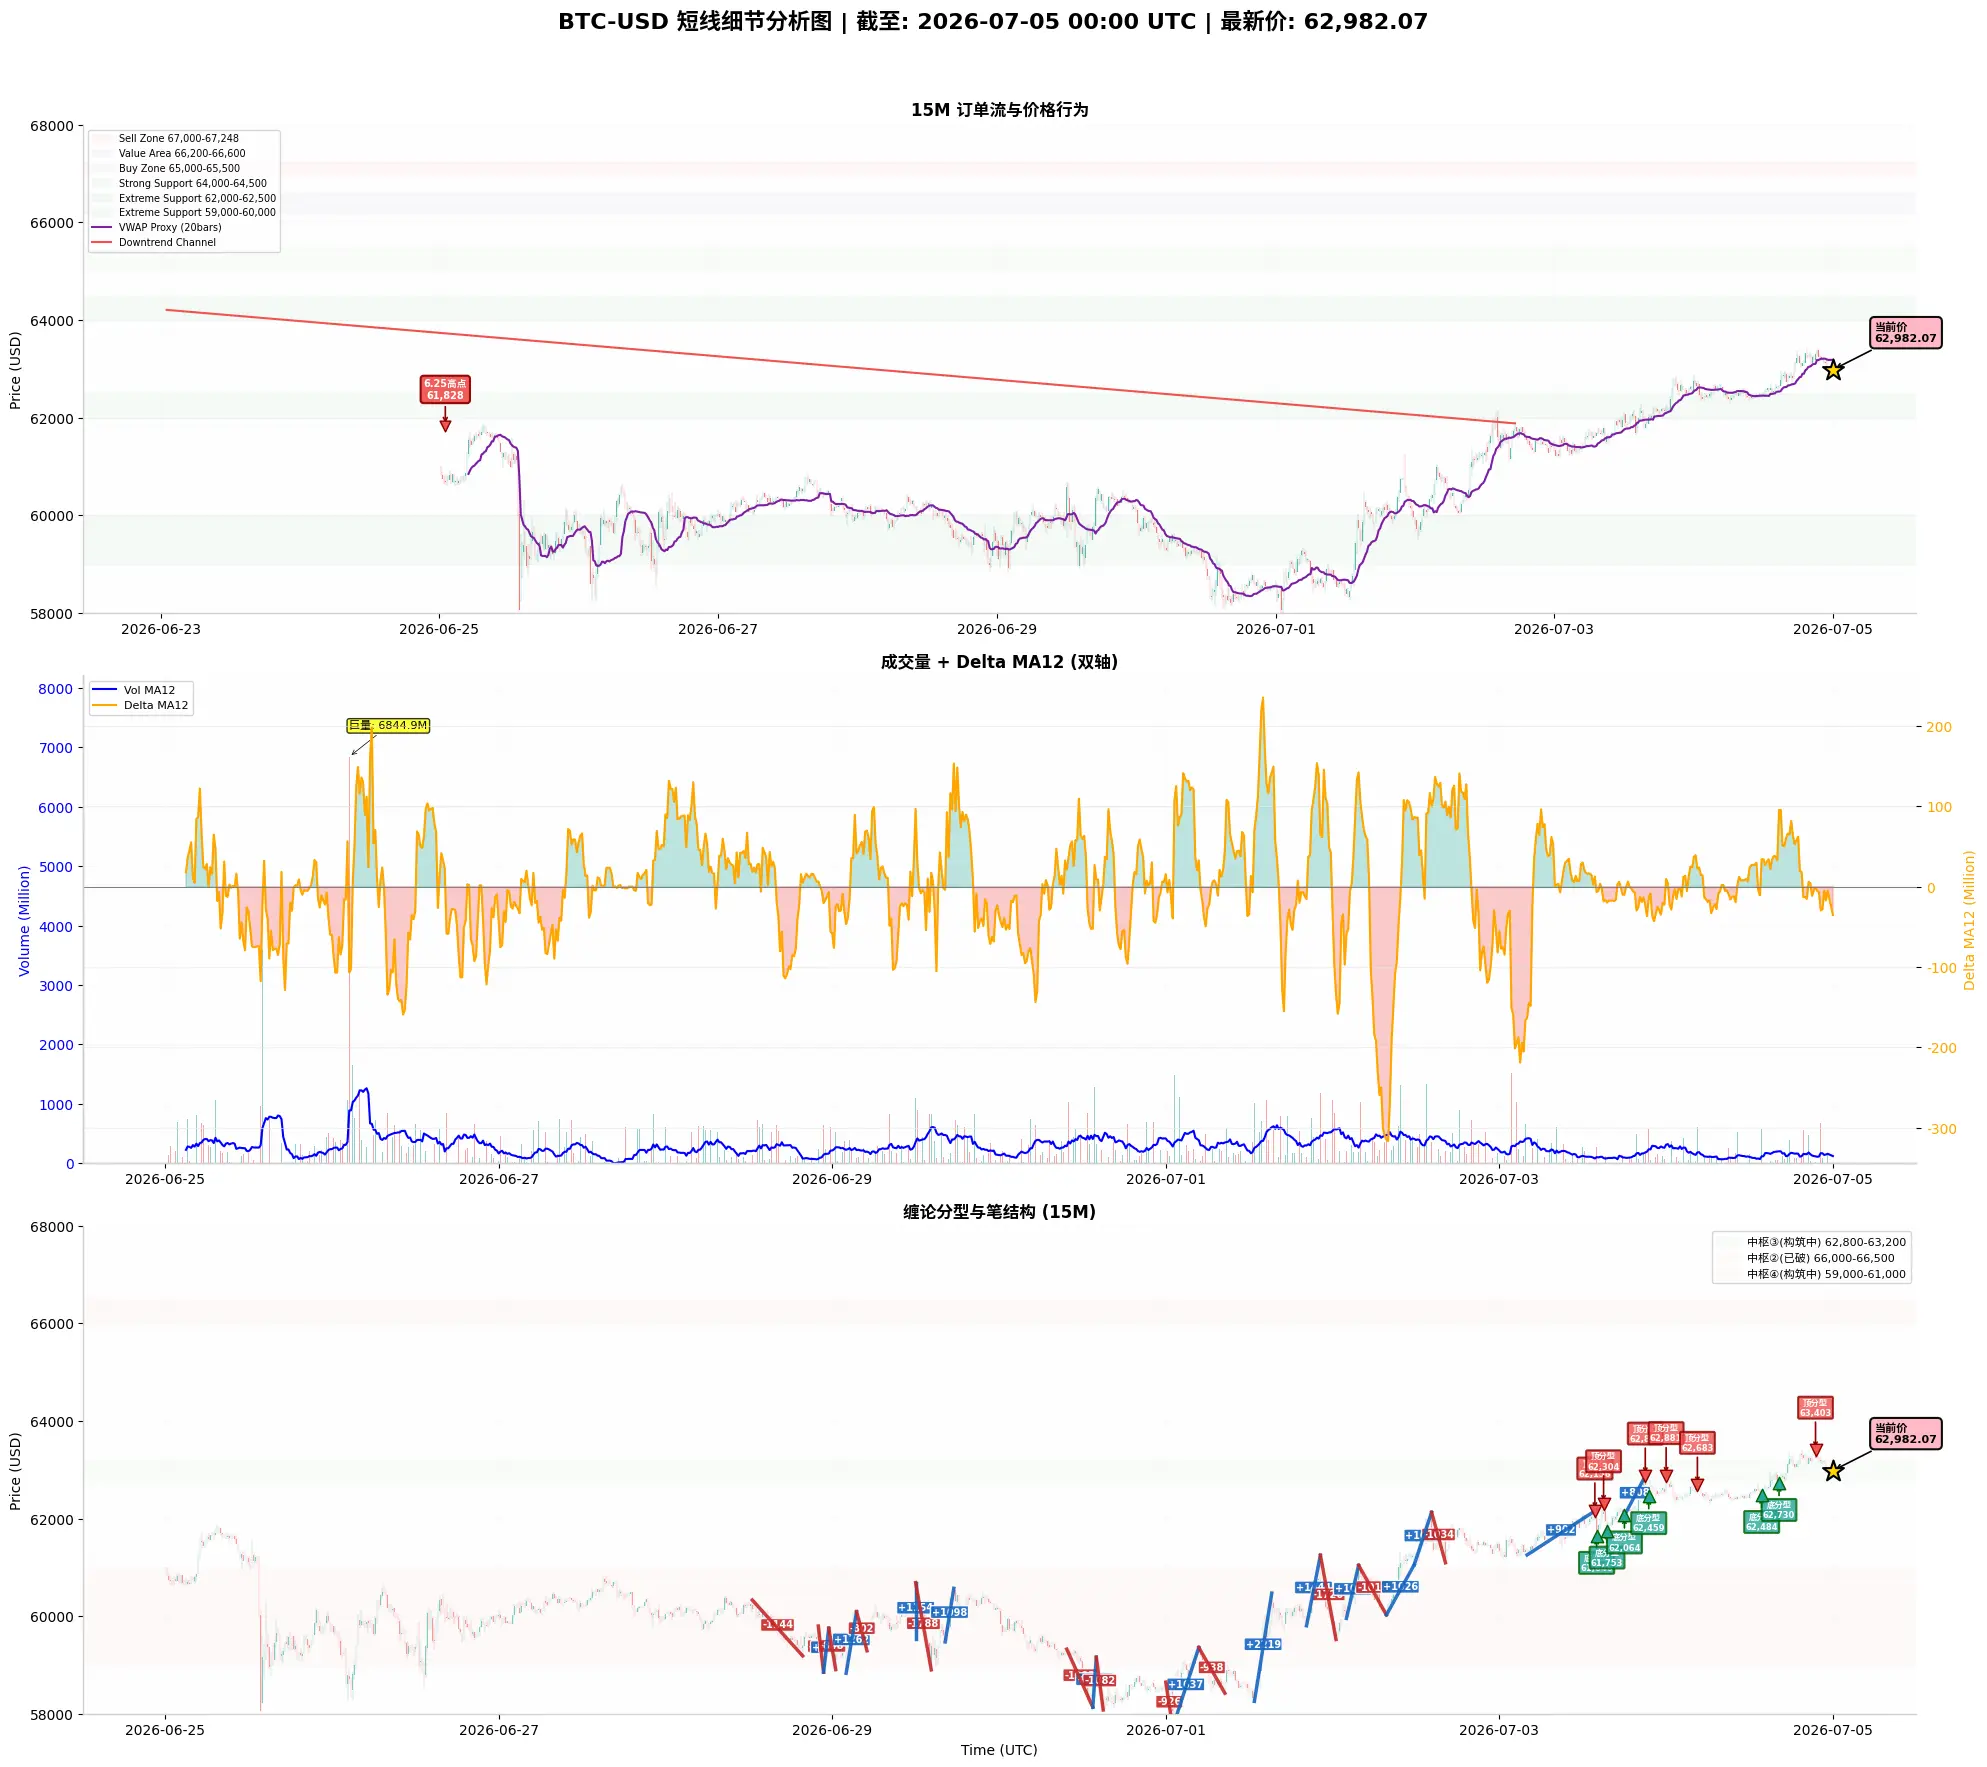
From Dow Theory, Gann Theory, Elliott Wave Theory, Volume-Price Relationship, Order Flow, and Price Action, a brief analysis of BTC short-term trends (Strategy Suggestions)$BTC ‌Comprehensive Analysis
Dow Theory indicates the main trend remains downward but with weakening selling momentum, while the short-term trend enters a correction phase after a rebound, with key levels at 64,600 (upper) and 62,000 (lower).
Gann Theory shows an extremely strong upward stroke (+6,876) and a medium downward stroke (-2,341), currently in a direction selection phase after consolidation structure formation.
El
BTC-1.56%
View Original
post-image
post-image
  • Reward
  • Comment
  • Repost
  • Share
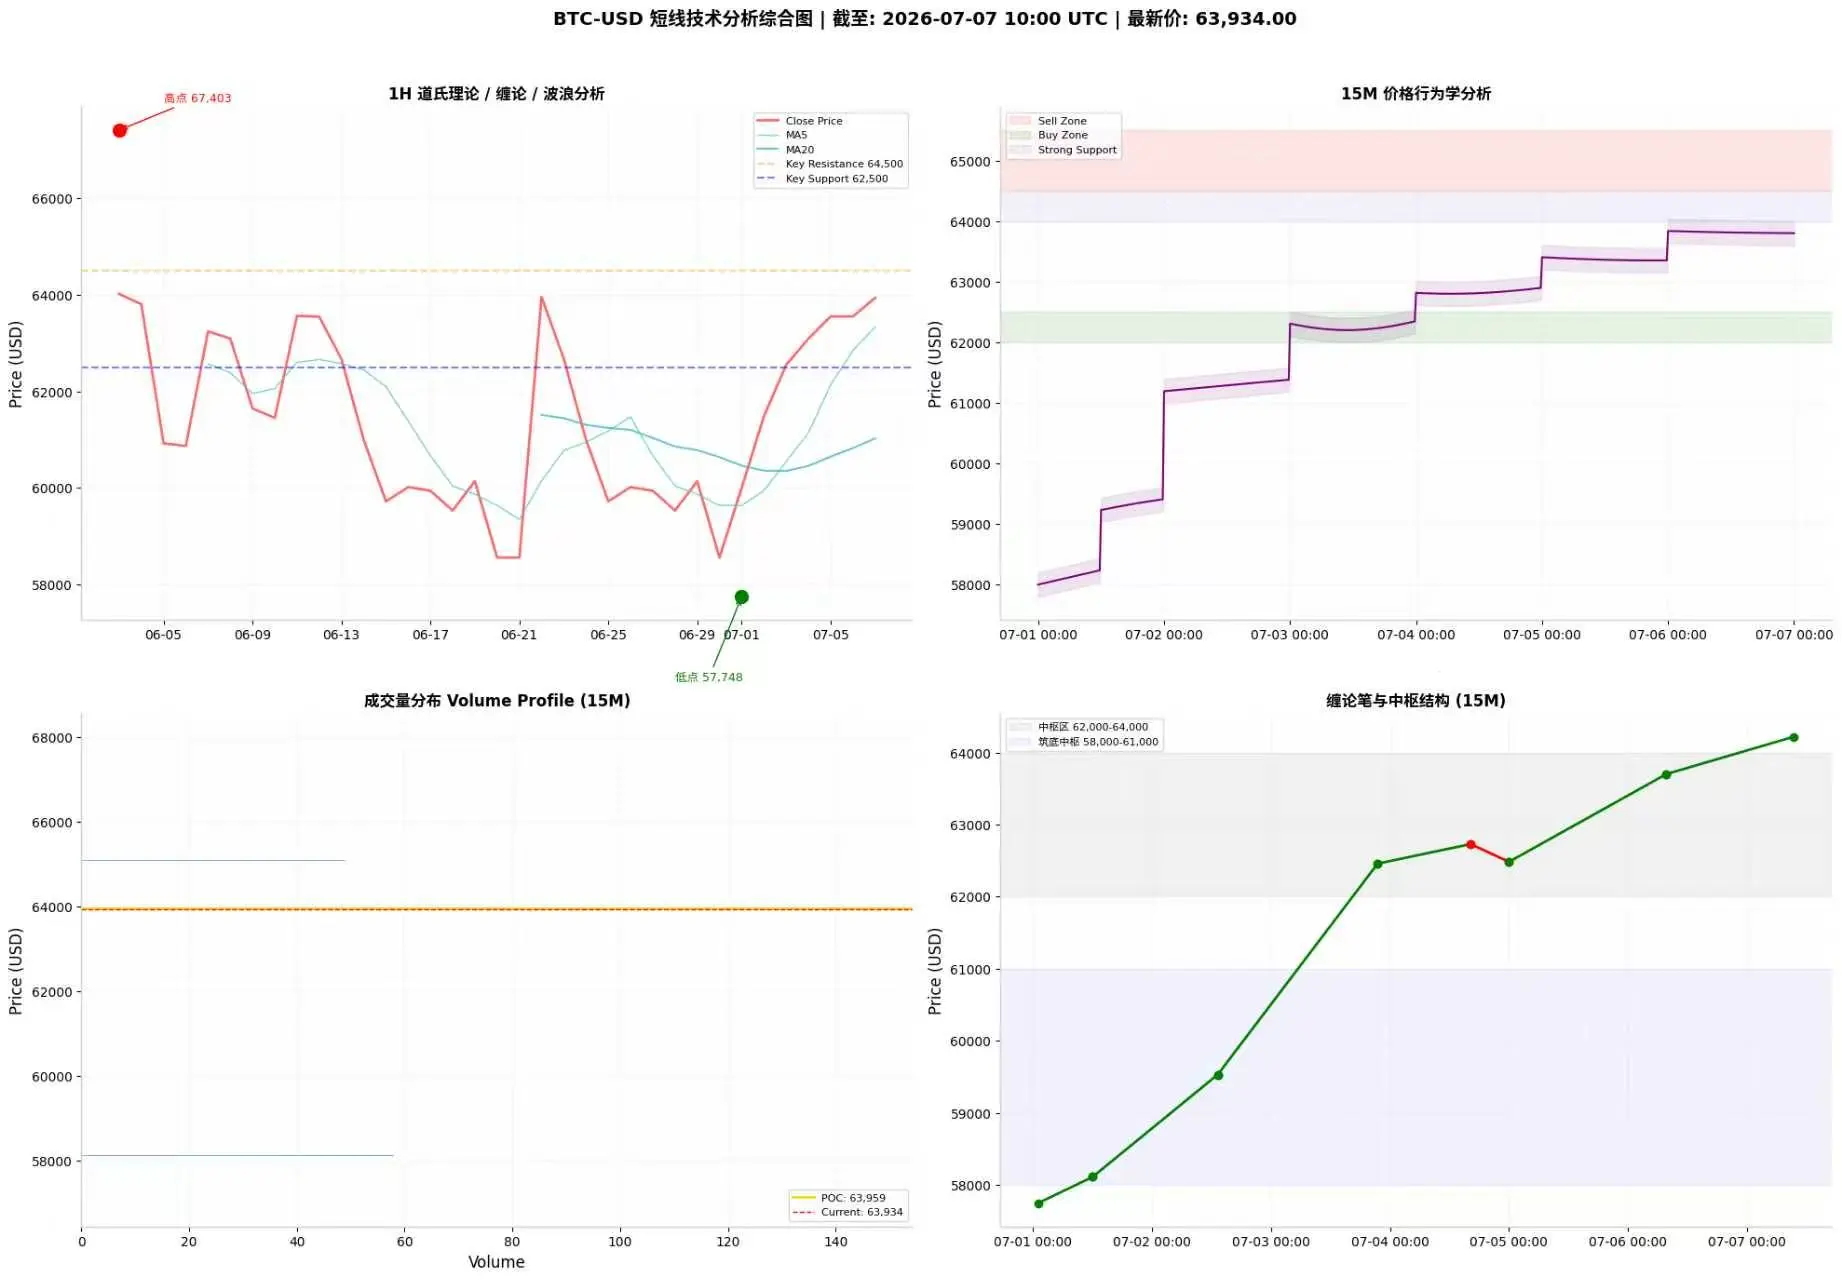
From Dow Theory, Chan Theory, Elliott Wave Theory, Volume-Price Analysis, Order Flow, and Price Action: A Brief Analysis of BTC Short-Term Trends
$BTC I. Dow Theory
Major Trend (1-hour level): The medium-term downtrend from the June 3 high of 67,403 is extremely clear. Prices fell from 67,403 all the way to the July 1 low of 57,748, a decline of about 9,655. However, since July 1, there has been a clear pattern of "higher lows": 57,748 (7-01) → 58,112 (7-01) → 59,532 (7-02) → 61,177 (7-03), and from July 2–7, consecutive rebounds broke through the 60,000, 61,000, 62,000, and 63,000 round
BTC-1.56%
View Original
post-image
  • Reward
  • Comment
  • Repost
  • Share
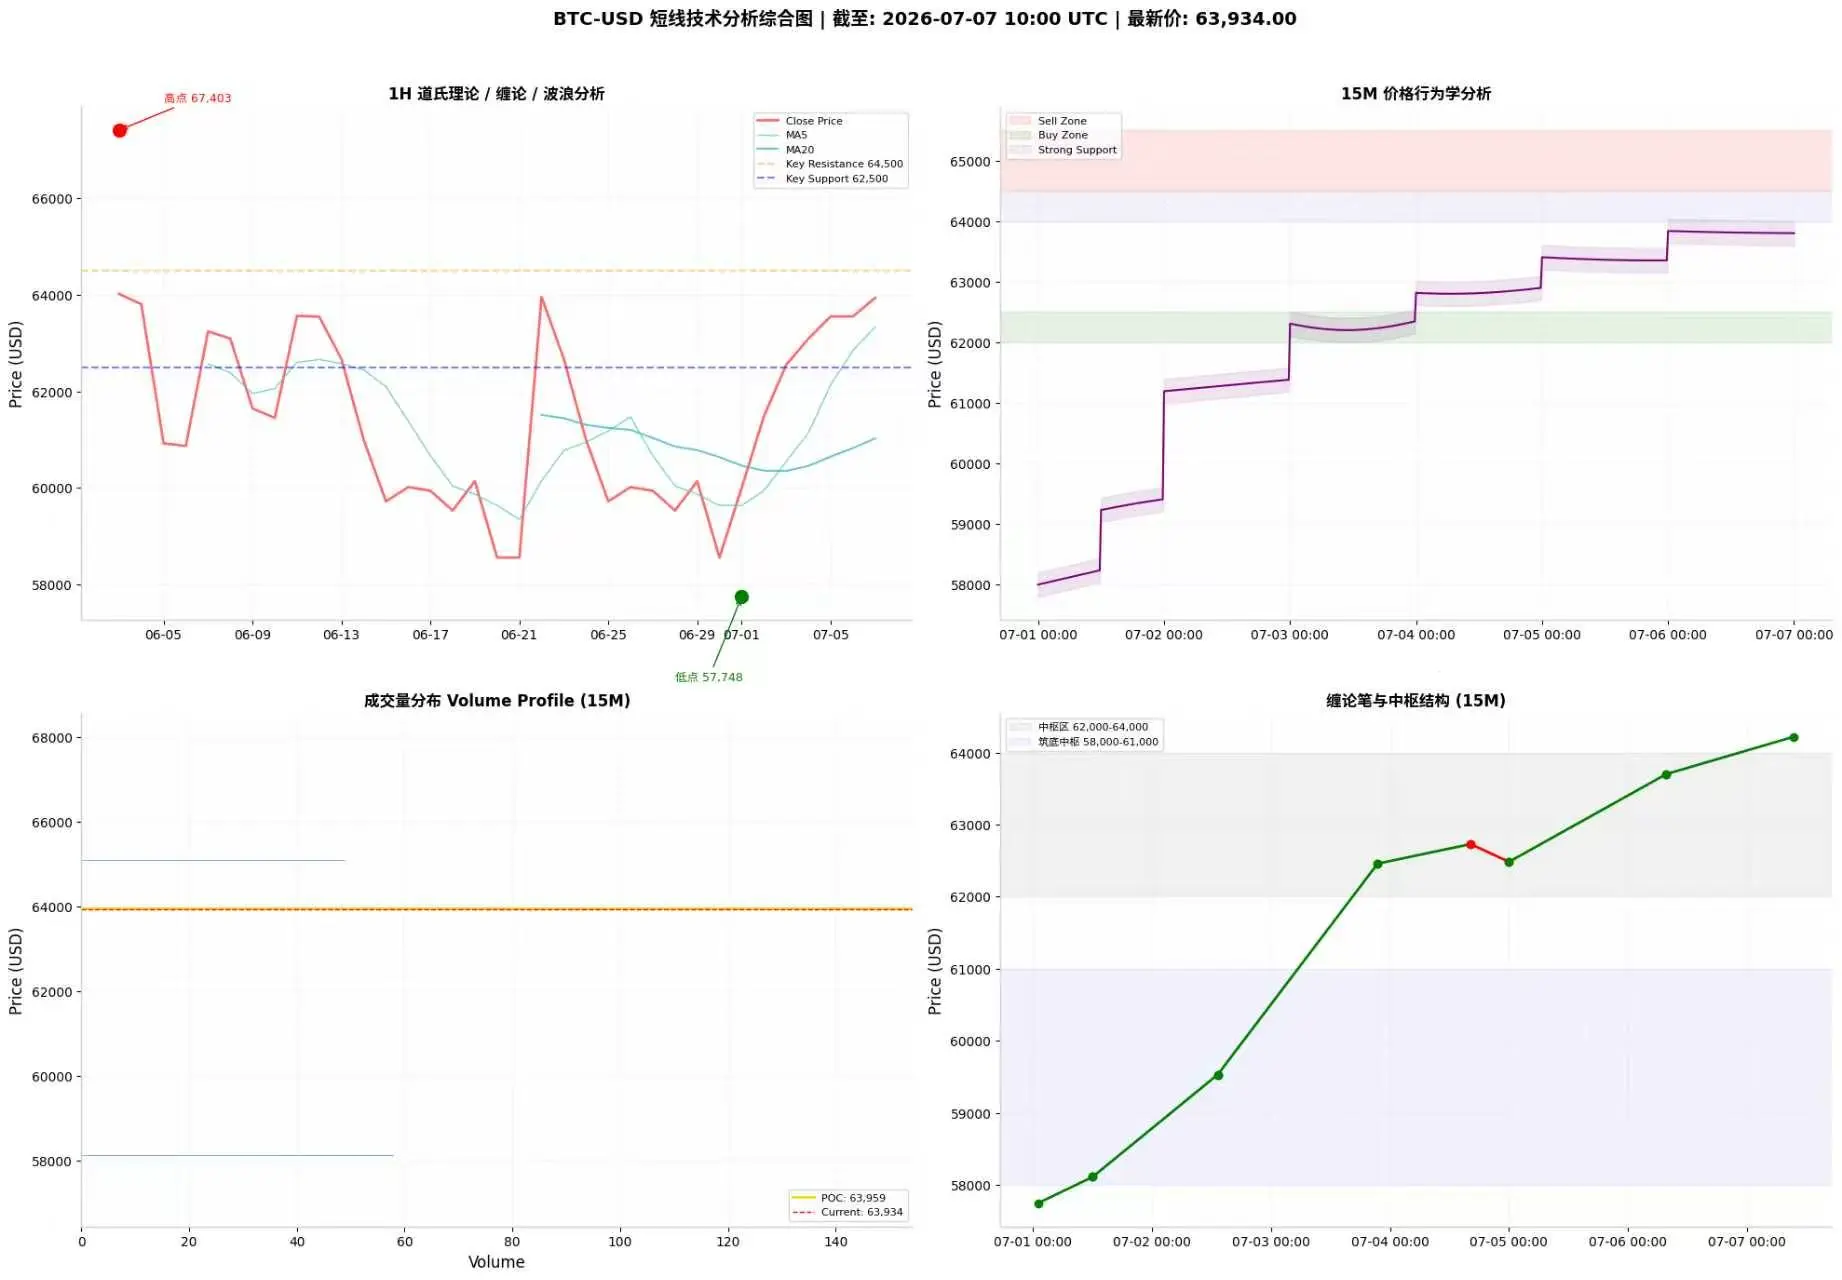
From Dow Theory, Chan Theory, Wave Theory, Volume-Price Relationship, Order Flow, and Price Action, a brief analysis of BTC short-term trend (Strategy suggestions)
$BTC ‌Comprehensive Analysis
Dow Theory indicates that the main trend is still a deep decline but the downward momentum has significantly weakened; the short-term trend has entered an upward phase. Key levels are 64,500 (upper) / 62,500 (lower).
Chan Theory shows an extremely strong upward stroke (+6,473), currently in a consolidation phase after the extension of the upward stroke.
Wave Theory confirms the completion of a five-wave
BTC-1.56%
View Original
post-image
  • Reward
  • Comment
  • Repost
  • Share
A Brief Analysis of BTC Short-Term Trend from the Perspectives of Dow Theory, Chan Theory, Elliott Wave Theory, Volume-Price Relationship, Order Flow, and Price Action
$BTC ‌I. Dow Theory
Primary Trend (1-hour level): The mid-term downtrend from the June 3 high of 67,410 is extremely clear. The price dropped from 67,410 to the July 1 low of 57,720, a decline of about 9,690. However, since July 1, the price has shown a clear "higher lows" pattern: 57,720 (7-01) → 58,255 (7-01) → 59,307 (7-02) → 59,500 (7-03), and from July 2 to 6, successive rebounds broke through the integer levels of 61,
BTC-1.56%
View Original
post-image
post-image
  • Reward
  • Comment
  • Repost
  • Share
A brief analysis of BTC short-term trends from Dow Theory, Chan Theory, Elliott Wave Theory, Volume-Price Relationship, Order Flow, and Price Action (Strategy Suggestions)
$BTC Comprehensive Analysis
Dow Theory gives a signal that the main trend is still in a deep decline but the downward momentum has significantly weakened, and the short-term trend has entered an upward phase, with key levels at 64,000 (upper) / 62,500 (lower).
Chan Theory shows that the upward stroke is extremely strong (+5,982), and it is currently in a consolidation phase after the extension of the upward stroke.
Elliott
BTC-1.56%
View Original
post-image
post-image
  • Reward
  • Comment
  • Repost
  • Share
From Dow Theory, Chan Theory, Elliott Wave Theory, Volume-Price Analysis, Order Flow, and Price Action, a Brief Analysis of BTC Short-Term Trends
$BTC I. Dow Theory
Primary Trend (1-hour level): Since the June 3 high of 67,410, the medium-term downtrend has been extremely clear. The price fell from 67,410 to the July 1 low of 57,720, a drop of approximately 9,690. However, since July 1, the price has shown a clear "higher low" pattern: 57,720 (July 1) → 58,255 (July 1) → 59,307 (July 2) → 59,500 (July 3), and from July 2-5, it continuously bounced, breaking through the integer levels of 61,00
BTC-1.56%
View Original
post-image
post-image
  • Reward
  • Comment
  • Repost
  • Share
From Dow Theory, Chan Theory, Elliott Wave Theory, Volume-Price Relationship, Order Flow, and Price Action: A Brief Analysis of BTC Short-Term Trends (Strategy Suggestions)
$BTC ‌Comprehensive Analysis
Dow Theory indicates that the primary trend remains a deep decline, but downside momentum has significantly weakened, with the short-term trend entering an upward phase. Key levels are 63,500 (upper) / 62,000 (lower).
Chan Theory shows that the upward segment has extremely strong momentum (+5,367), currently in a consolidation phase after an extended upward segment.
Elliott Wave Theory confirms
BTC-1.56%
View Original
post-image
post-image
  • Reward
  • Comment
  • Repost
  • Share
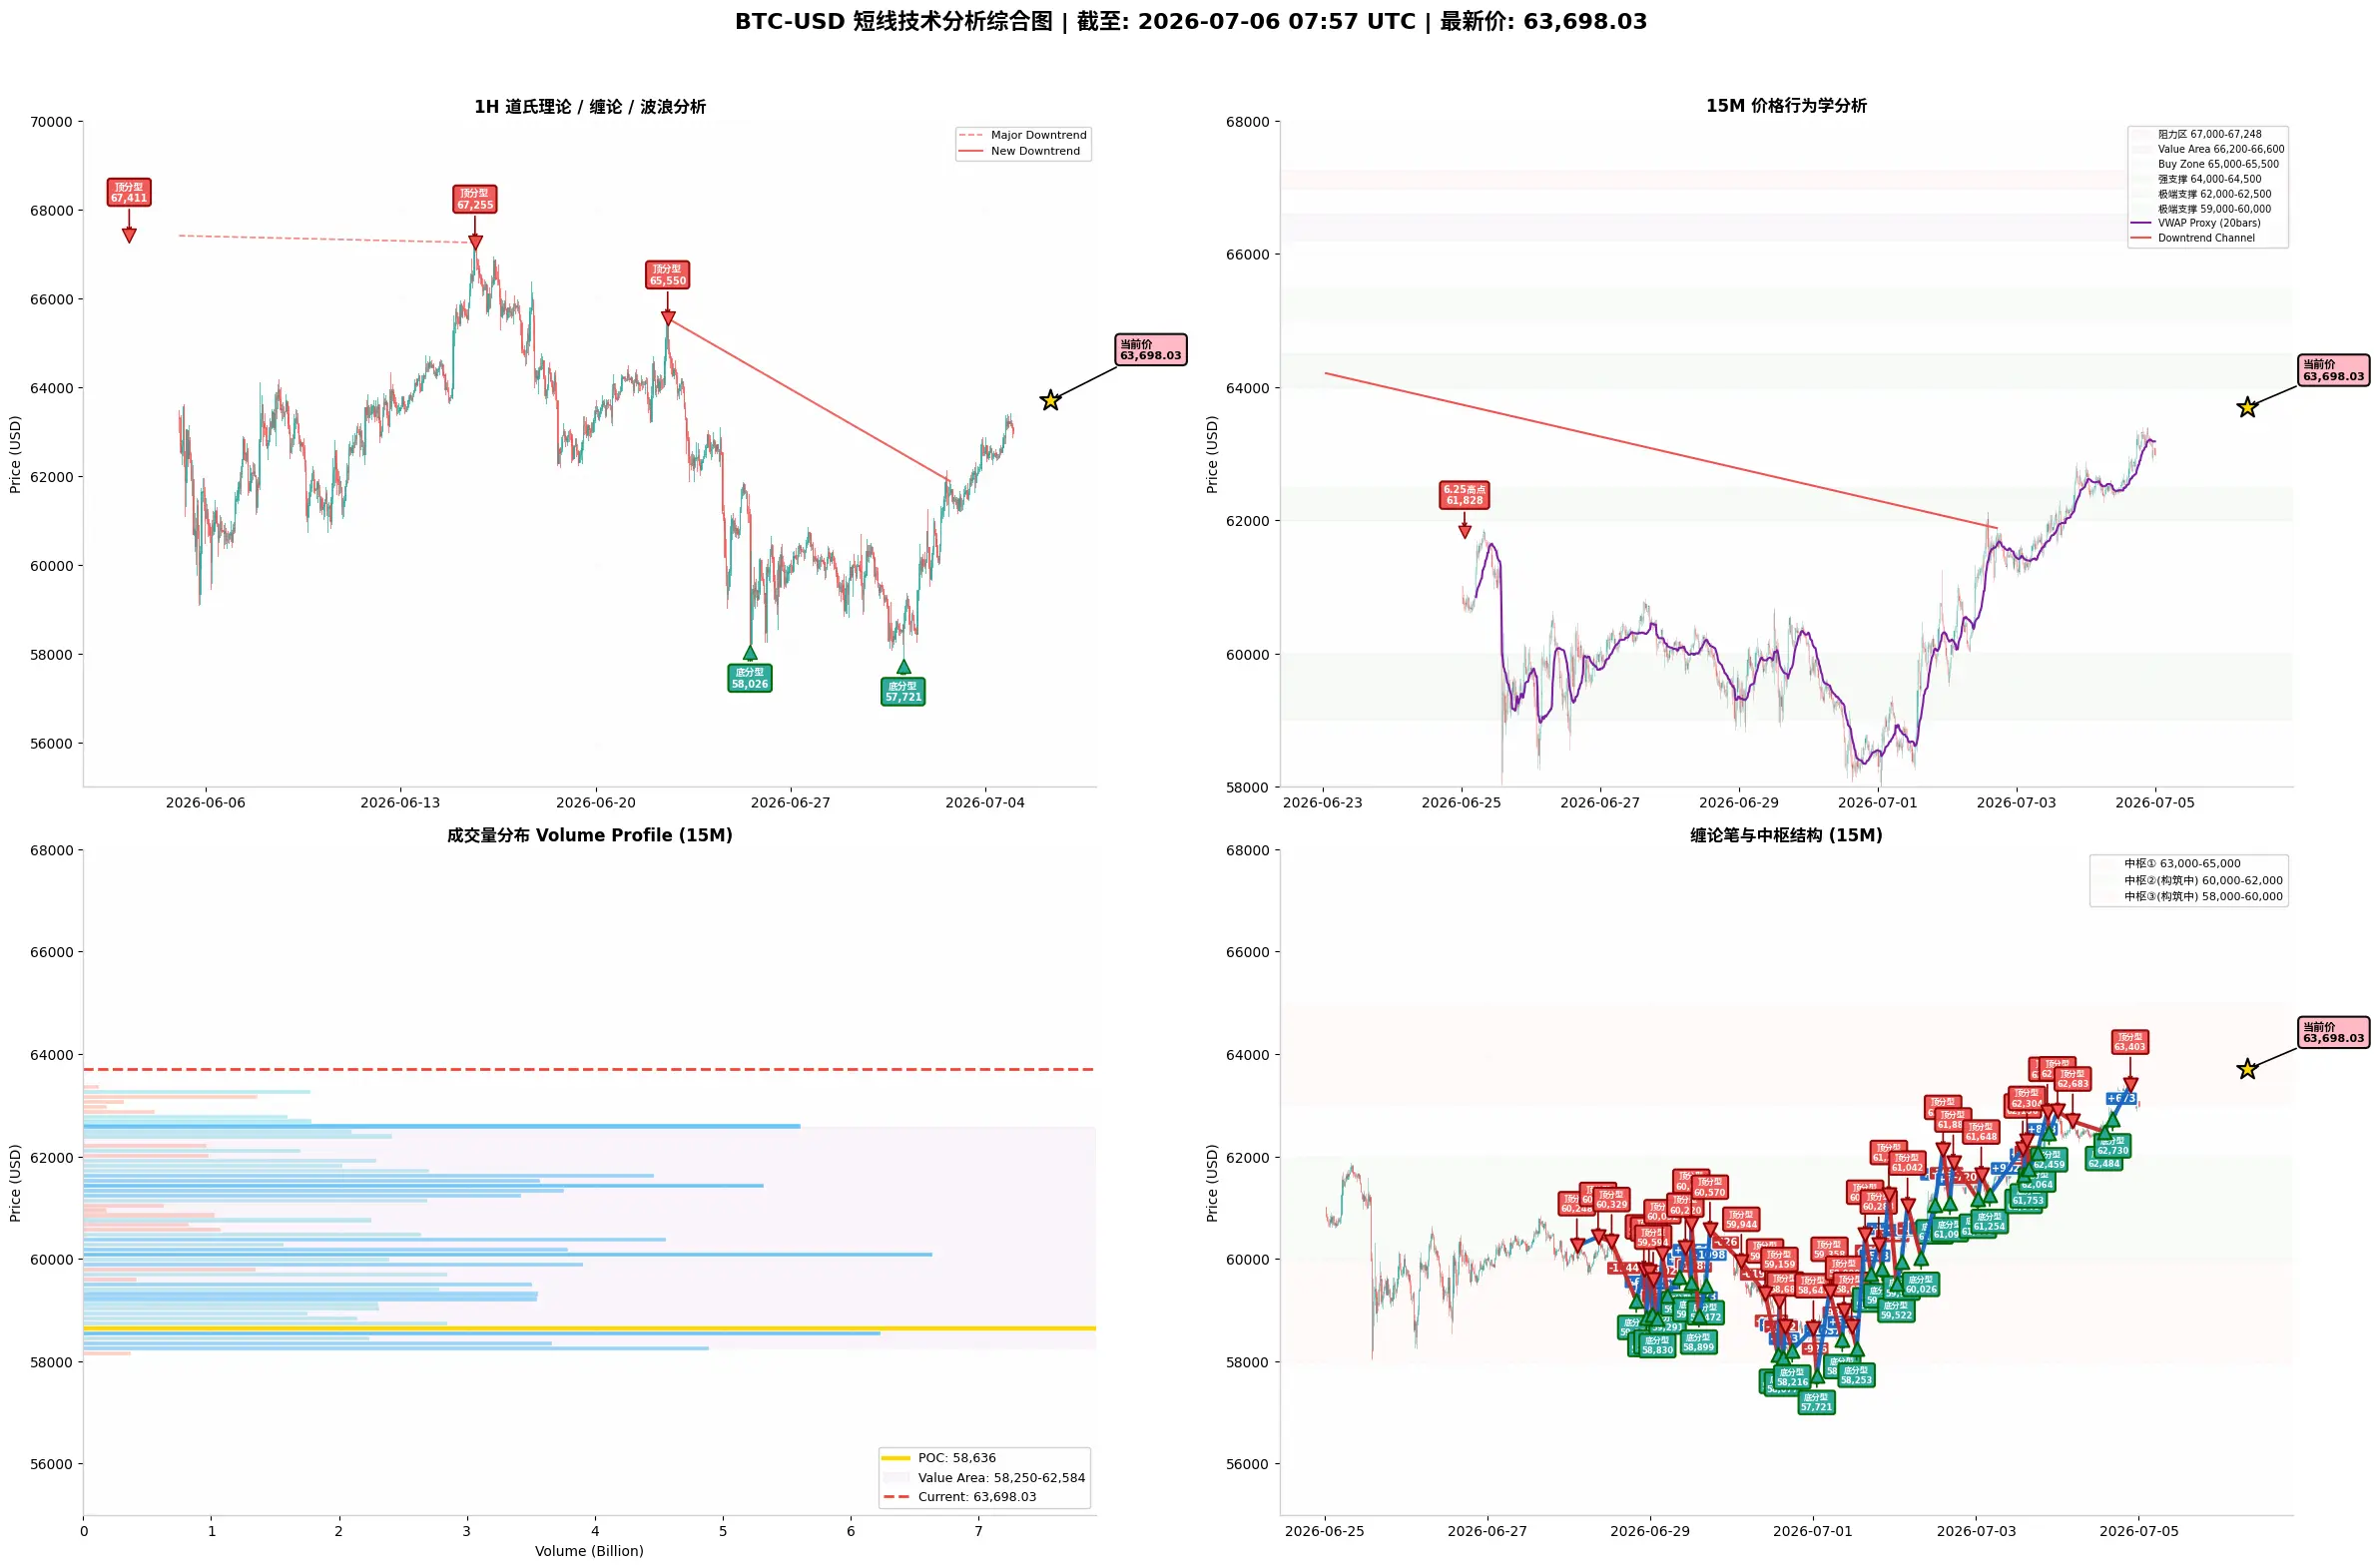
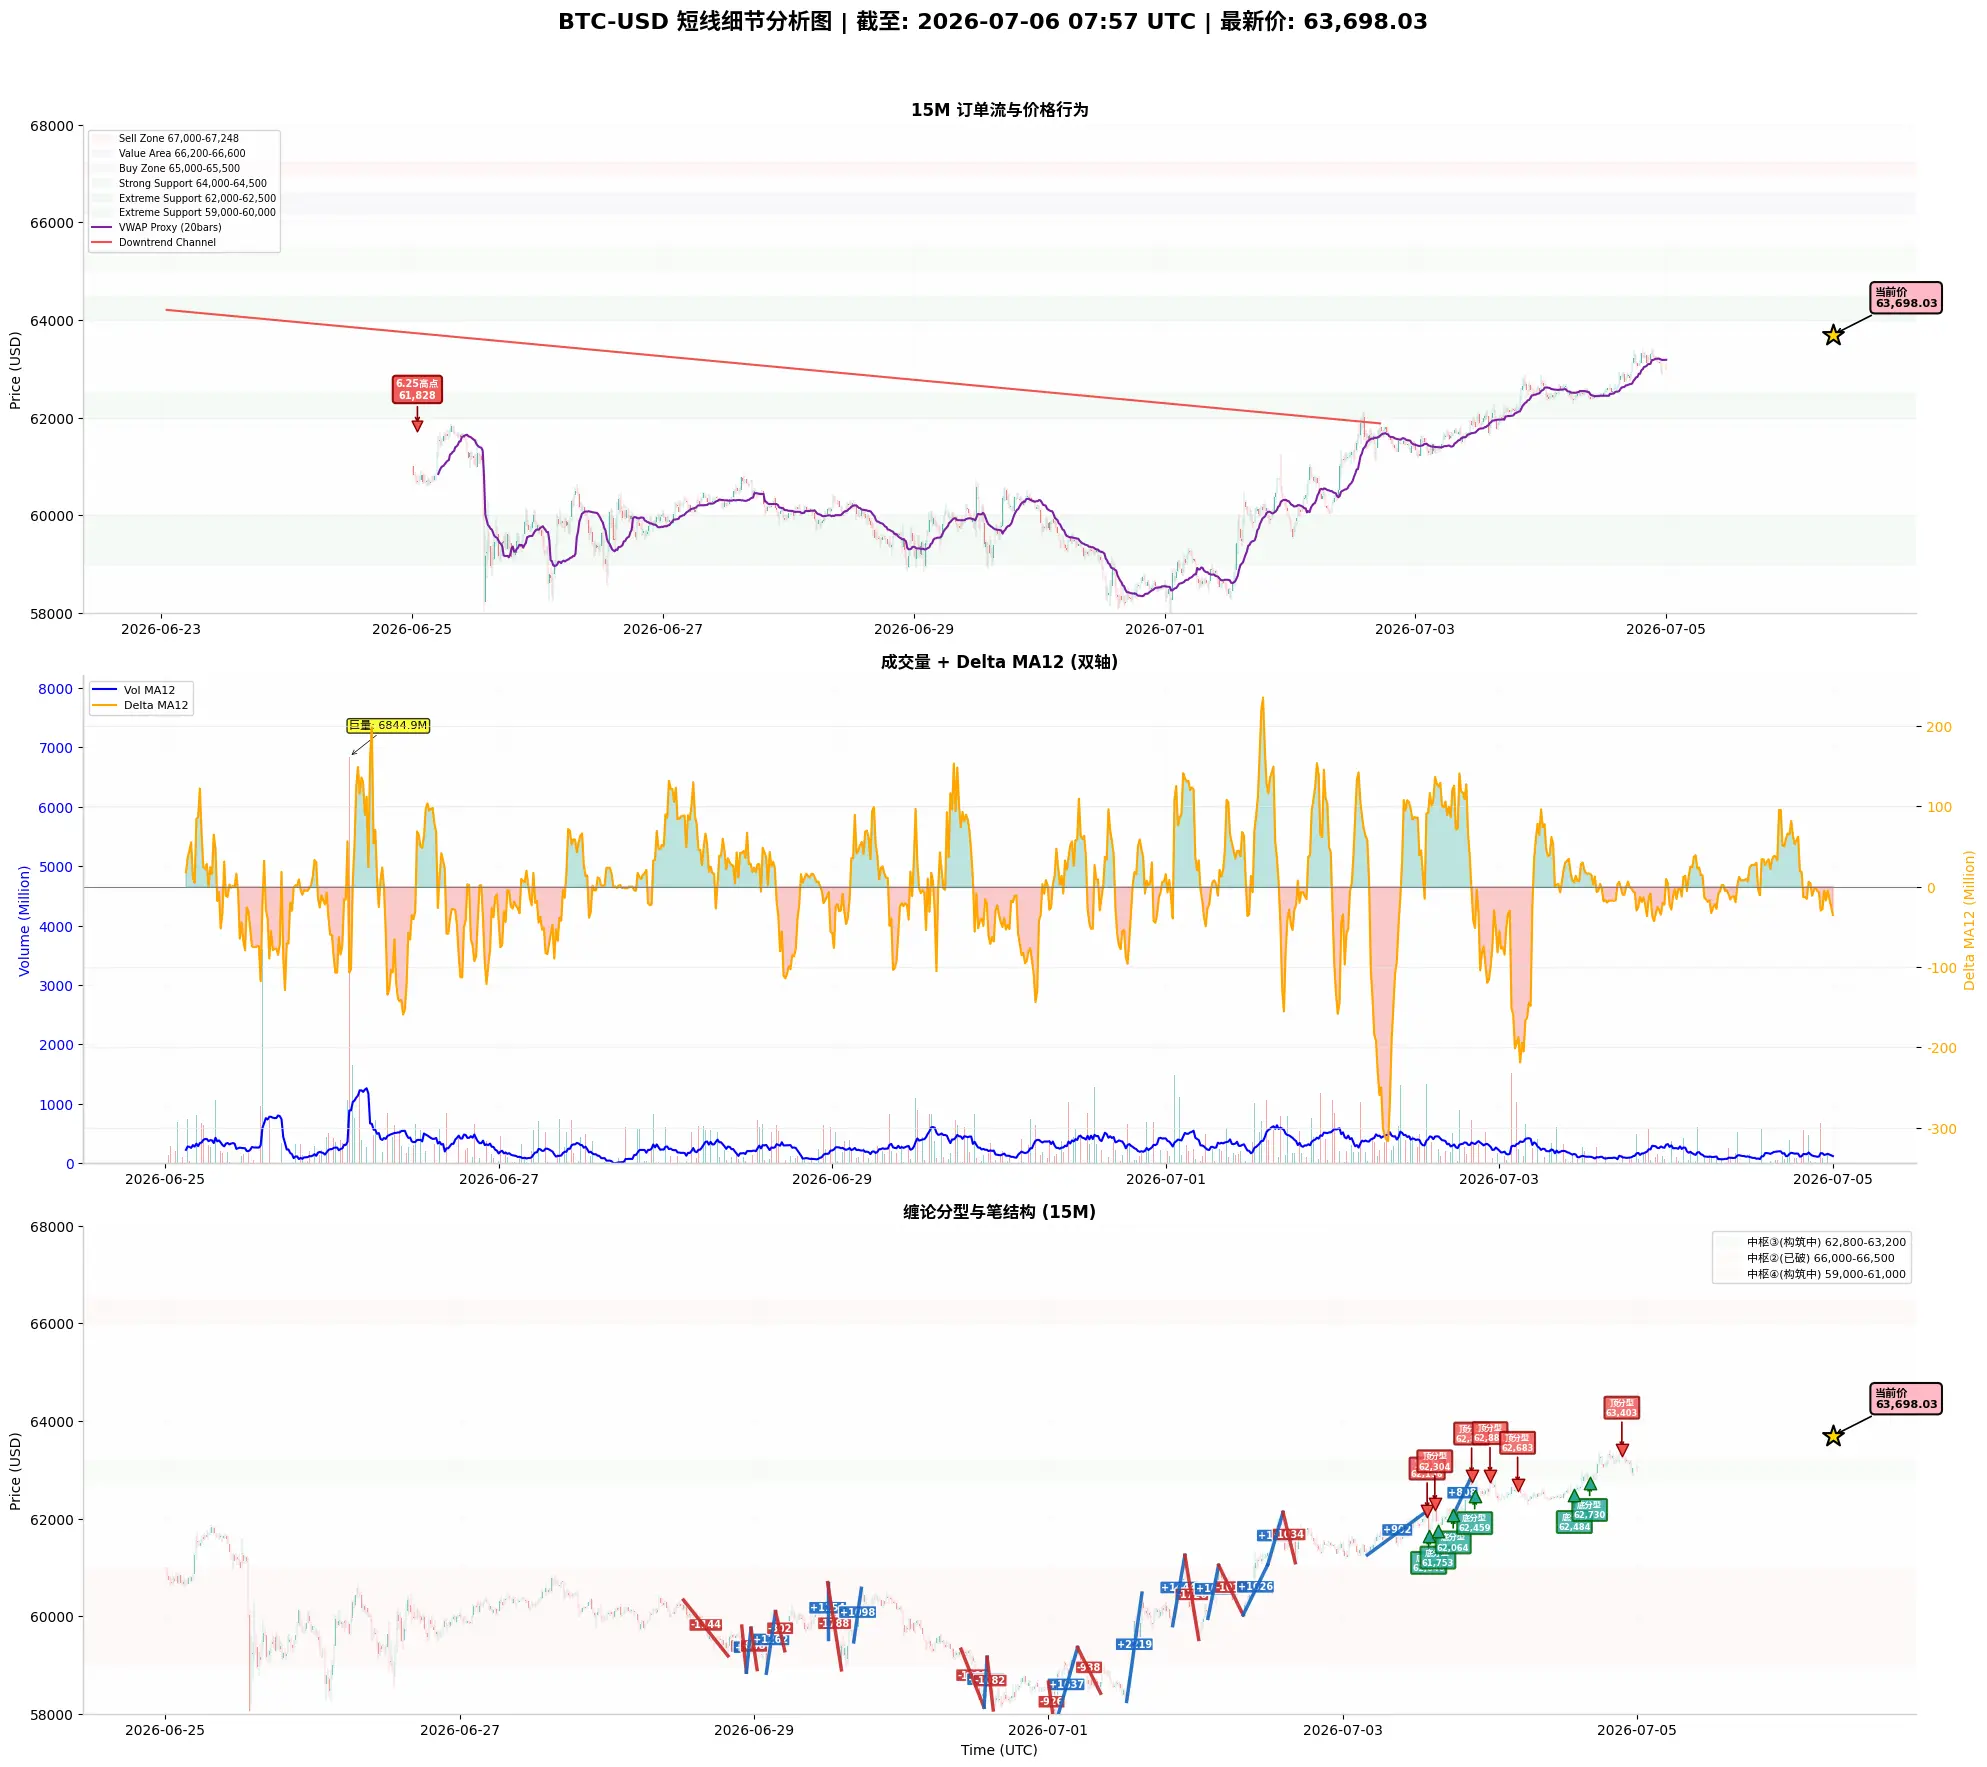
From Dow Theory, Chan Theory, Elliott Wave, Volume-Price Analysis, Order Flow, and Price Action, a brief analysis of BTC short-term trend
$BTC I. Dow Theory
Primary Trend (1-hour level): The medium-term downtrend from the June 3 high of 67,410 is extremely clear and steep. The price has plummeted from 67,410, with several bounces (June 15 rebound to 67,254, June 22 rebound to 65,549) failing to break the previous high, forming a typical "lower highs" bearish pattern. After the June 22 high of 65,549, bears struck again, with a panic sell-off on June 25 to 58,026, and a new low of 57,720 o
BTC-1.56%
View Original
post-image
post-image
  • Reward
  • Comment
  • Repost
  • Share
Based on Dow Theory, Chan Theory, Elliott Wave Theory, Volume-Price Relationship, Order Flow, and Price Action, a Brief Analysis of BTC's Short-Term Trend (Strategy Suggestions)
$BTC ‌Comprehensive Analysis
Dow Theory indicates that the main trend remains a deep decline but with significantly diminished downward momentum; the short-term trend has entered a confirmation of a rebound, with key levels at 62,500 (upper) and 60,000 (lower).
Chan Theory shows that the downward stroke has extreme momentum (-7,829), but the latest upward stroke has relatively strong momentum (+2,600), currently in th
BTC-1.56%
View Original
post-image
post-image
  • Reward
  • Comment
  • Repost
  • Share
$BTC Using Dow Theory, Chan Theory, Elliott Wave Theory, Volume-Price Analysis, Order Flow, and Price Action to Analyze BTC Short-Term Trends
‌I. Dow Theory
Major Trend (1-hour level): The mid-term downtrend from the June 3 high of 67,410 is very clear. The price has fallen from 67,410, with several rebounds (June 15 rebound to 67,254, June 22 rebound to 65,549) failing to break the previous highs, forming a typical "lower highs" bearish arrangement. After the June 22 high of 65,549, bears resumed pressure, leading to a sharp drop to 58,026 on June 25, followed by some consolidation but a
BTC-1.56%
View Original
post-image
  • Reward
  • Comment
  • Repost
  • Share
A brief analysis of BTC short-term trends (strategy suggestions) from Dow Theory, Chan Theory, Elliott Wave Theory, Volume-Price Relationship, Order Flow, and Price Action.
$BTC Comprehensive Analysis
Dow Theory indicates that the major trend remains a deep decline but with significantly waning downward momentum; the short-term trend is entering a consolidation bottoming pattern, with key levels at 61,881 (upper) and 60,000 (lower).
Chan Theory shows that the downward stroke had great strength (-7,829) but the latest downward stroke has significantly weakened (-791), and it is currently in th
BTC-1.56%
View Original
post-image
  • Reward
  • Comment
  • Repost
  • Share
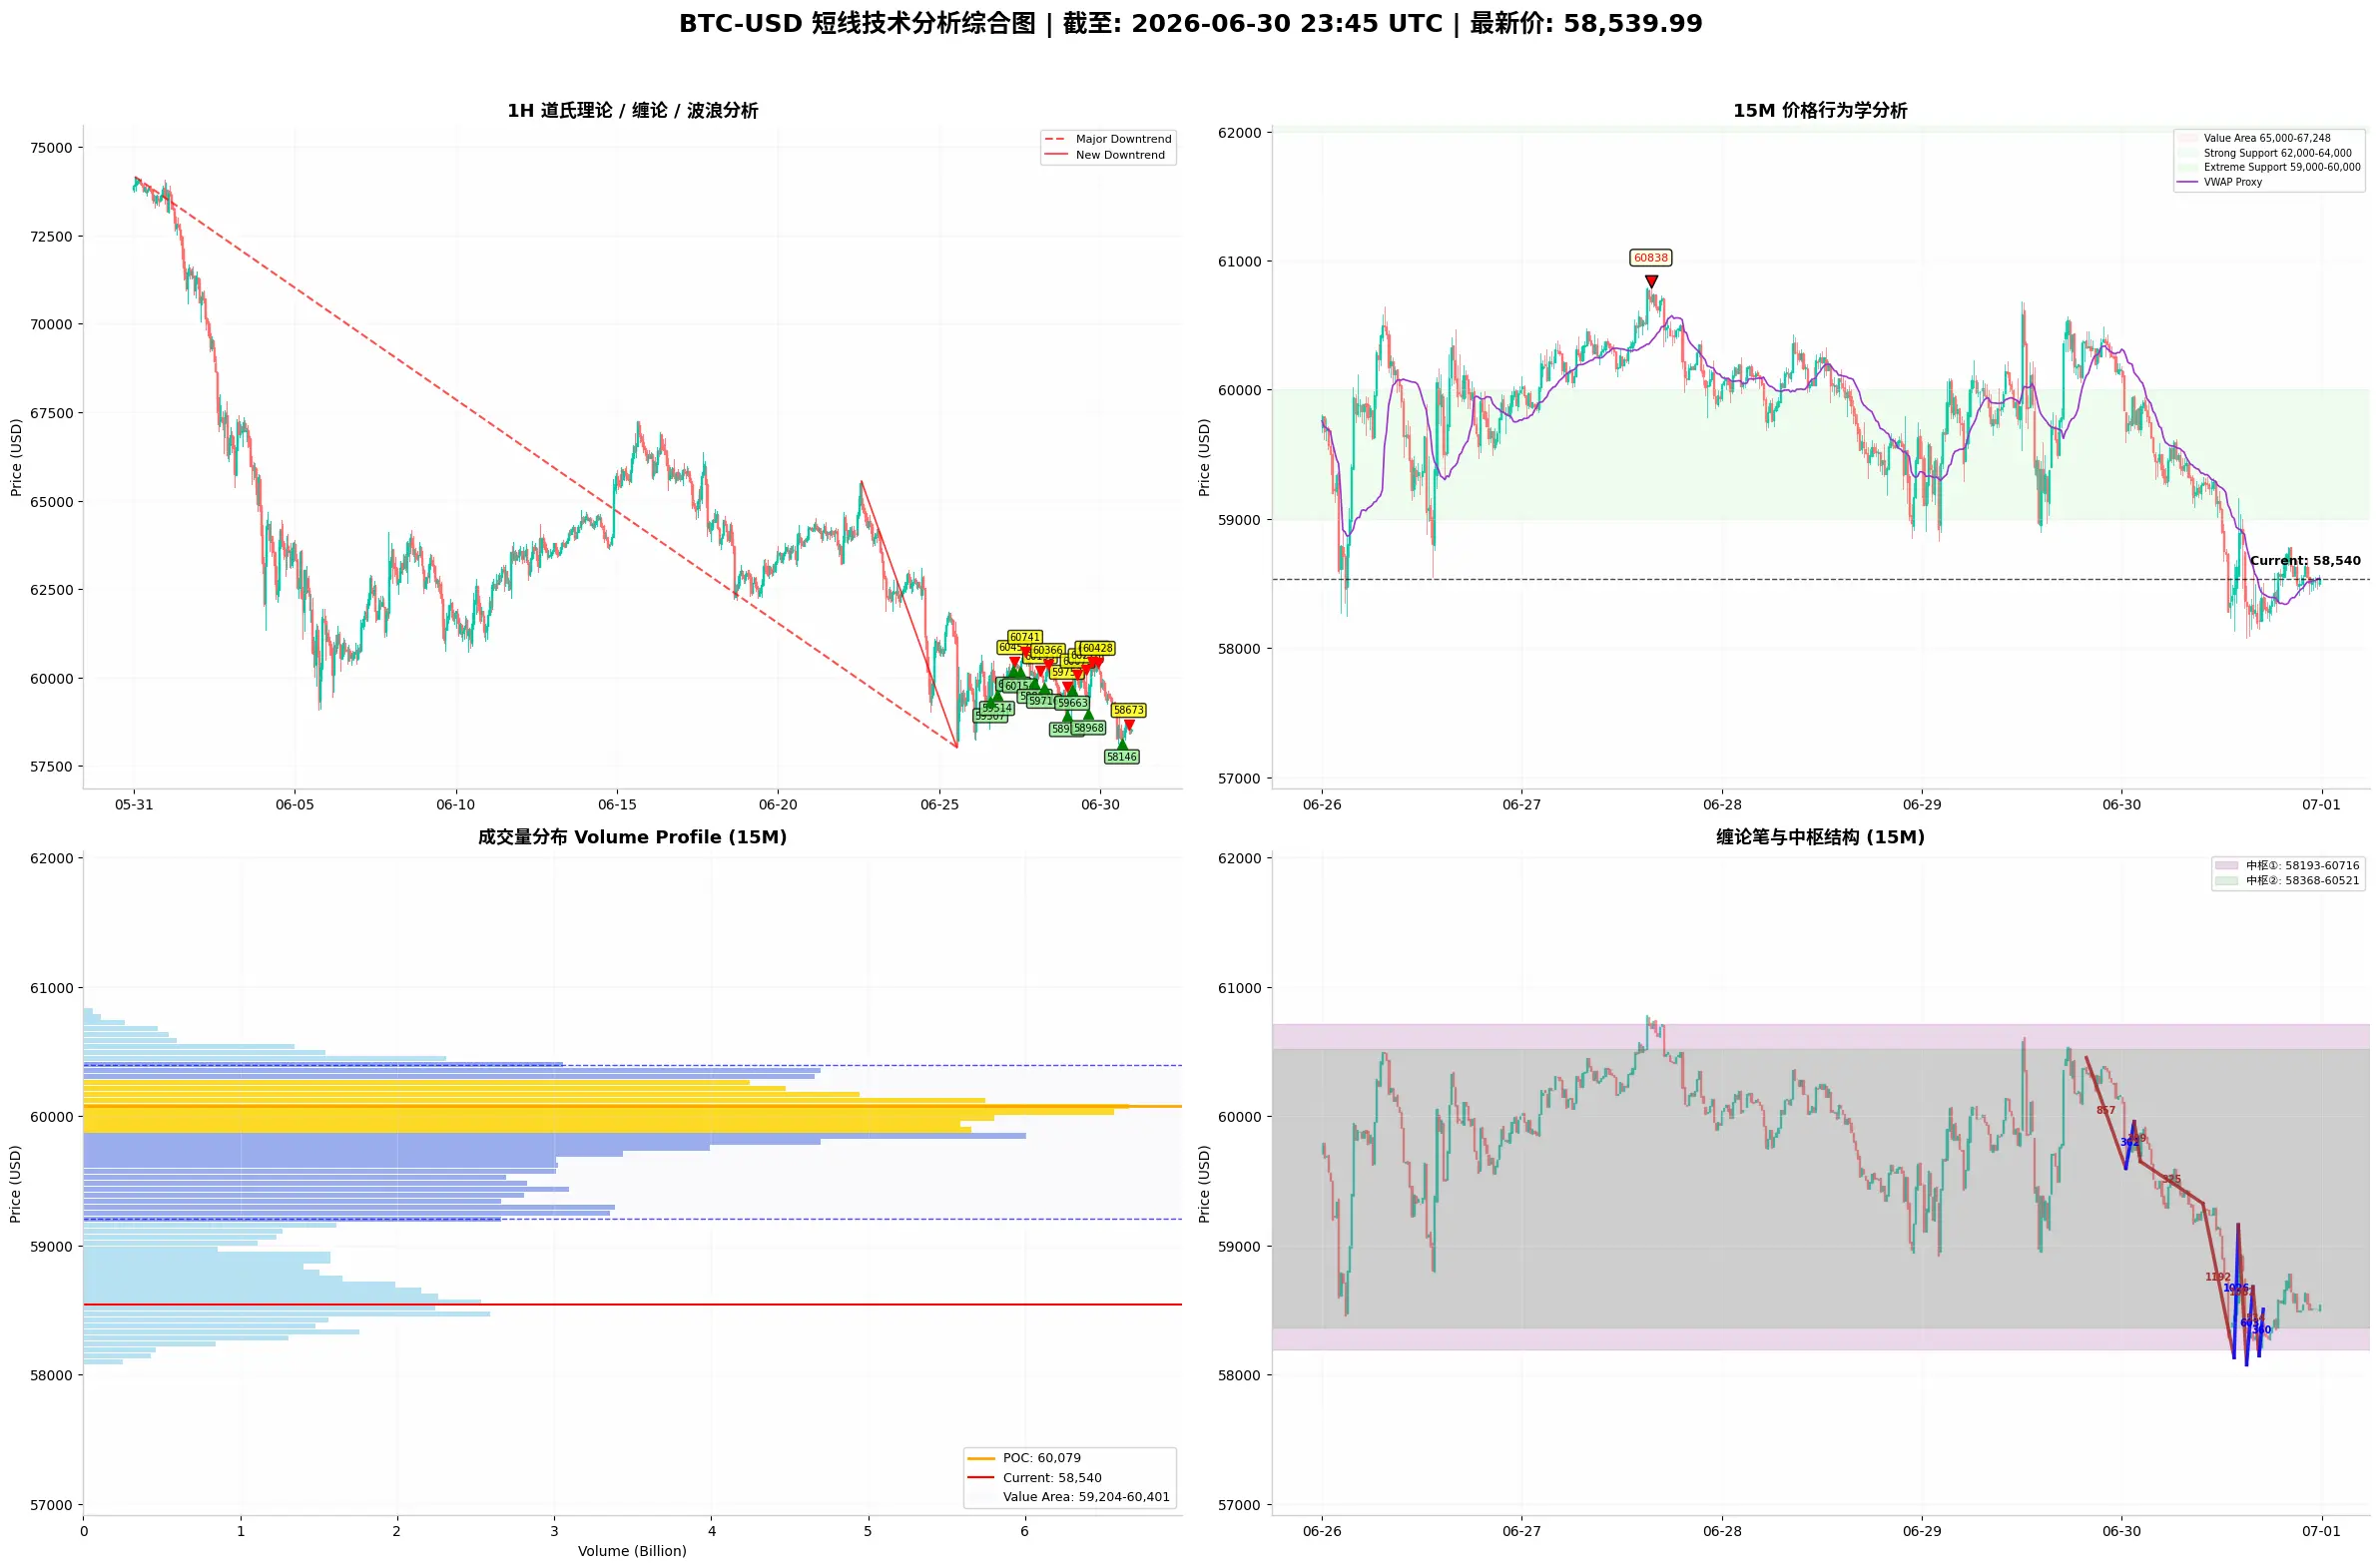
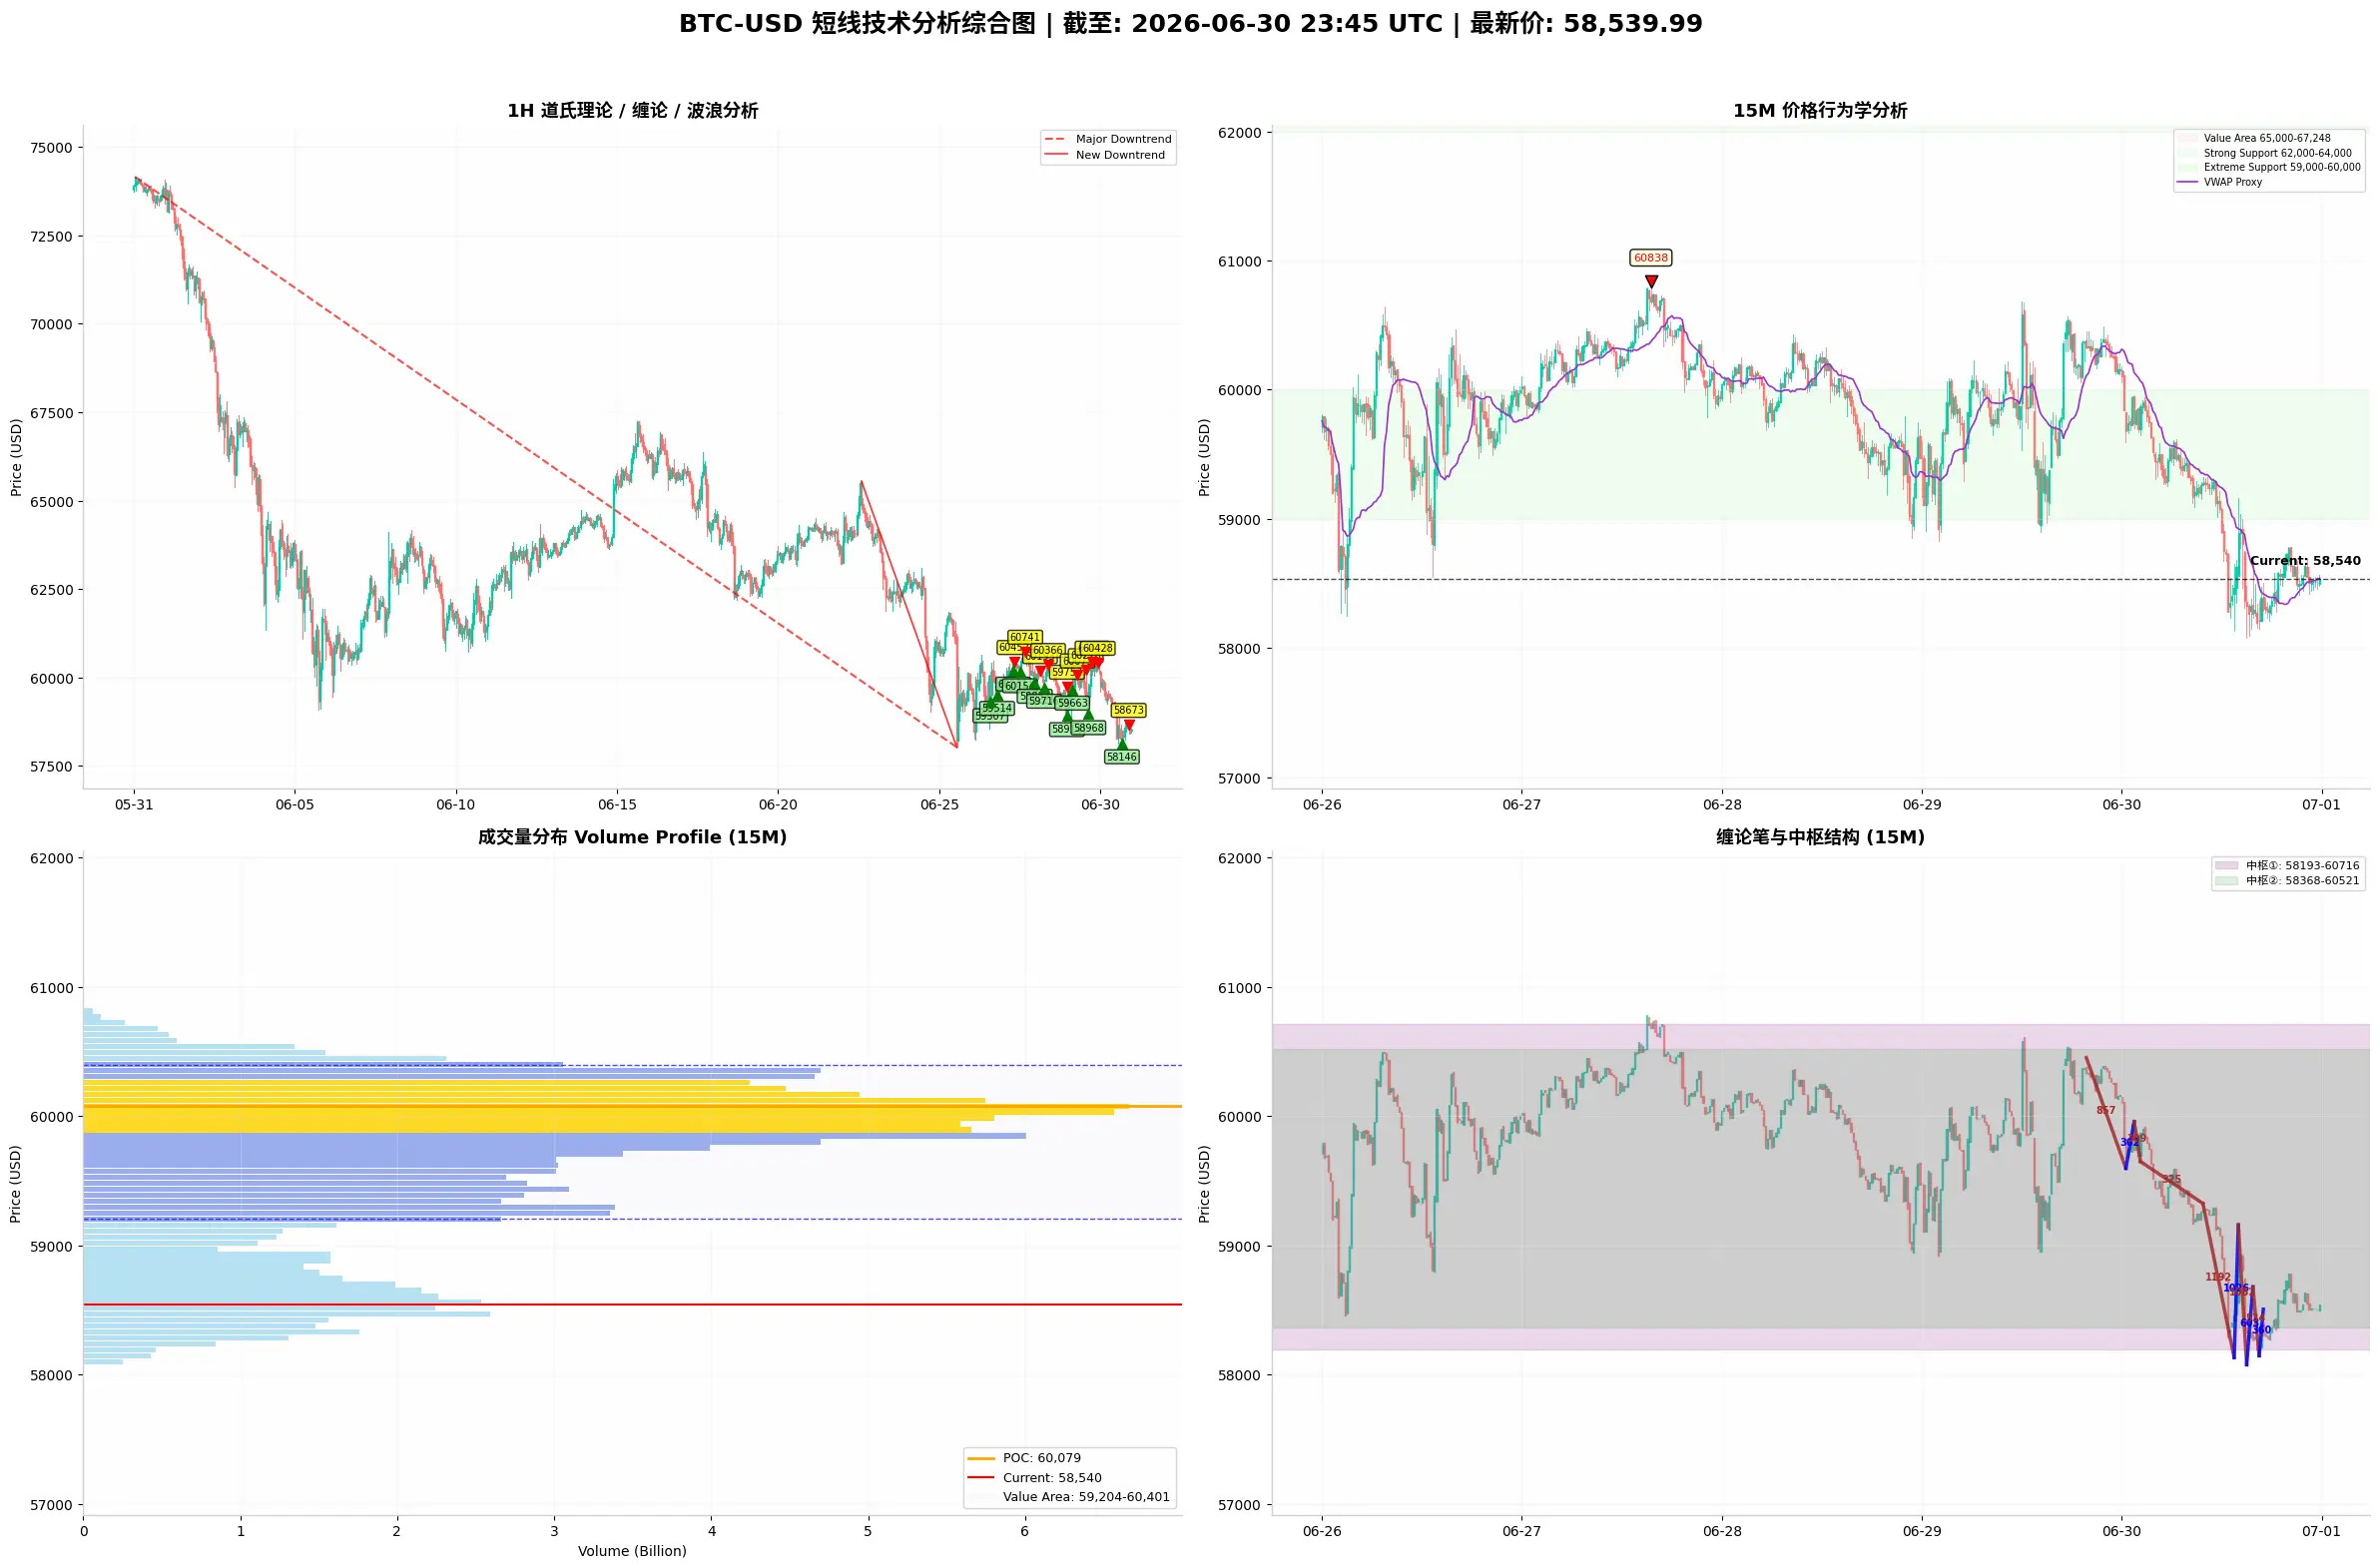
From the Perspectives of Dow Theory, Chan Theory, Elliott Wave Theory, Volume-Price Relationship, Order Flow, and Price Action: A Brief Analysis of BTC's Short-Term Trend
$BTC ‌1. Dow Theory
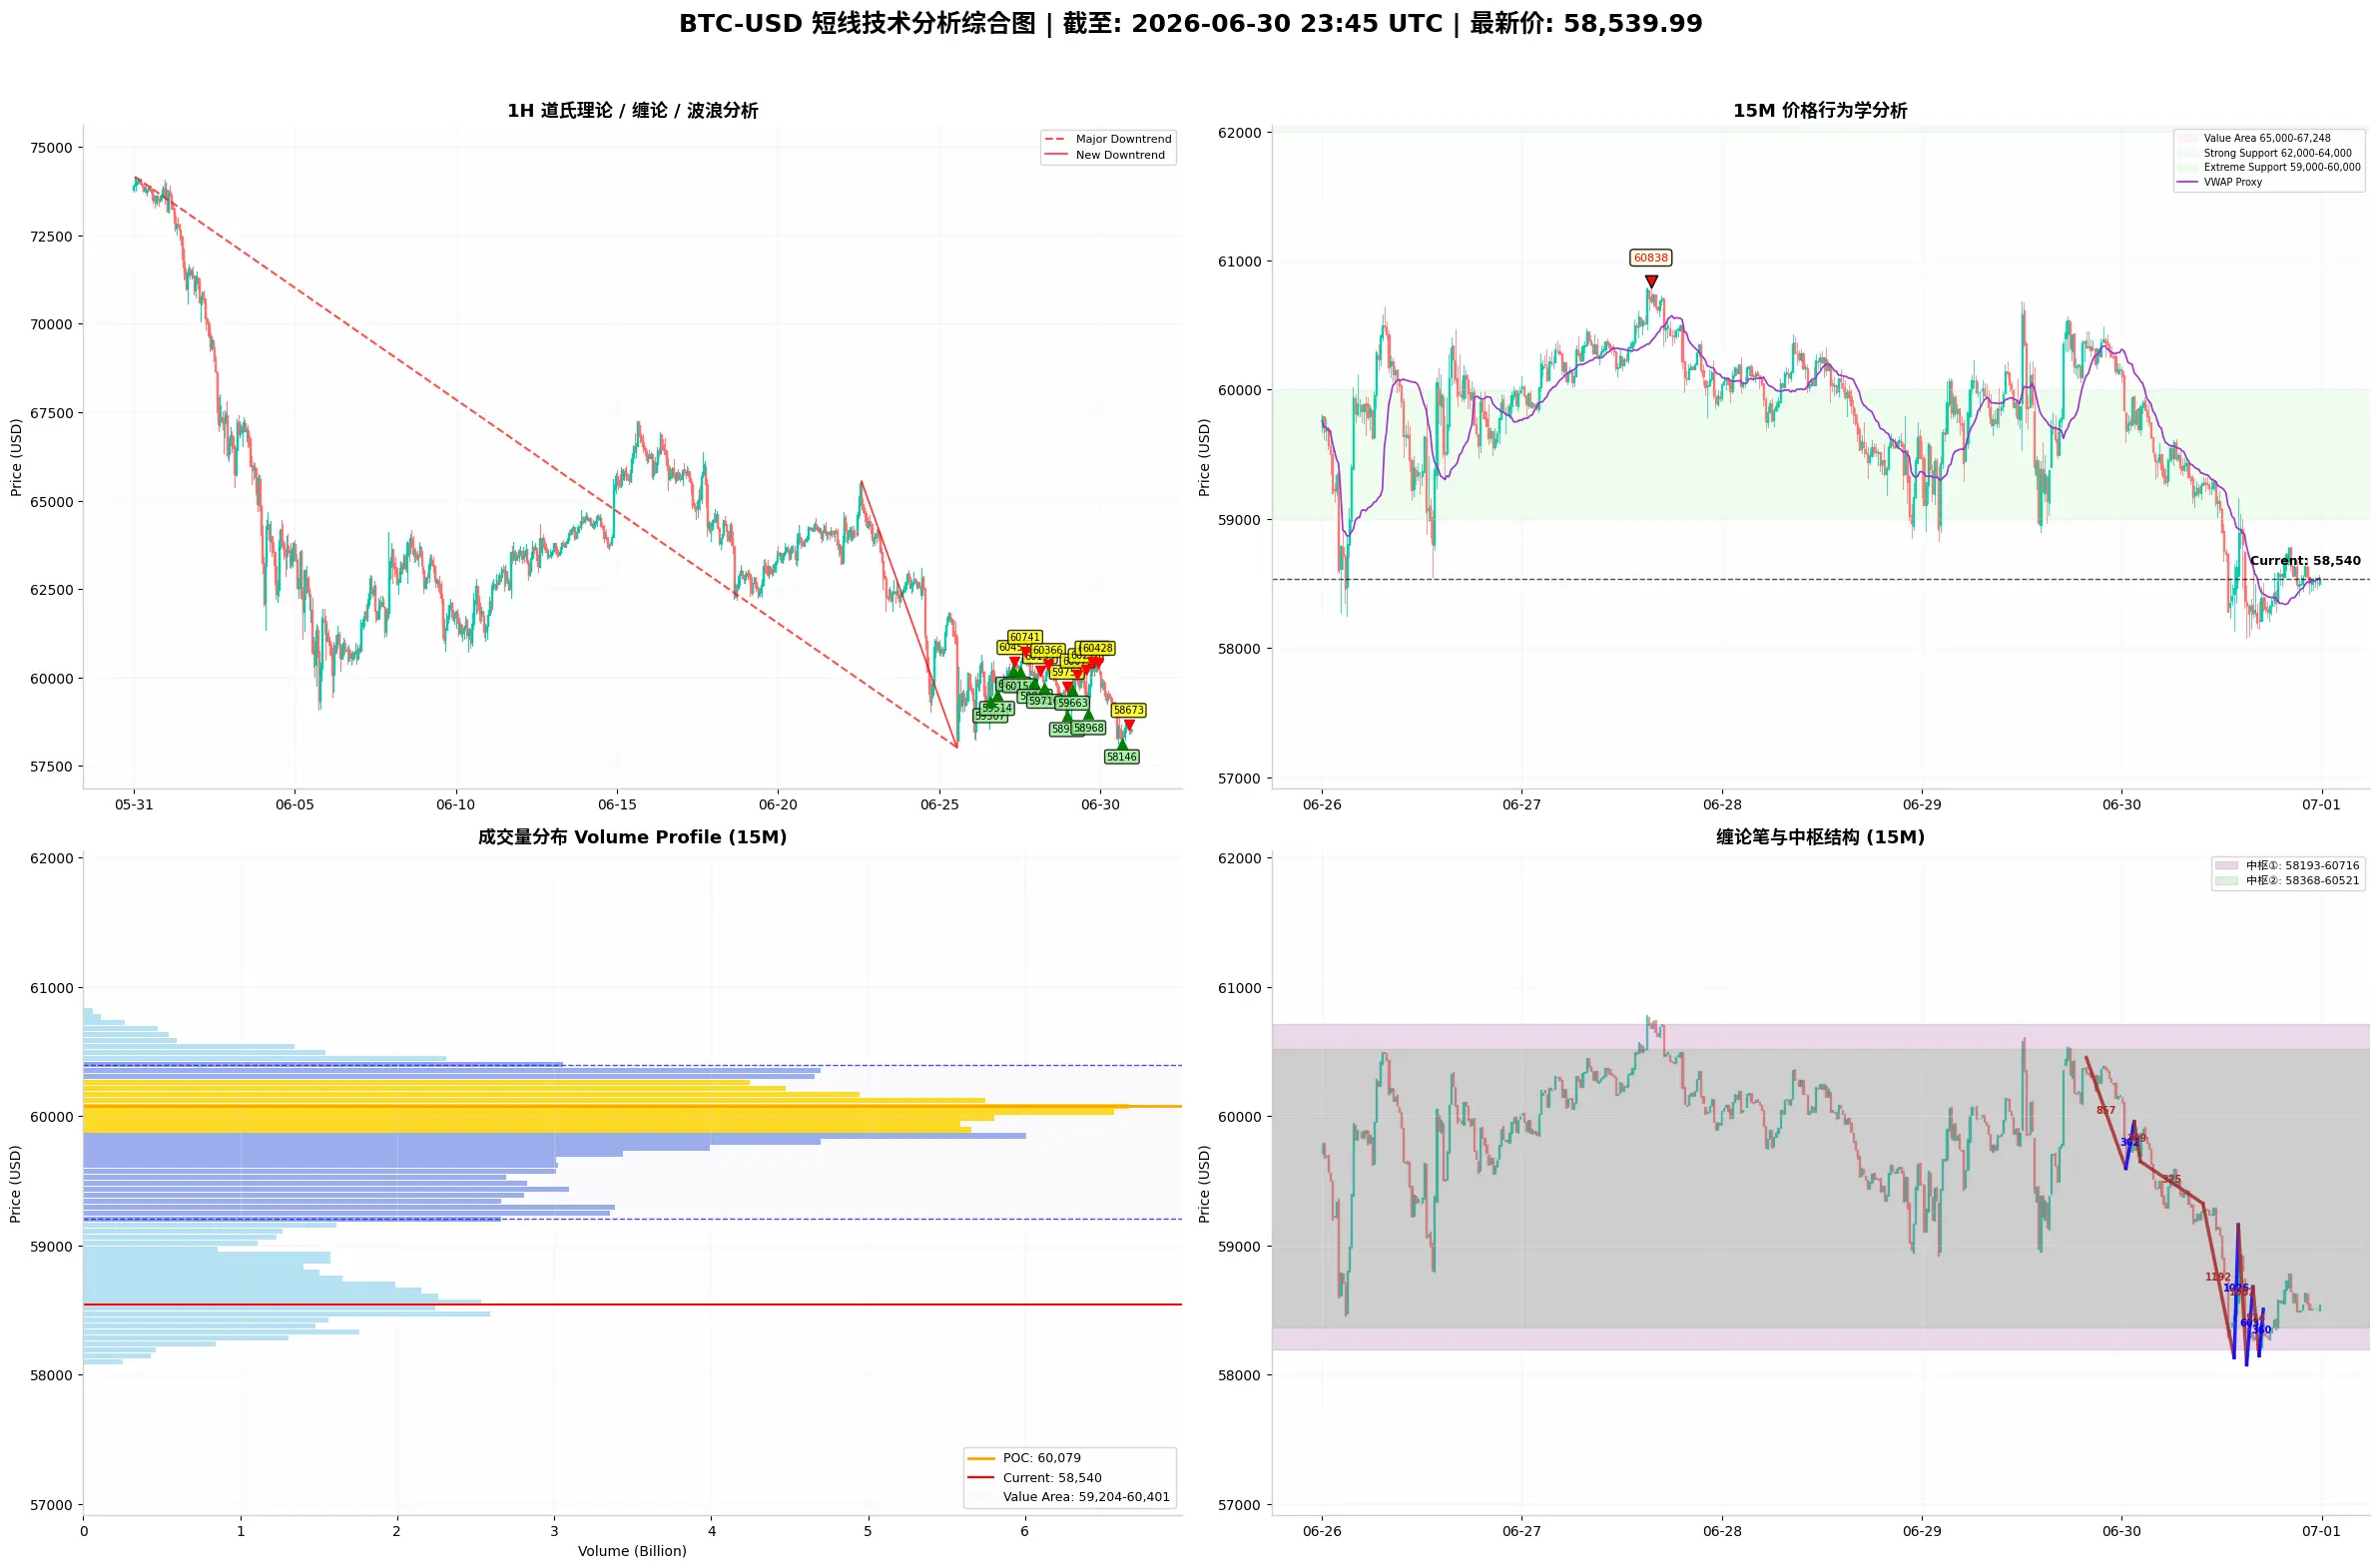
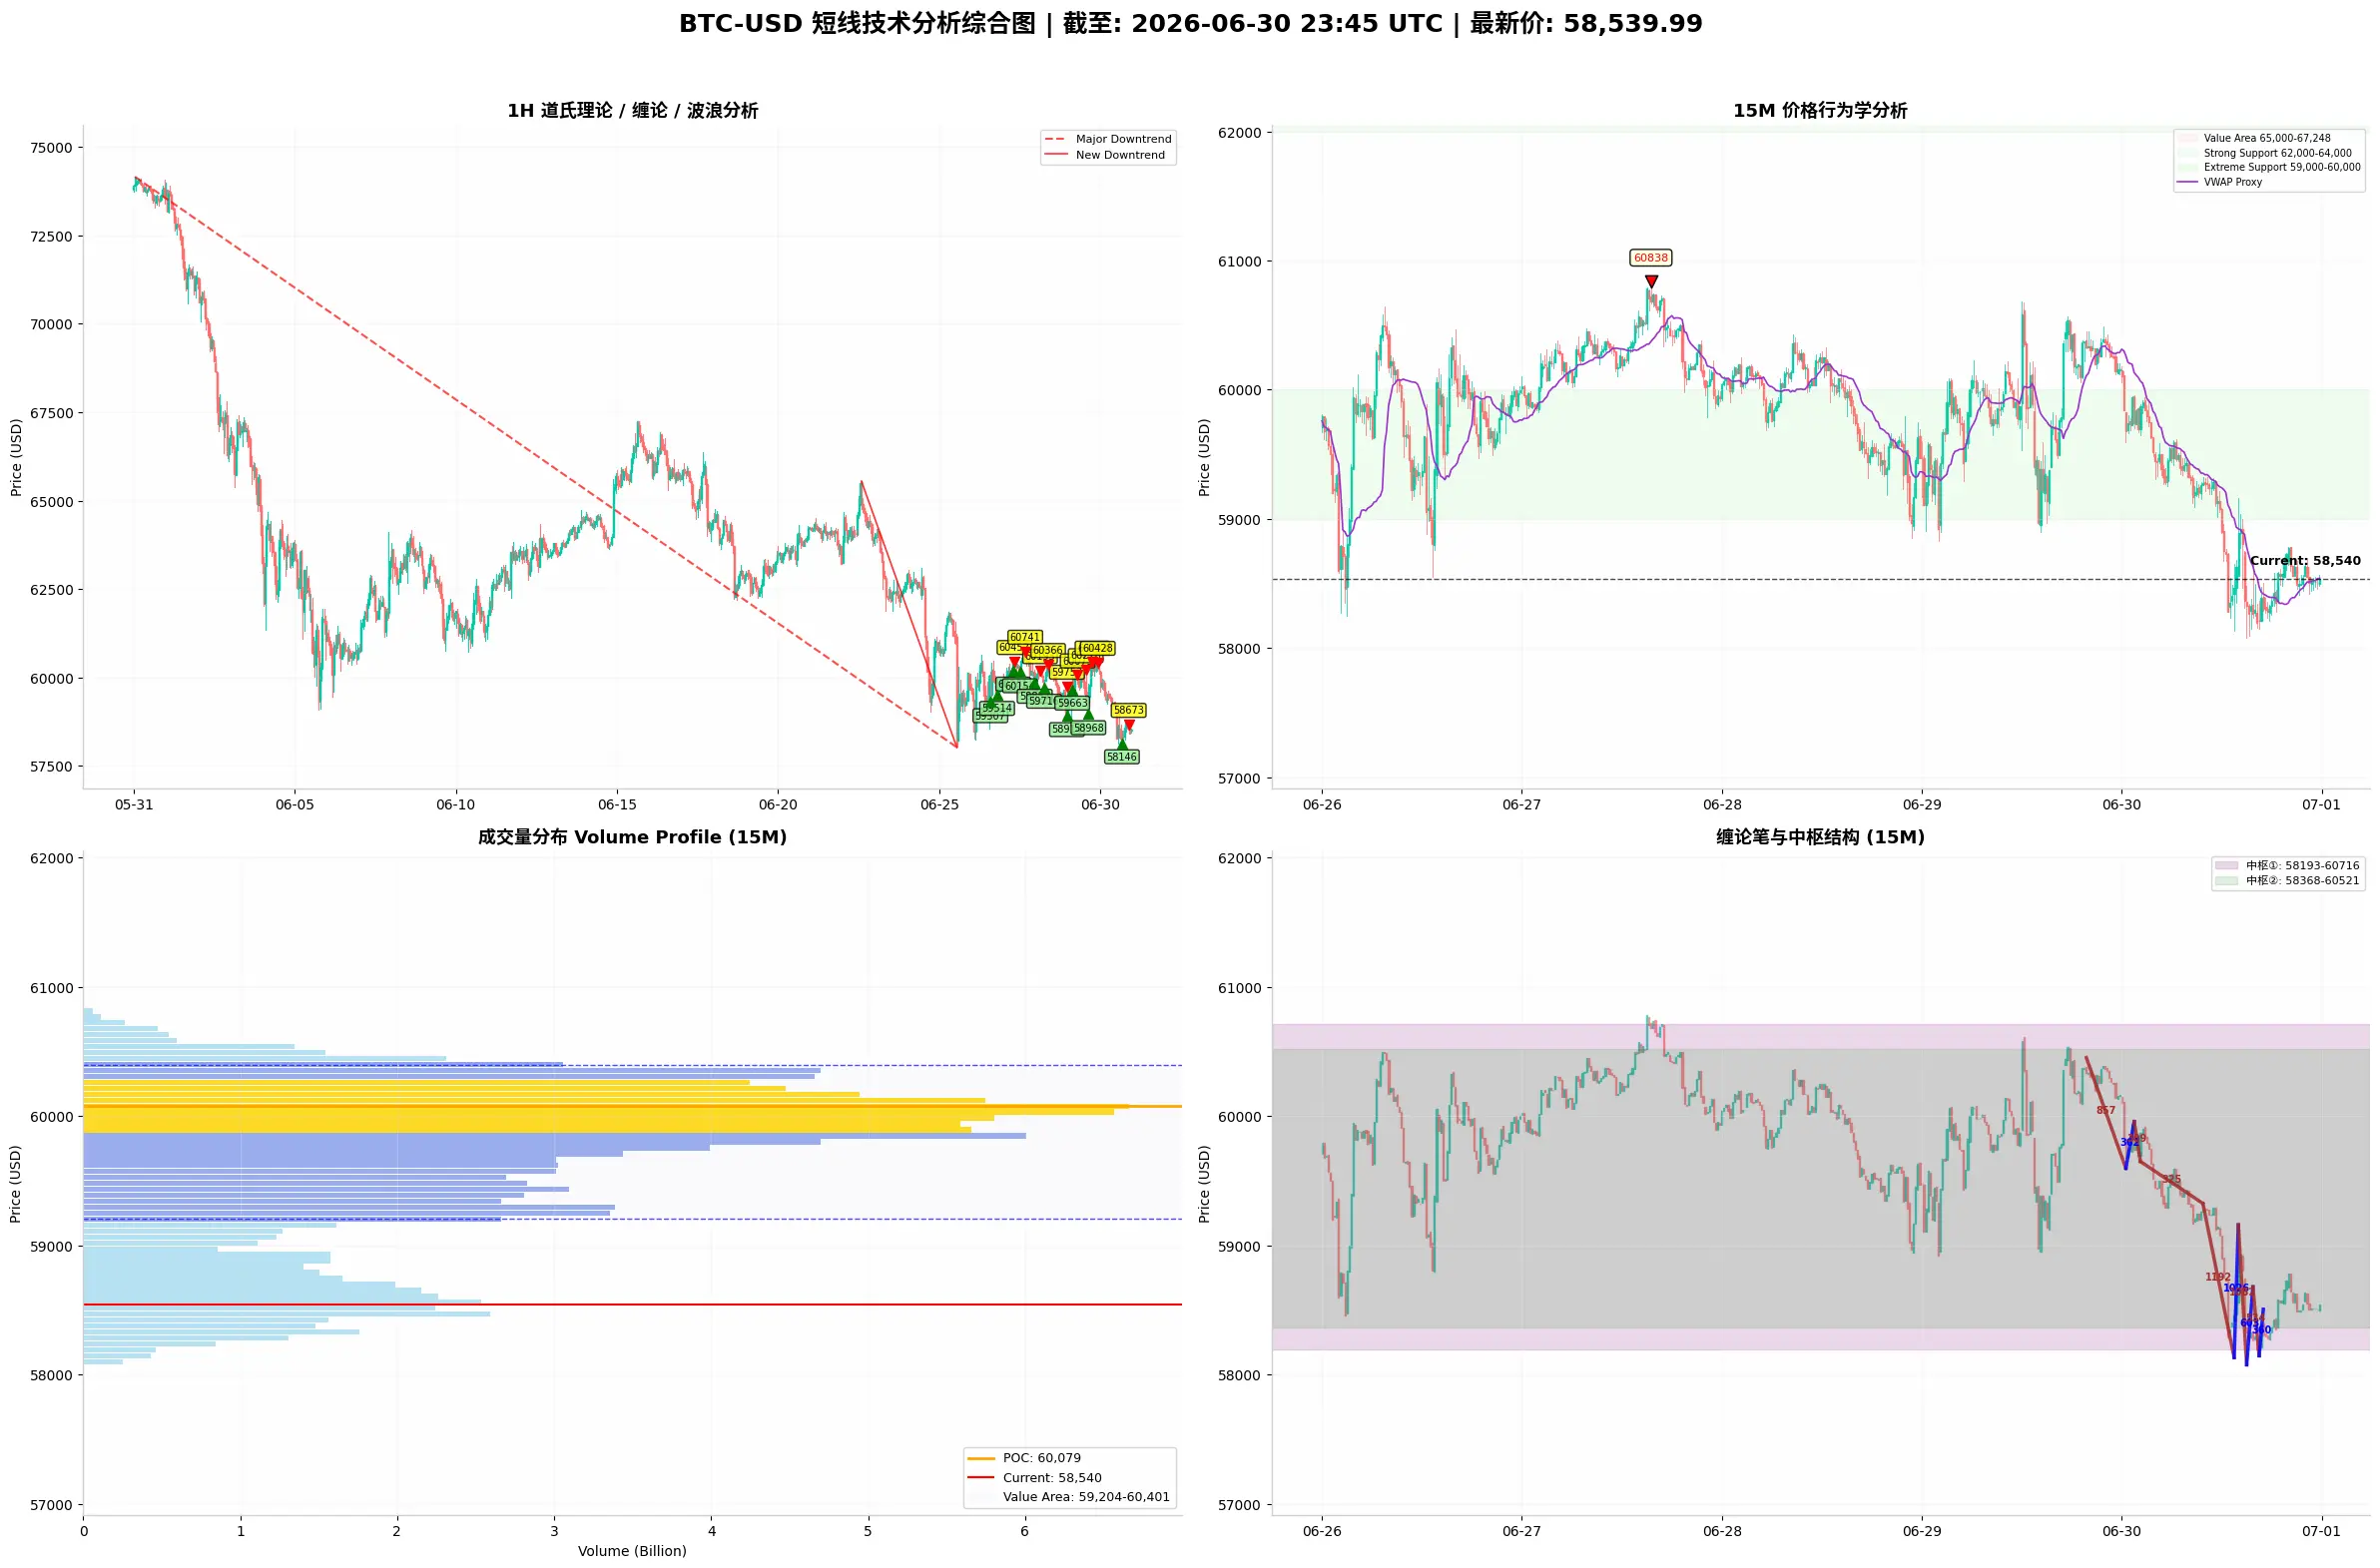
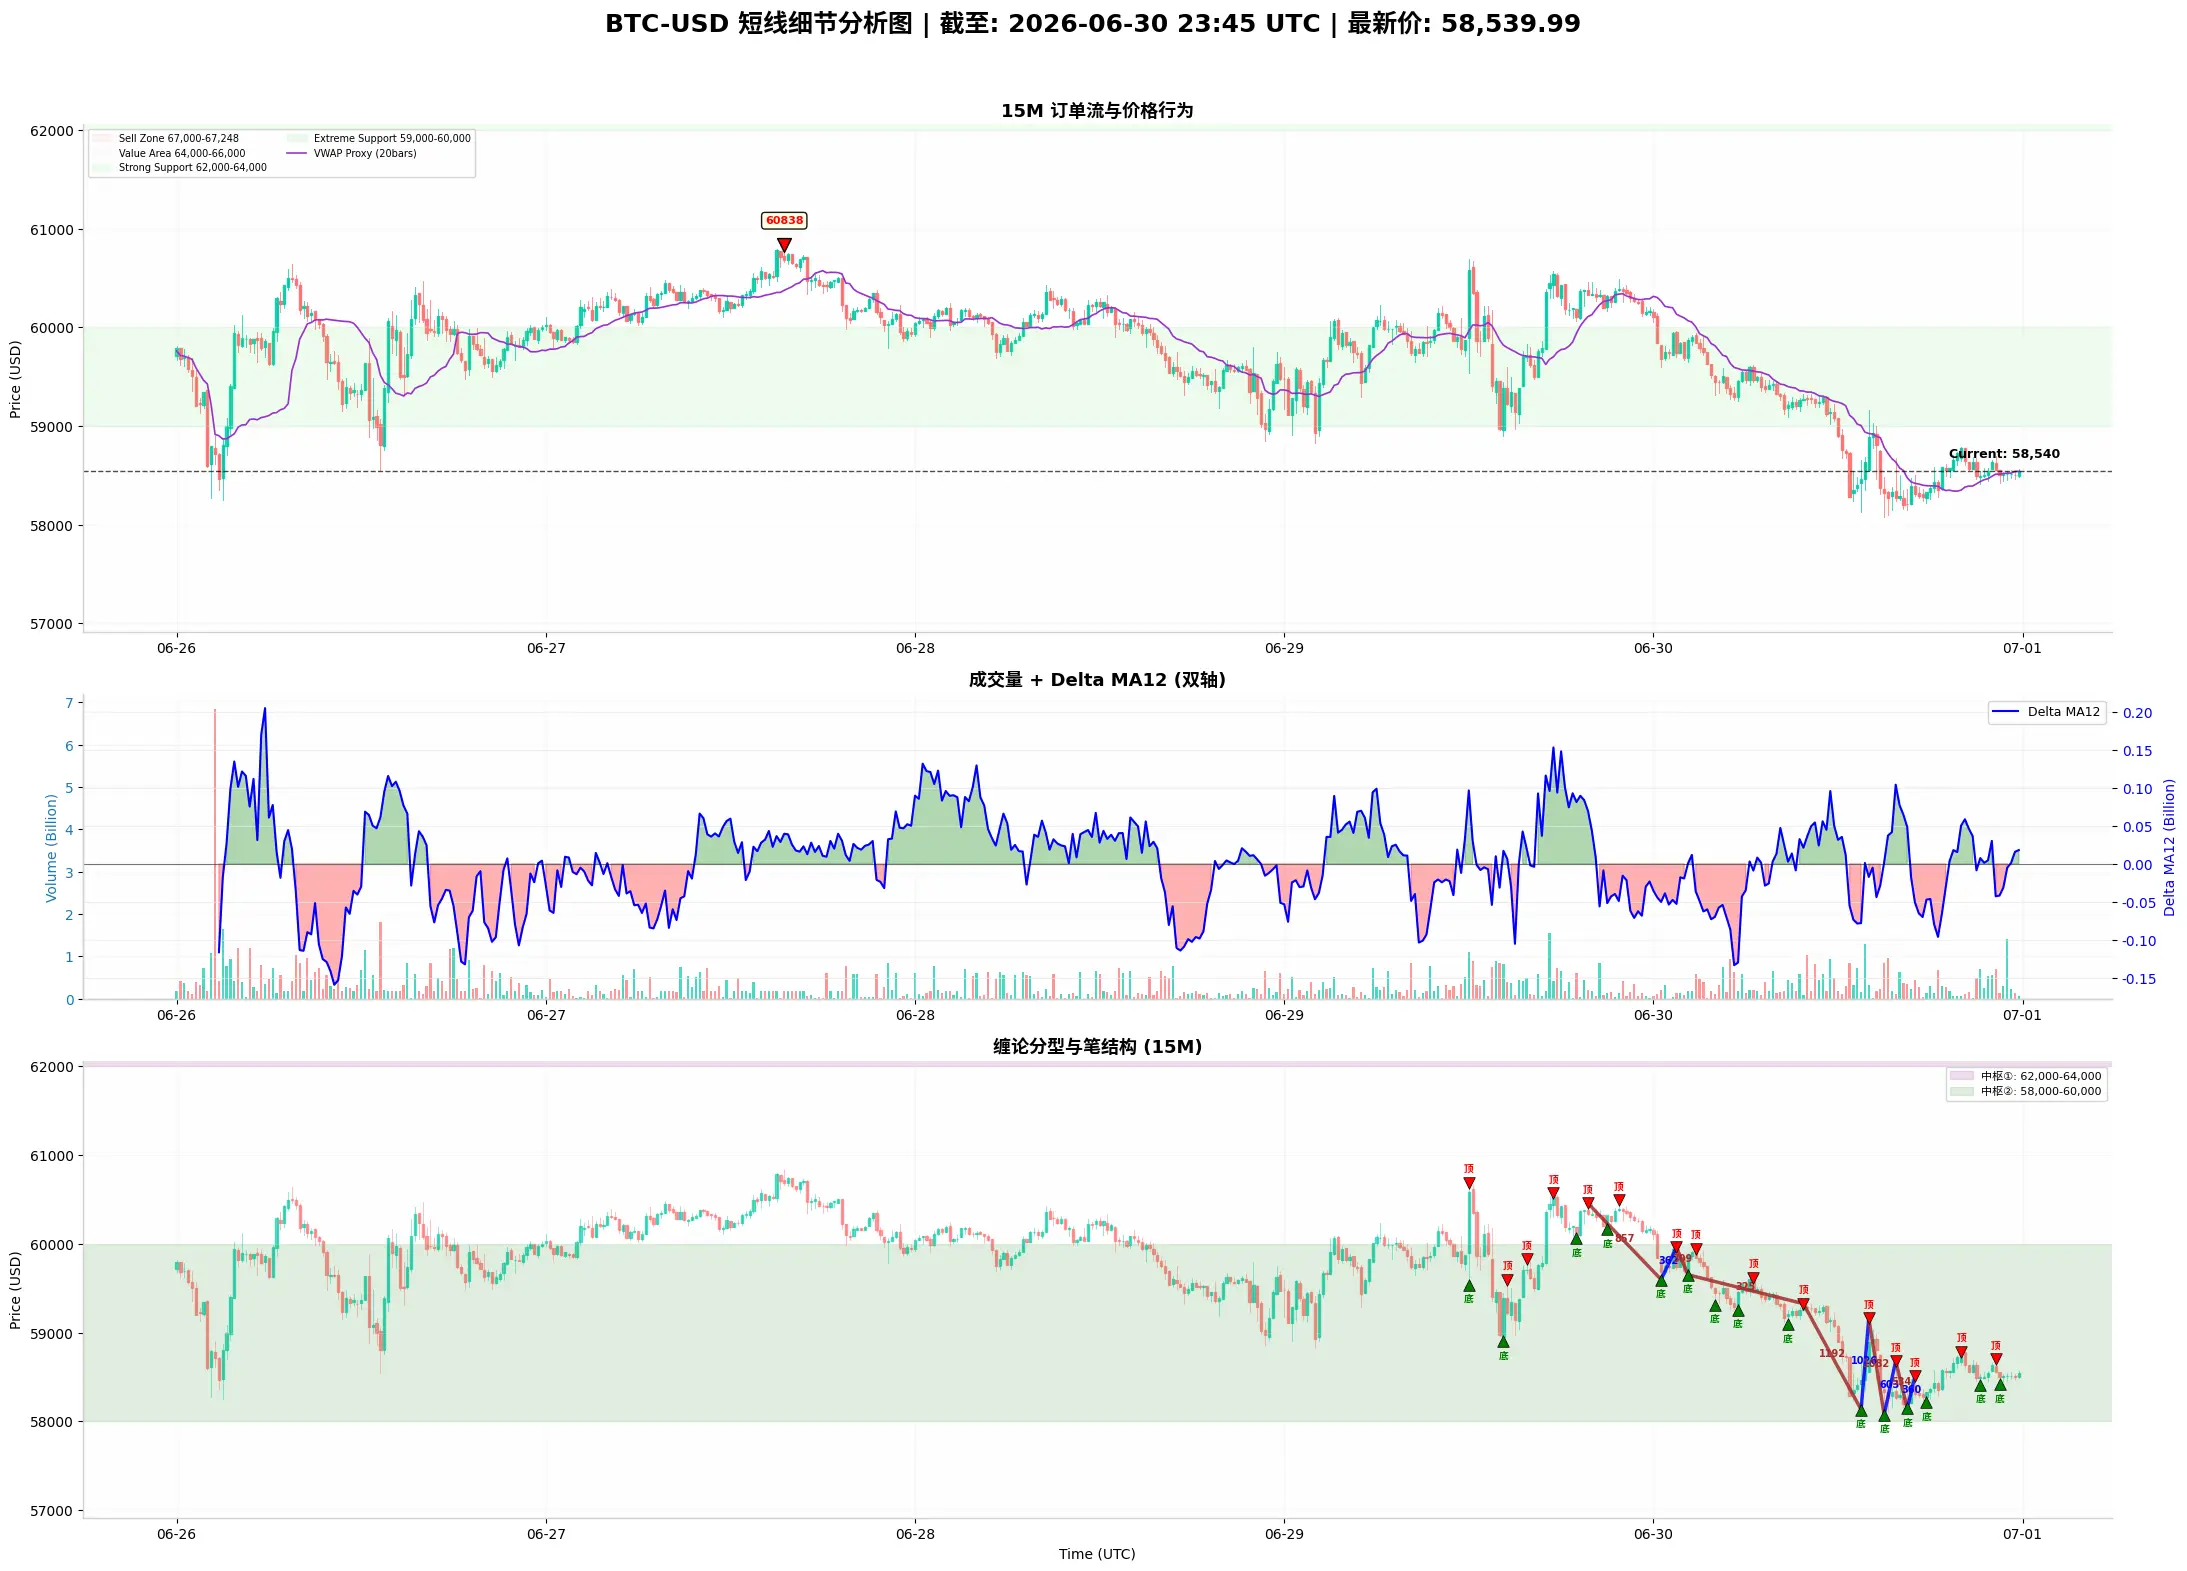
Primary Trend (1-hour level): The medium-term downtrend from the high of 74,154 on May 31 is extremely clear and steep. The price has been plunging from 74,154, and despite several bounces (a rebound to the 67,500 range on June 18 and a rebound to 60,838 on June 27), none have broken through previous highs, forming a classic bearish arrangement of "successively lower highs." After the high of 60,838 on Ju
BTC-1.56%
View Original
post-image
post-image
  • Reward
  • Comment
  • Repost
  • Share
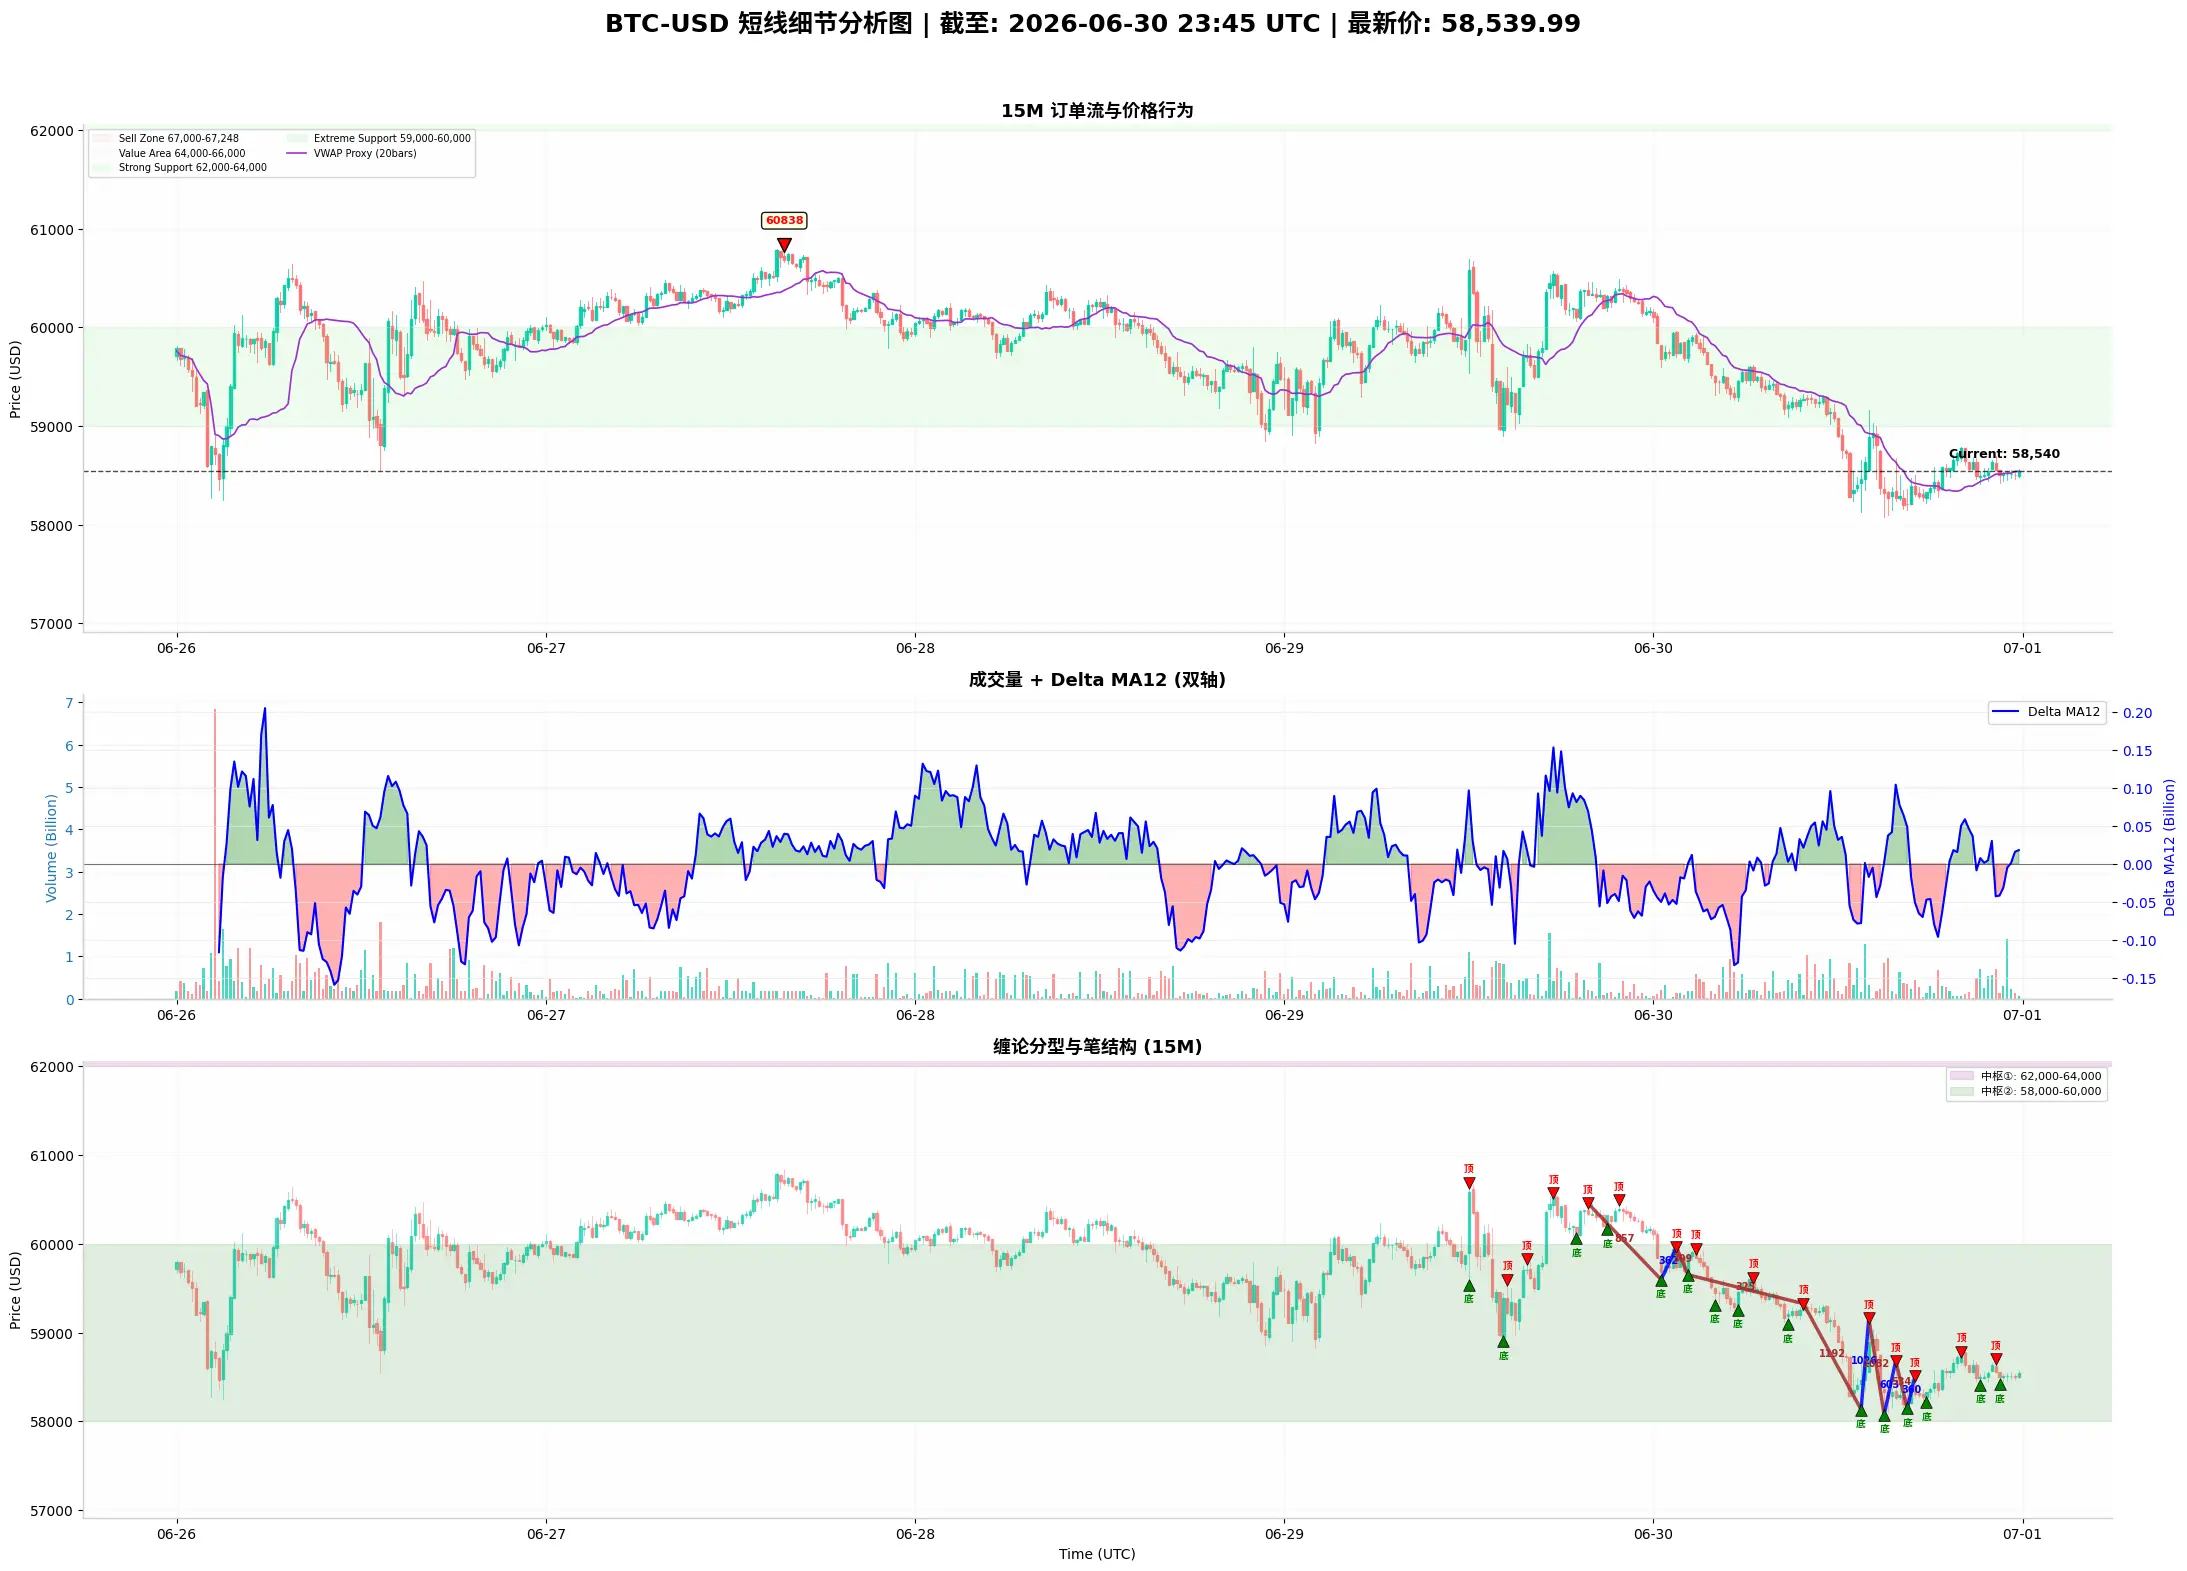
Based on Dow Theory, Chan Theory, Elliott Wave Theory, Volume-Price Relationship, Order Flow, and Price Action, a brief analysis of BTC short-term trend (strategy suggestions)
$BTC Comprehensive Analysis
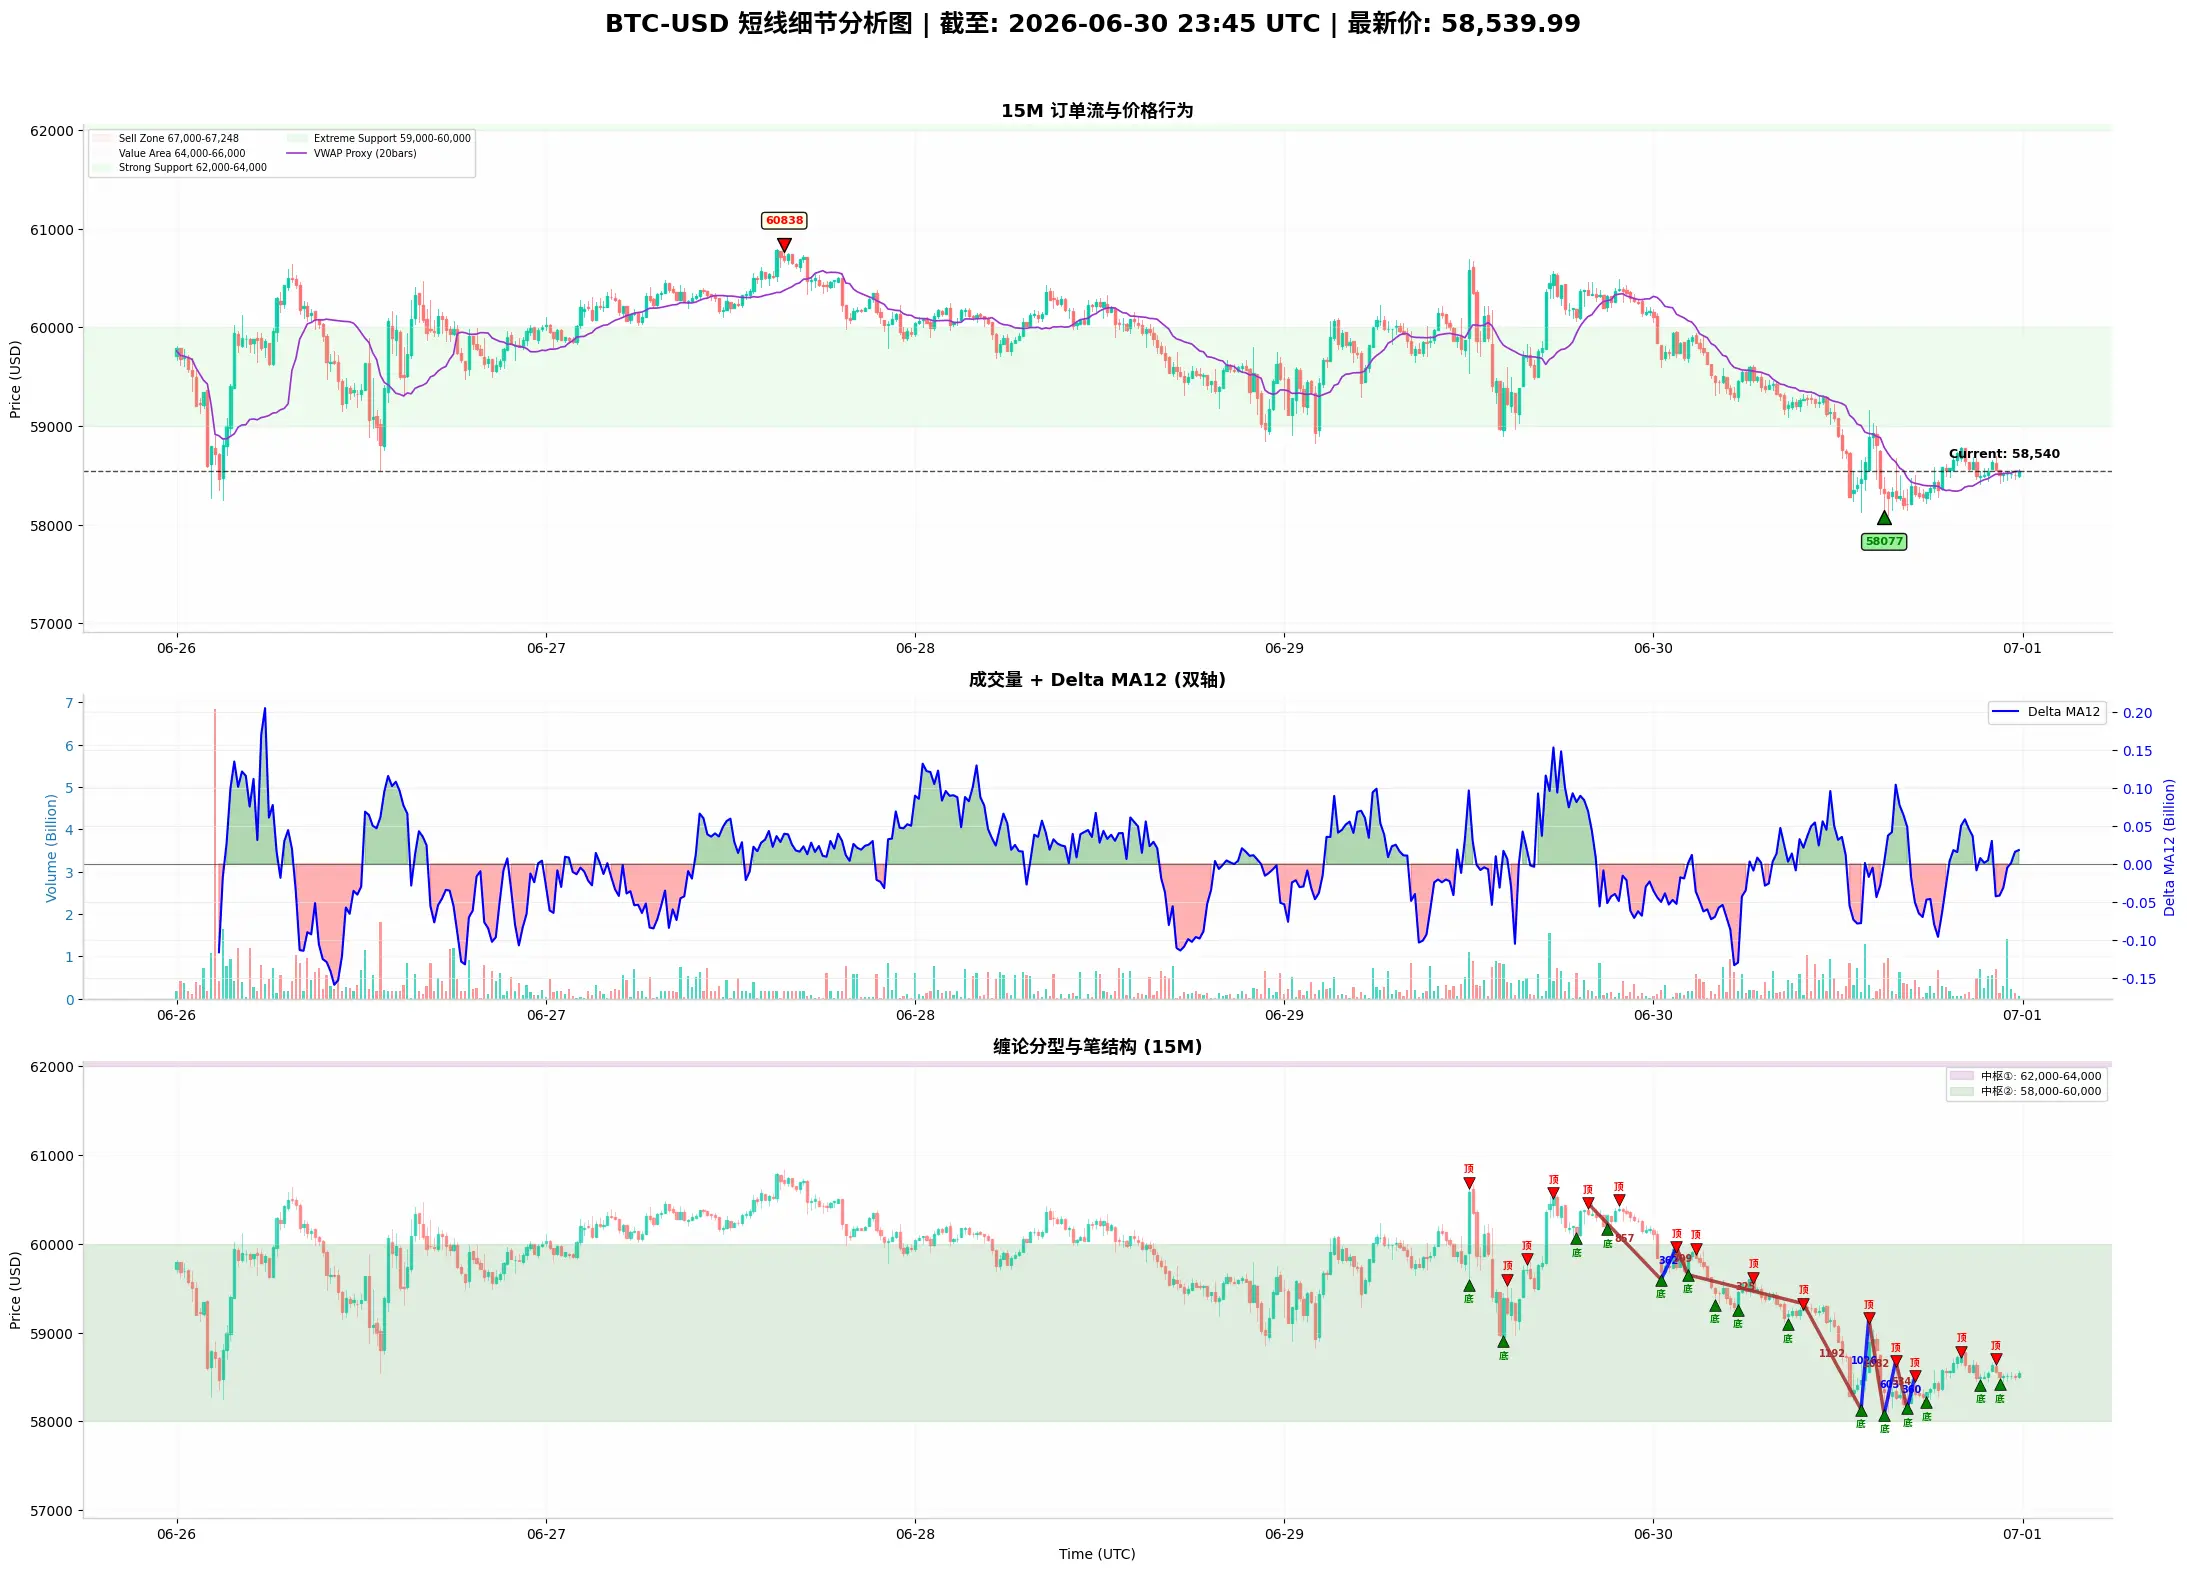
Dow Theory indicates that the main trend remains a deep decline with downward momentum not yet fully exhausted, while the short-term trend has entered an accelerated decline, with key levels at 59,000 (upper) and 58,000 (lower).
Chan Theory shows that the downward stroke is extremely strong (-2,761) and the upward stroke is very weak (+603), currently in the stage of testing lower level
BTC-1.56%
View Original
post-image
post-image
  • Reward
  • Comment
  • Repost
  • Share
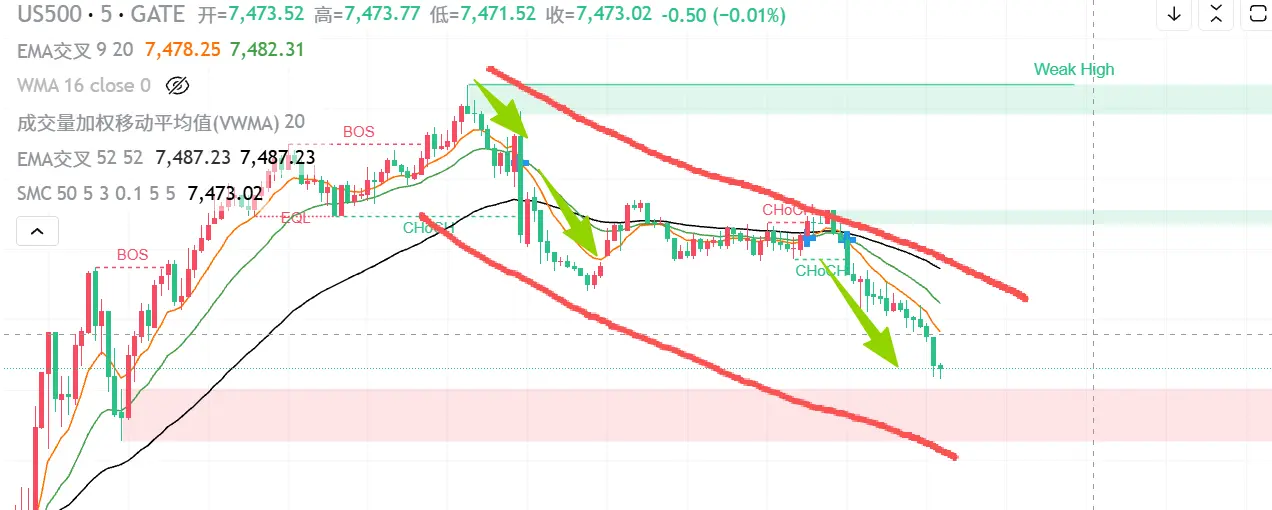
us500 short-term bearish
Analysis from the perspective of price action
During last night's U.S. stock market opening, there was a strong rally followed by a late-session sell-off
The early session continued the decline, currently forming a descending channel. Consider shorting at the top of the channel
Stop loss placed at the previous high
$US500
US500-0.86%
View Original
post-image
  • Reward
  • 3
  • Repost
  • Share
Analyzing BTC Short-Term Trends Based on Dow Theory, Chan Theory, Elliott Wave Theory, Volume-Price Relationship, Order Flow, and Price Action
$BTC
I. Dow Theory
Major Trend (1-hour level): The medium-term downtrend since the high of 74,154 on May 31 is extremely clear and steep. The price has crashed from 74,154, and although there have been several bounces (rebound to the 67,500 range on June 18, rebound to 60,838 on June 27), none have broken through the previous highs, forming a typical bearish pattern of "lower highs." After the high of 60,838 on June 27, the bears struck again, causin
BTC-1.56%
View Original
post-image
post-image
  • Reward
  • Comment
  • Repost
  • Share
From Dow Theory, Chan Theory, Elliott Wave Theory, Price-Volume Relationship, Order Flow, and Price Action, a Brief Analysis of BTC Short-Term Trend (Strategy Suggestions)
$BTC Comprehensive Assessment
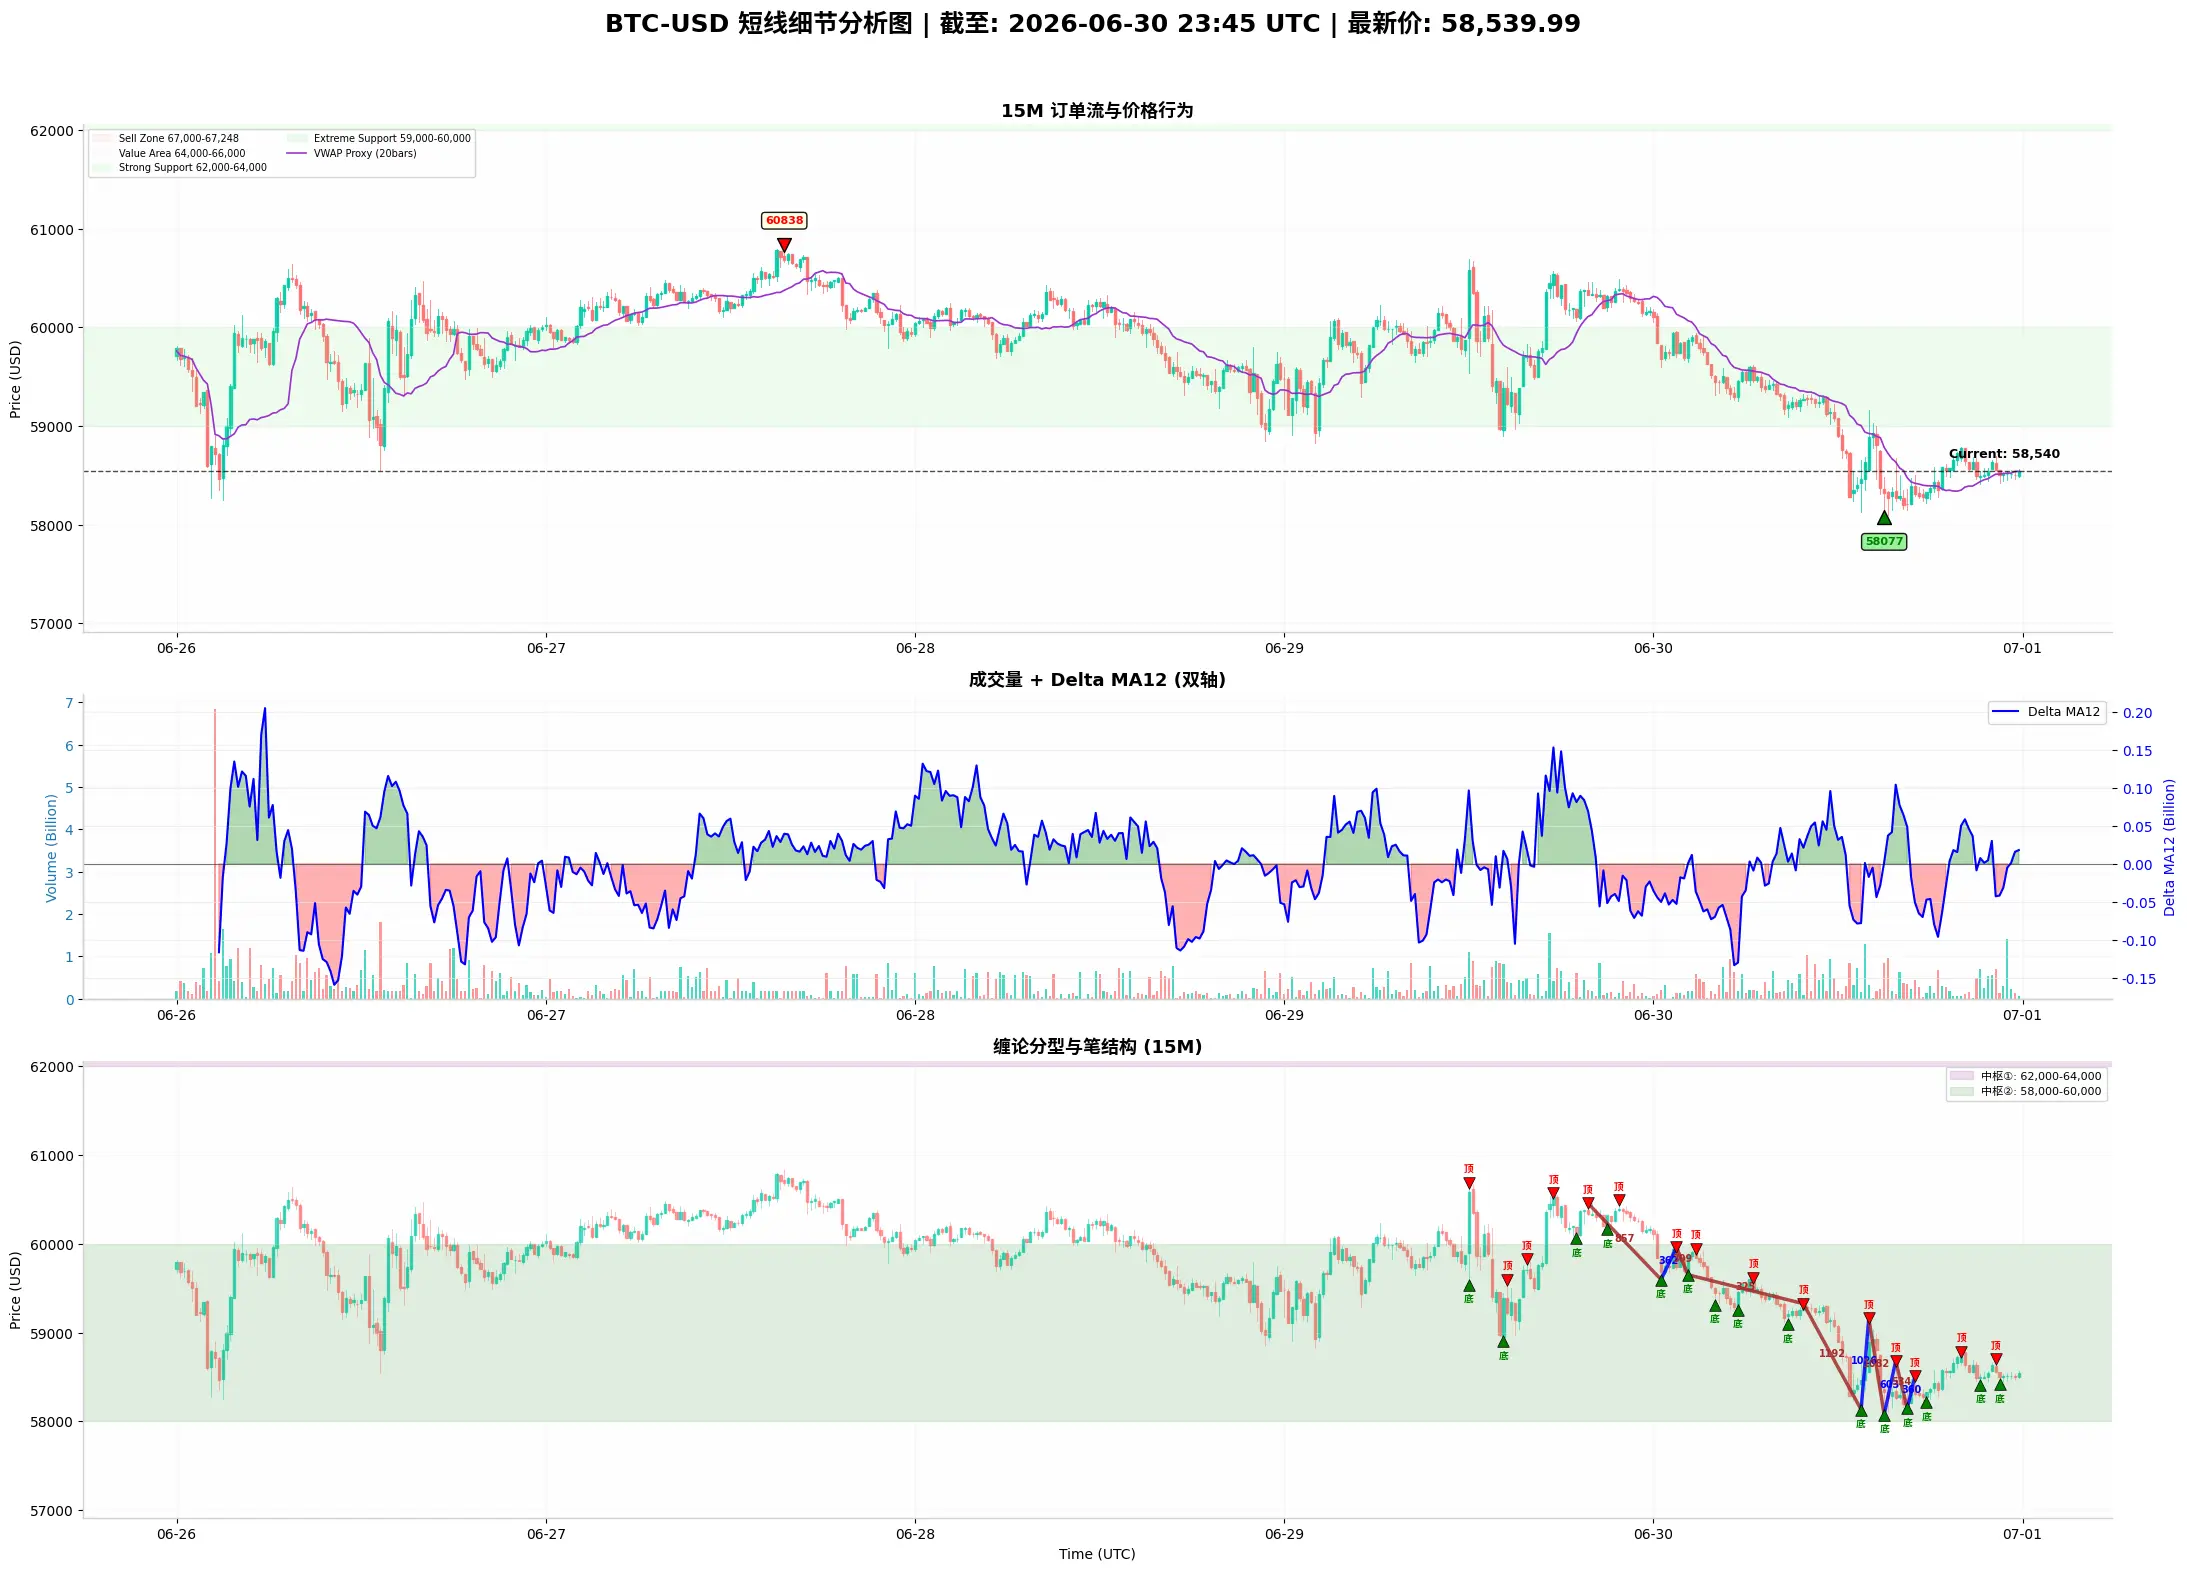
Dow Theory indicates that the primary trend remains a deep decline with downside momentum not yet fully exhausted, while the short-term trend has entered an accelerated decline, with key levels at 59,000 (upper) and 58,000 (lower).
Chan Theory shows that the downward stroke has extreme strength (-2,761) and the upward stroke is extremely weak (+603), currently in a downward probing phase
BTC-1.56%
View Original
post-image
post-image
  • Reward
  • Comment
  • Repost
  • Share
From Dow Theory, Chan Theory, Elliott Wave Theory, Volume-Price Relationship, Order Flow, and Price Action, a Brief Analysis of BTC Short-Term Trends
$BTC I. Dow Theory
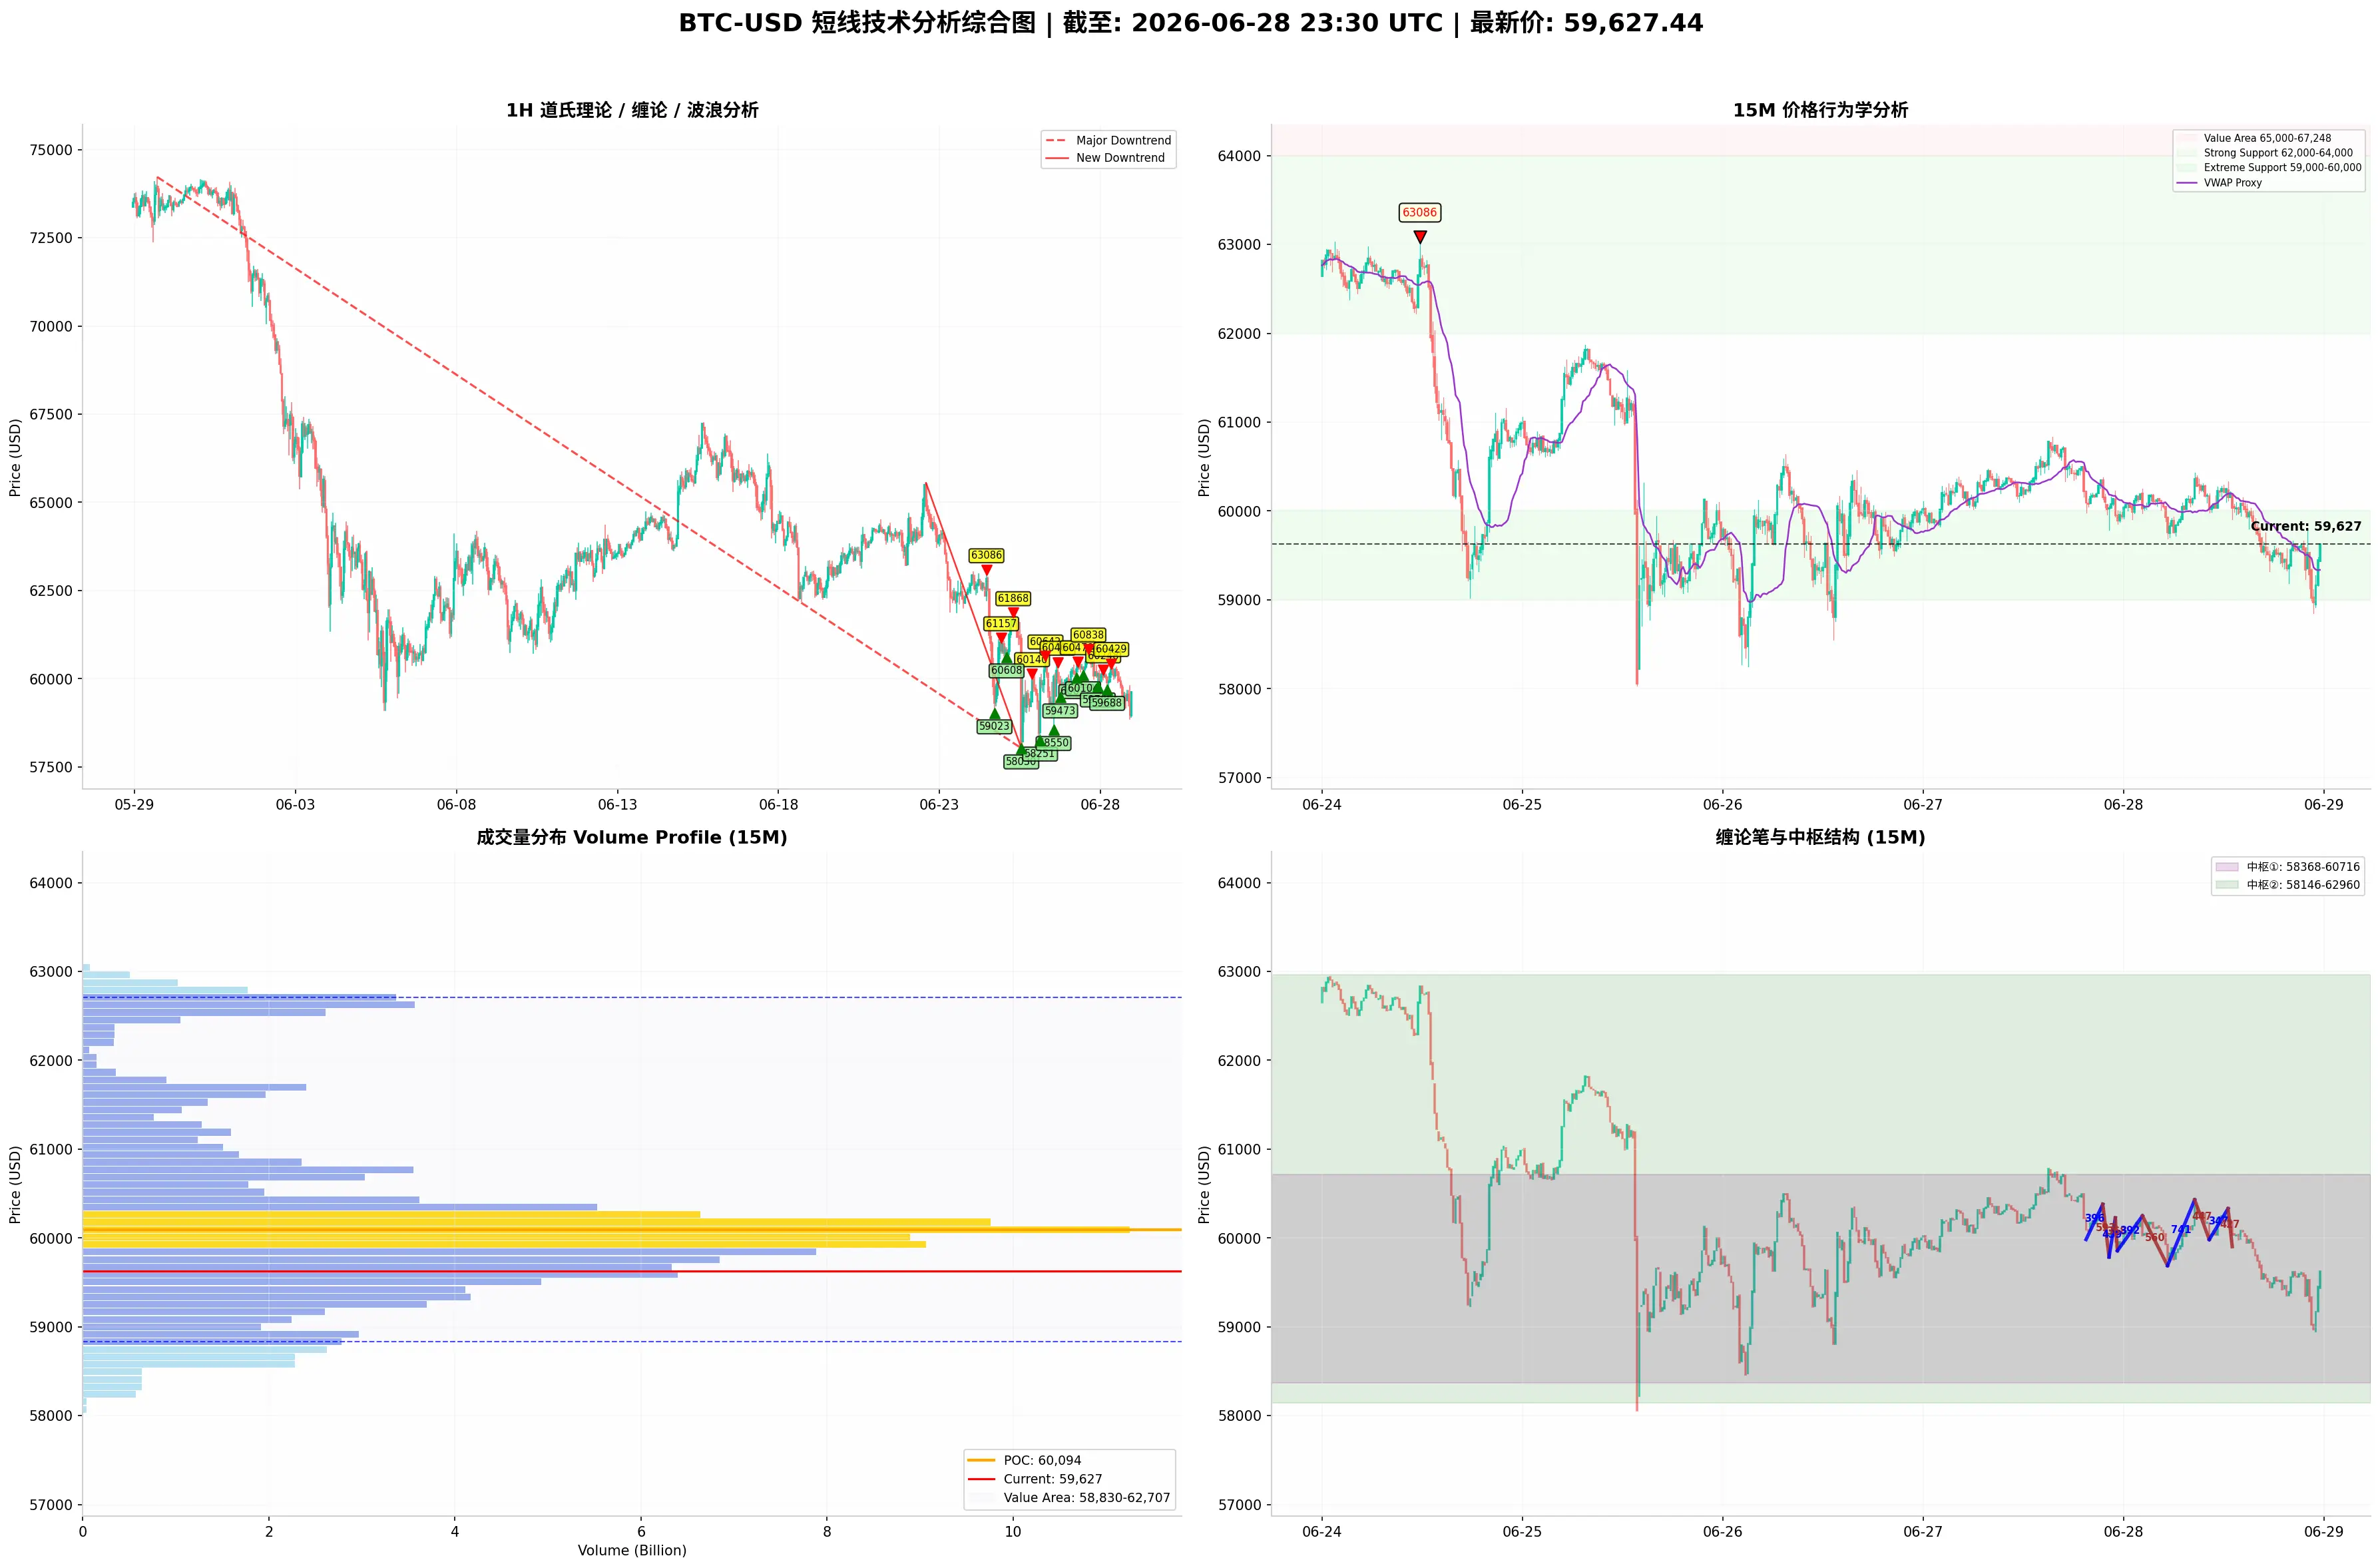
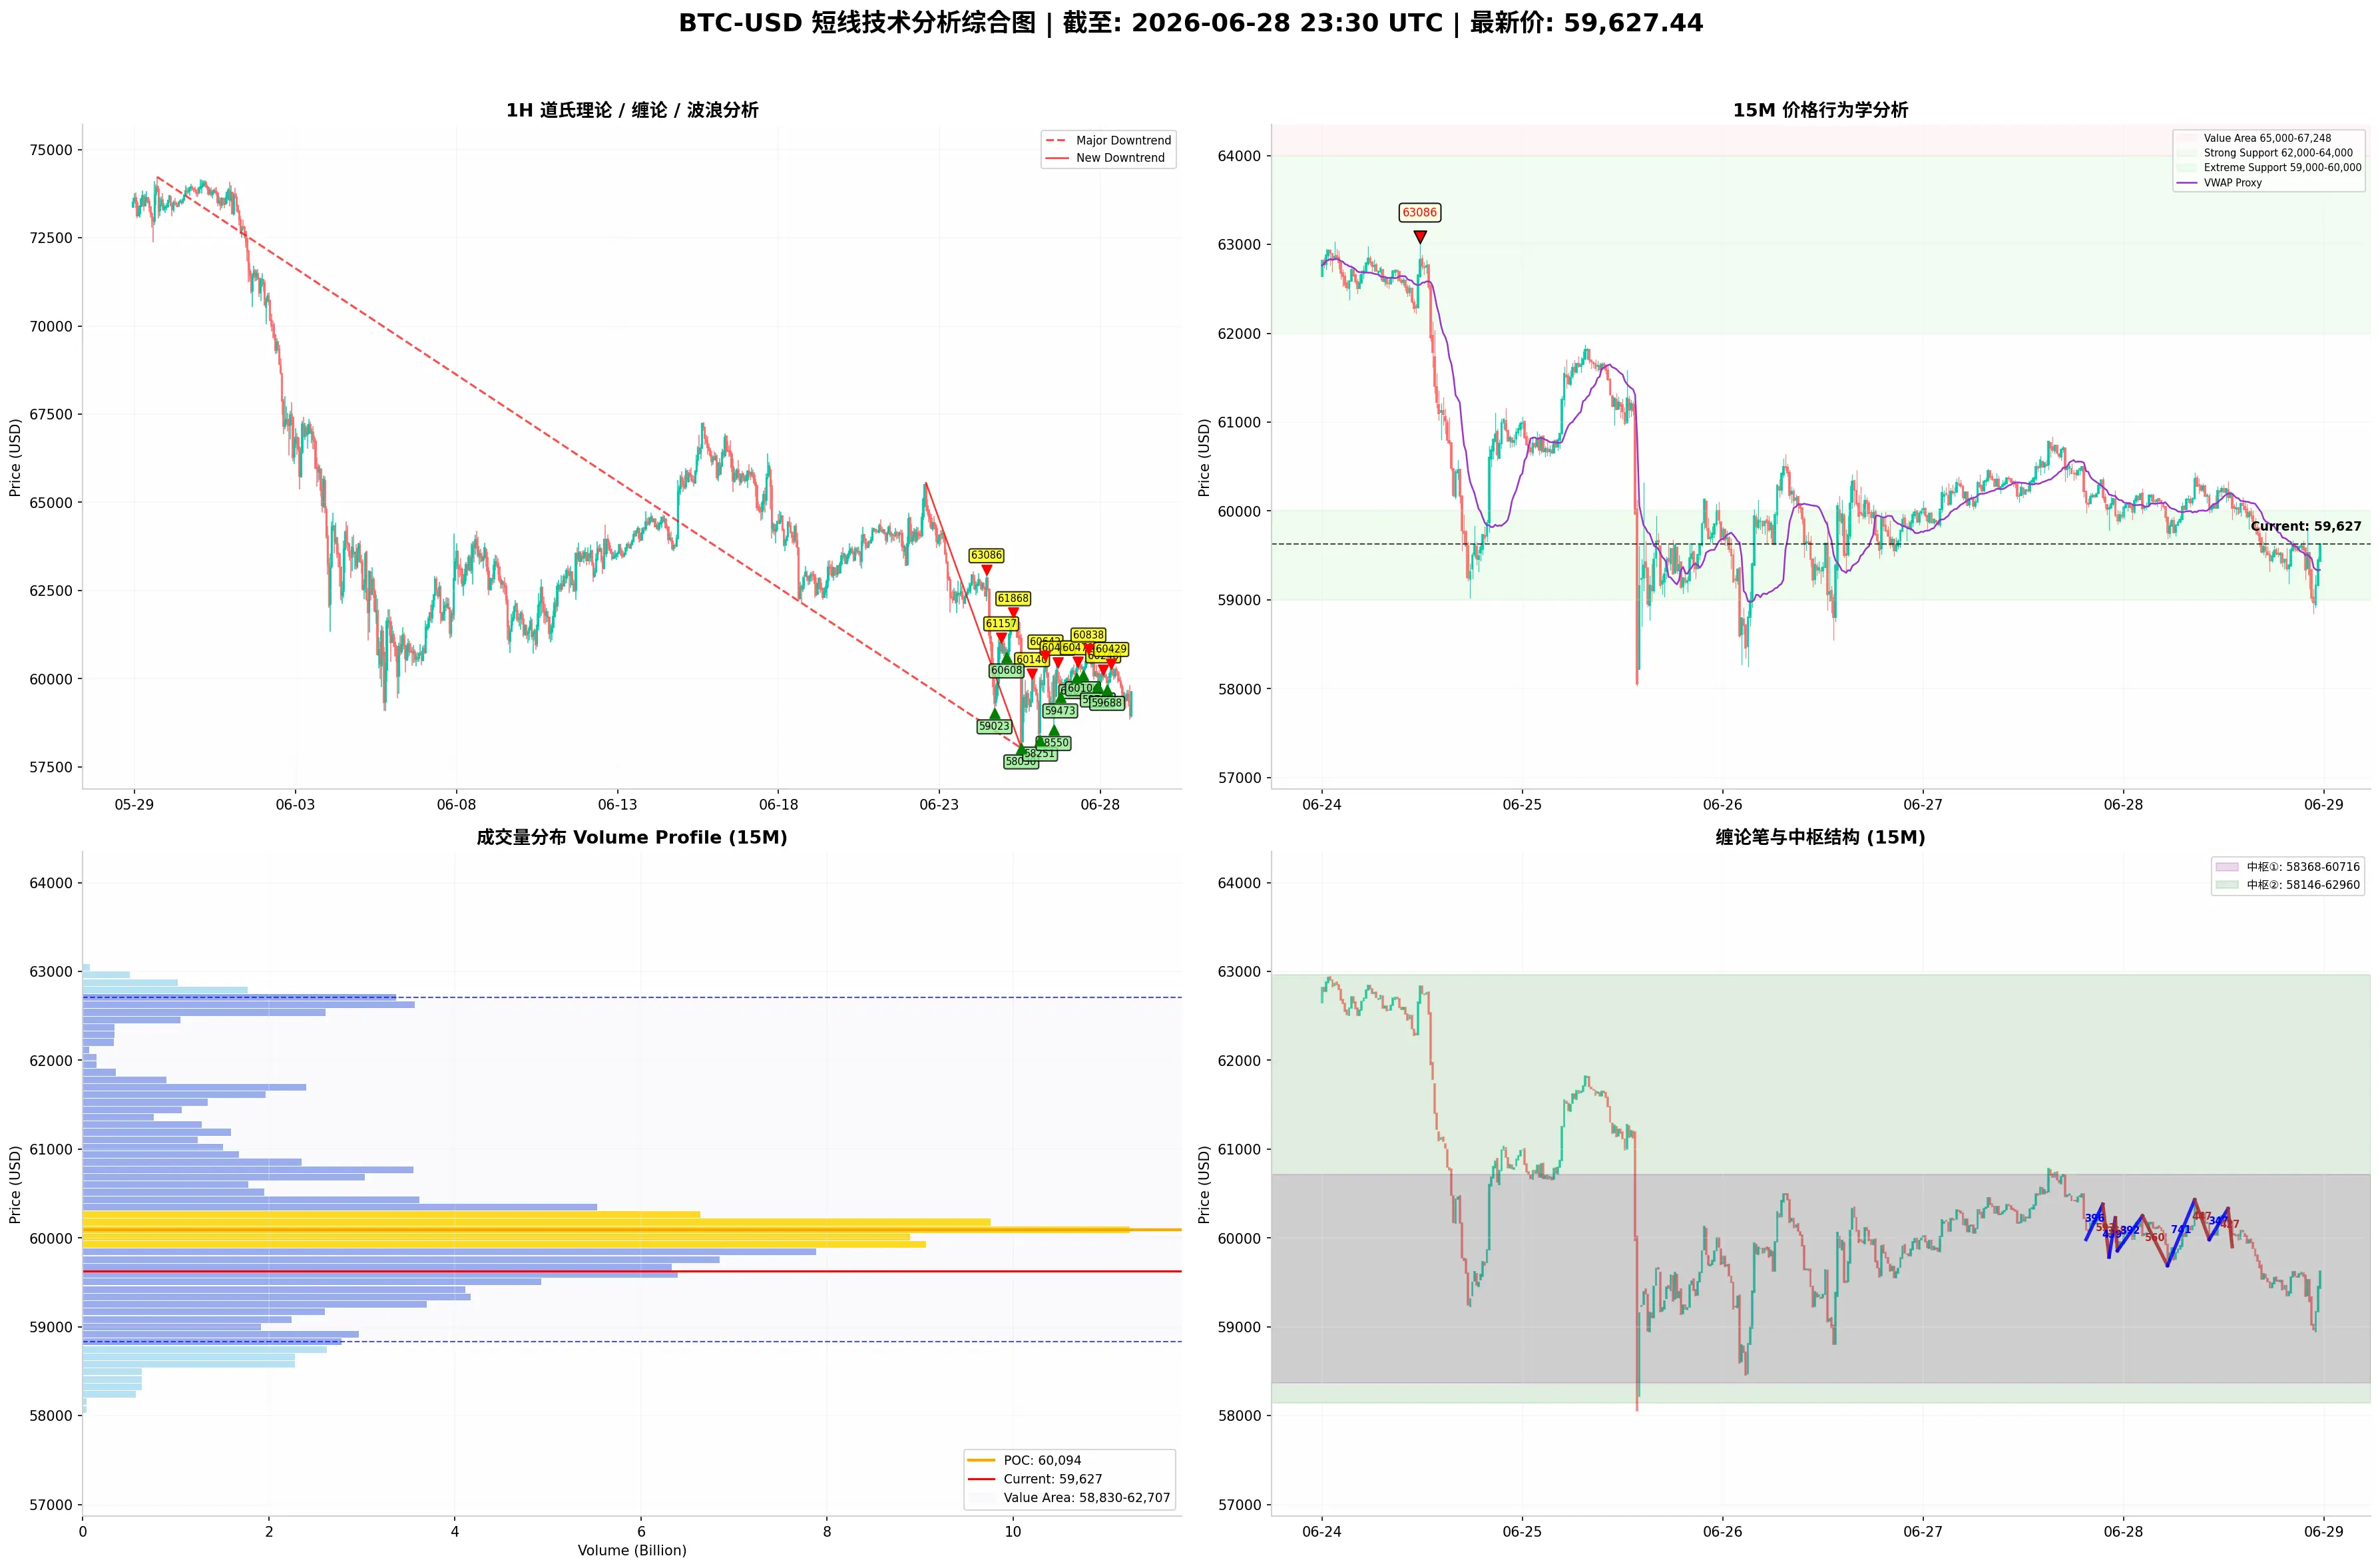
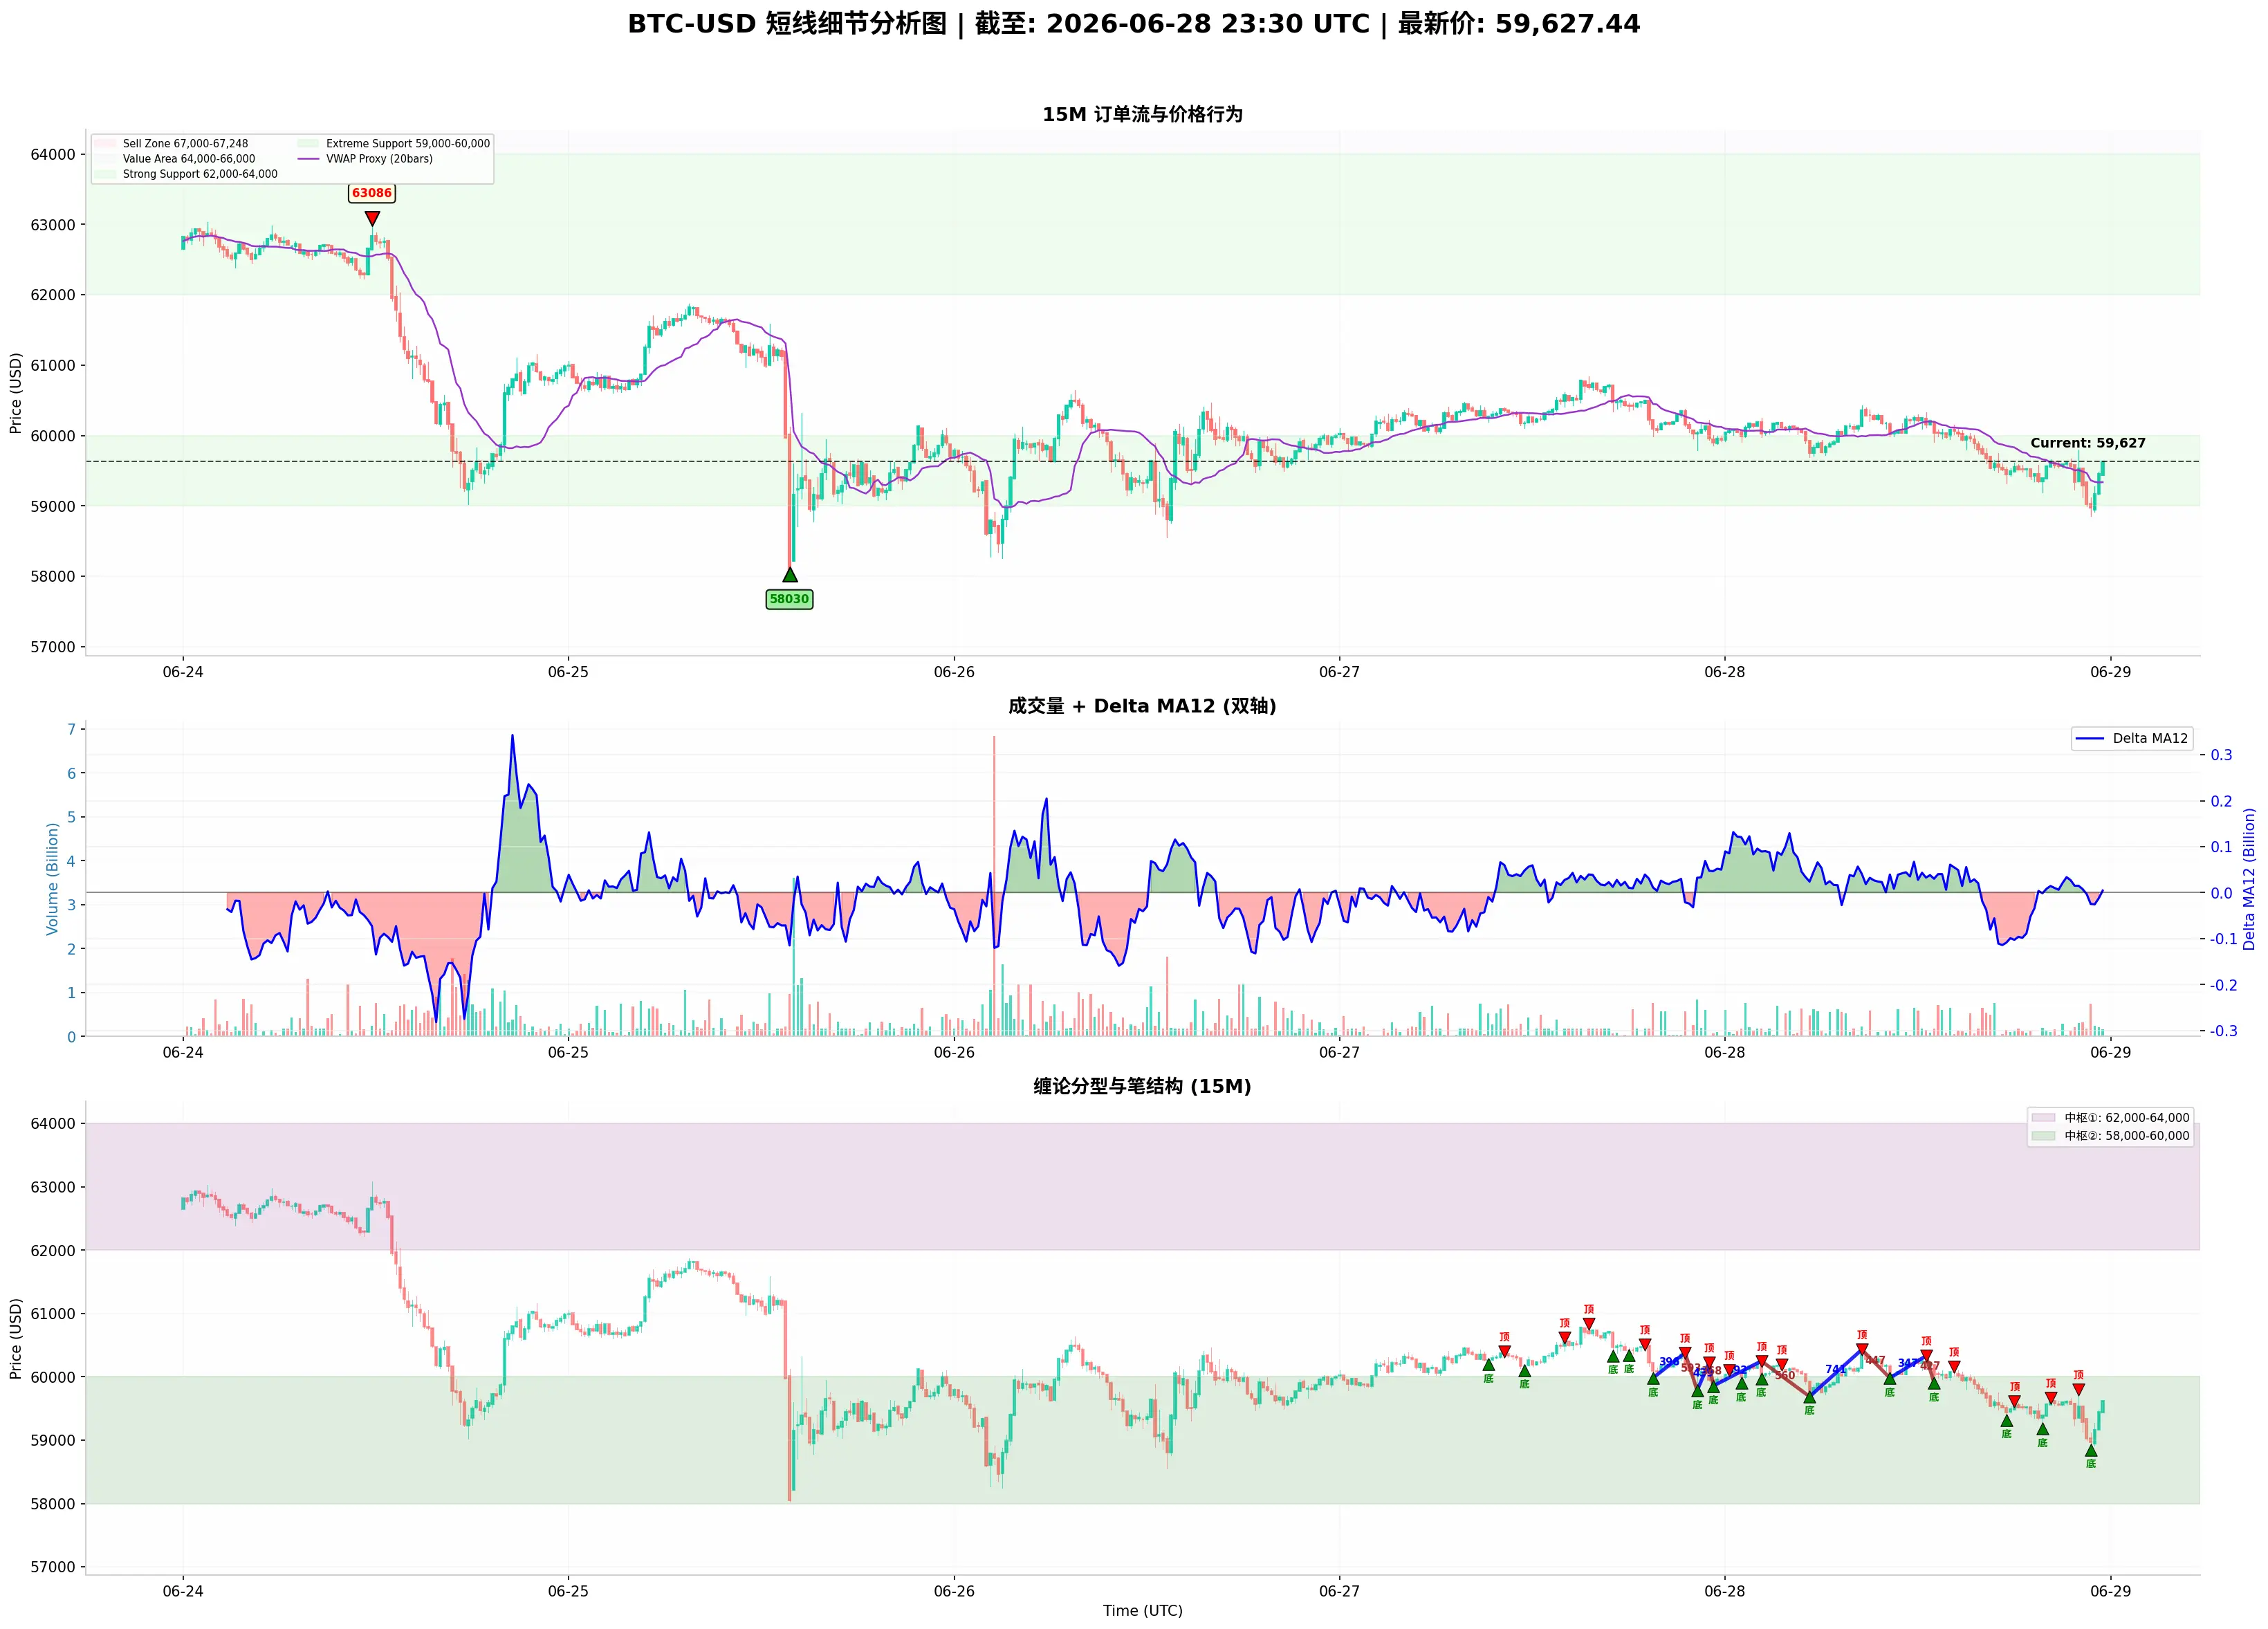
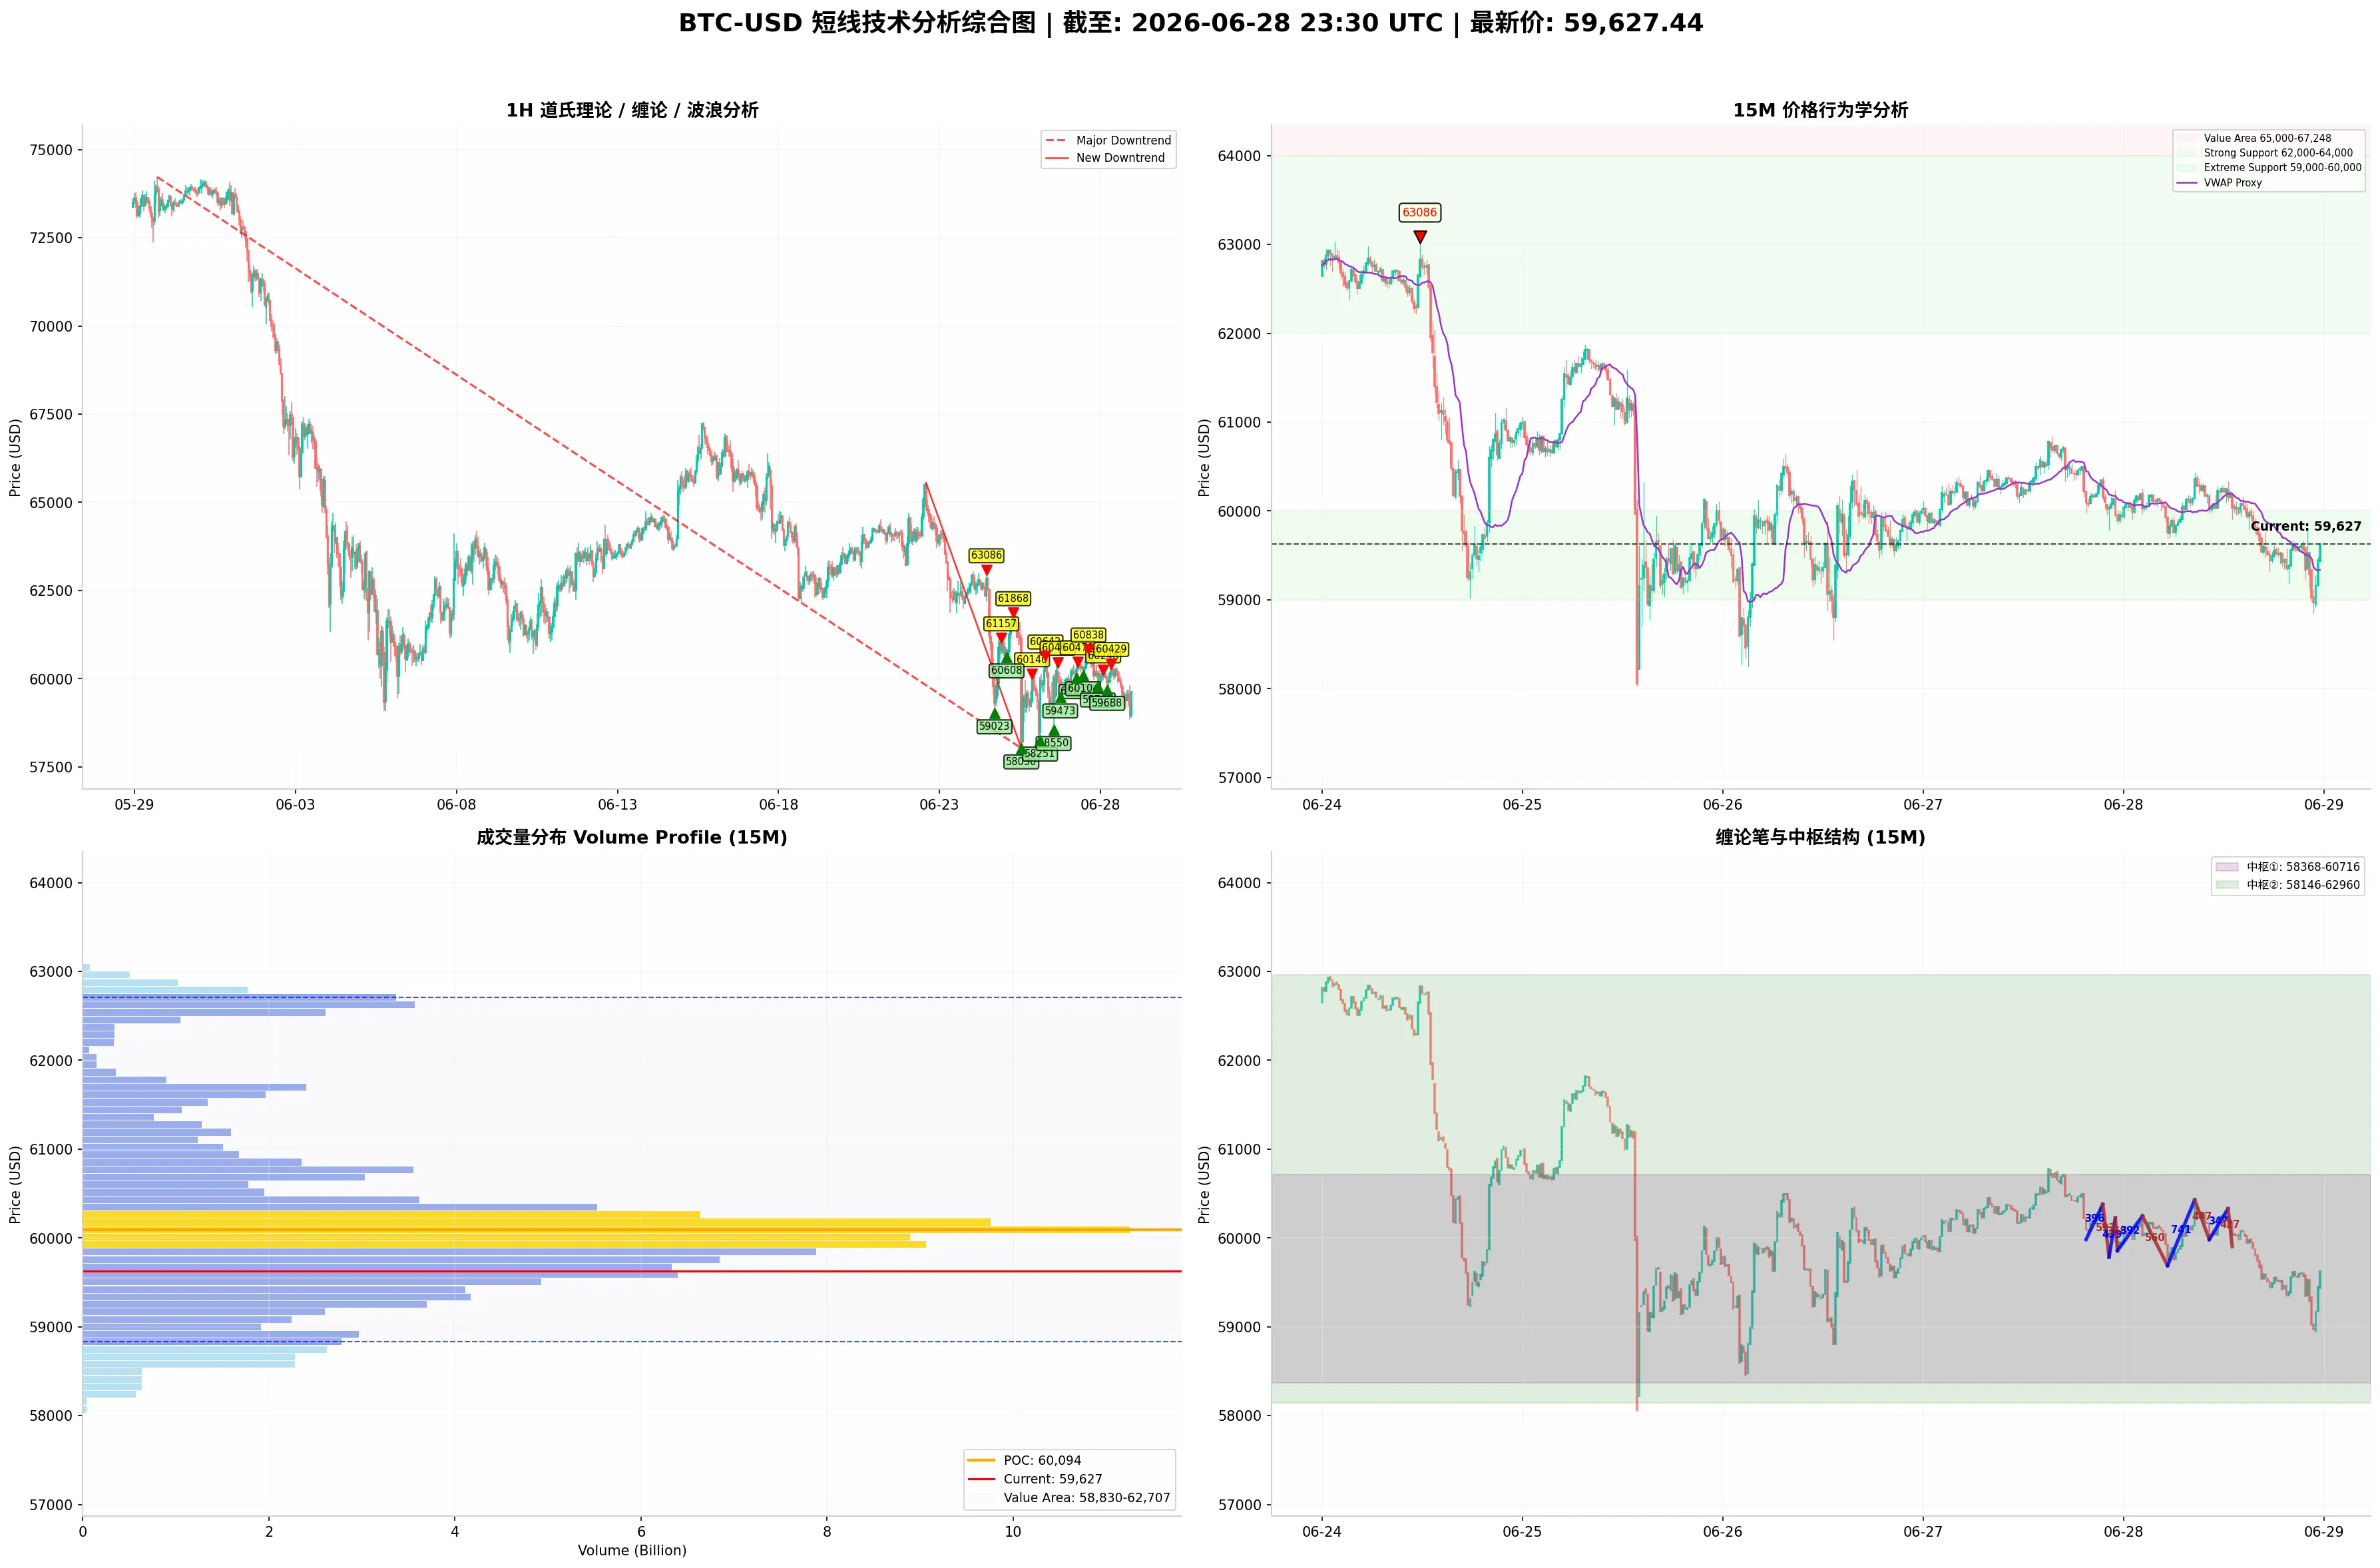
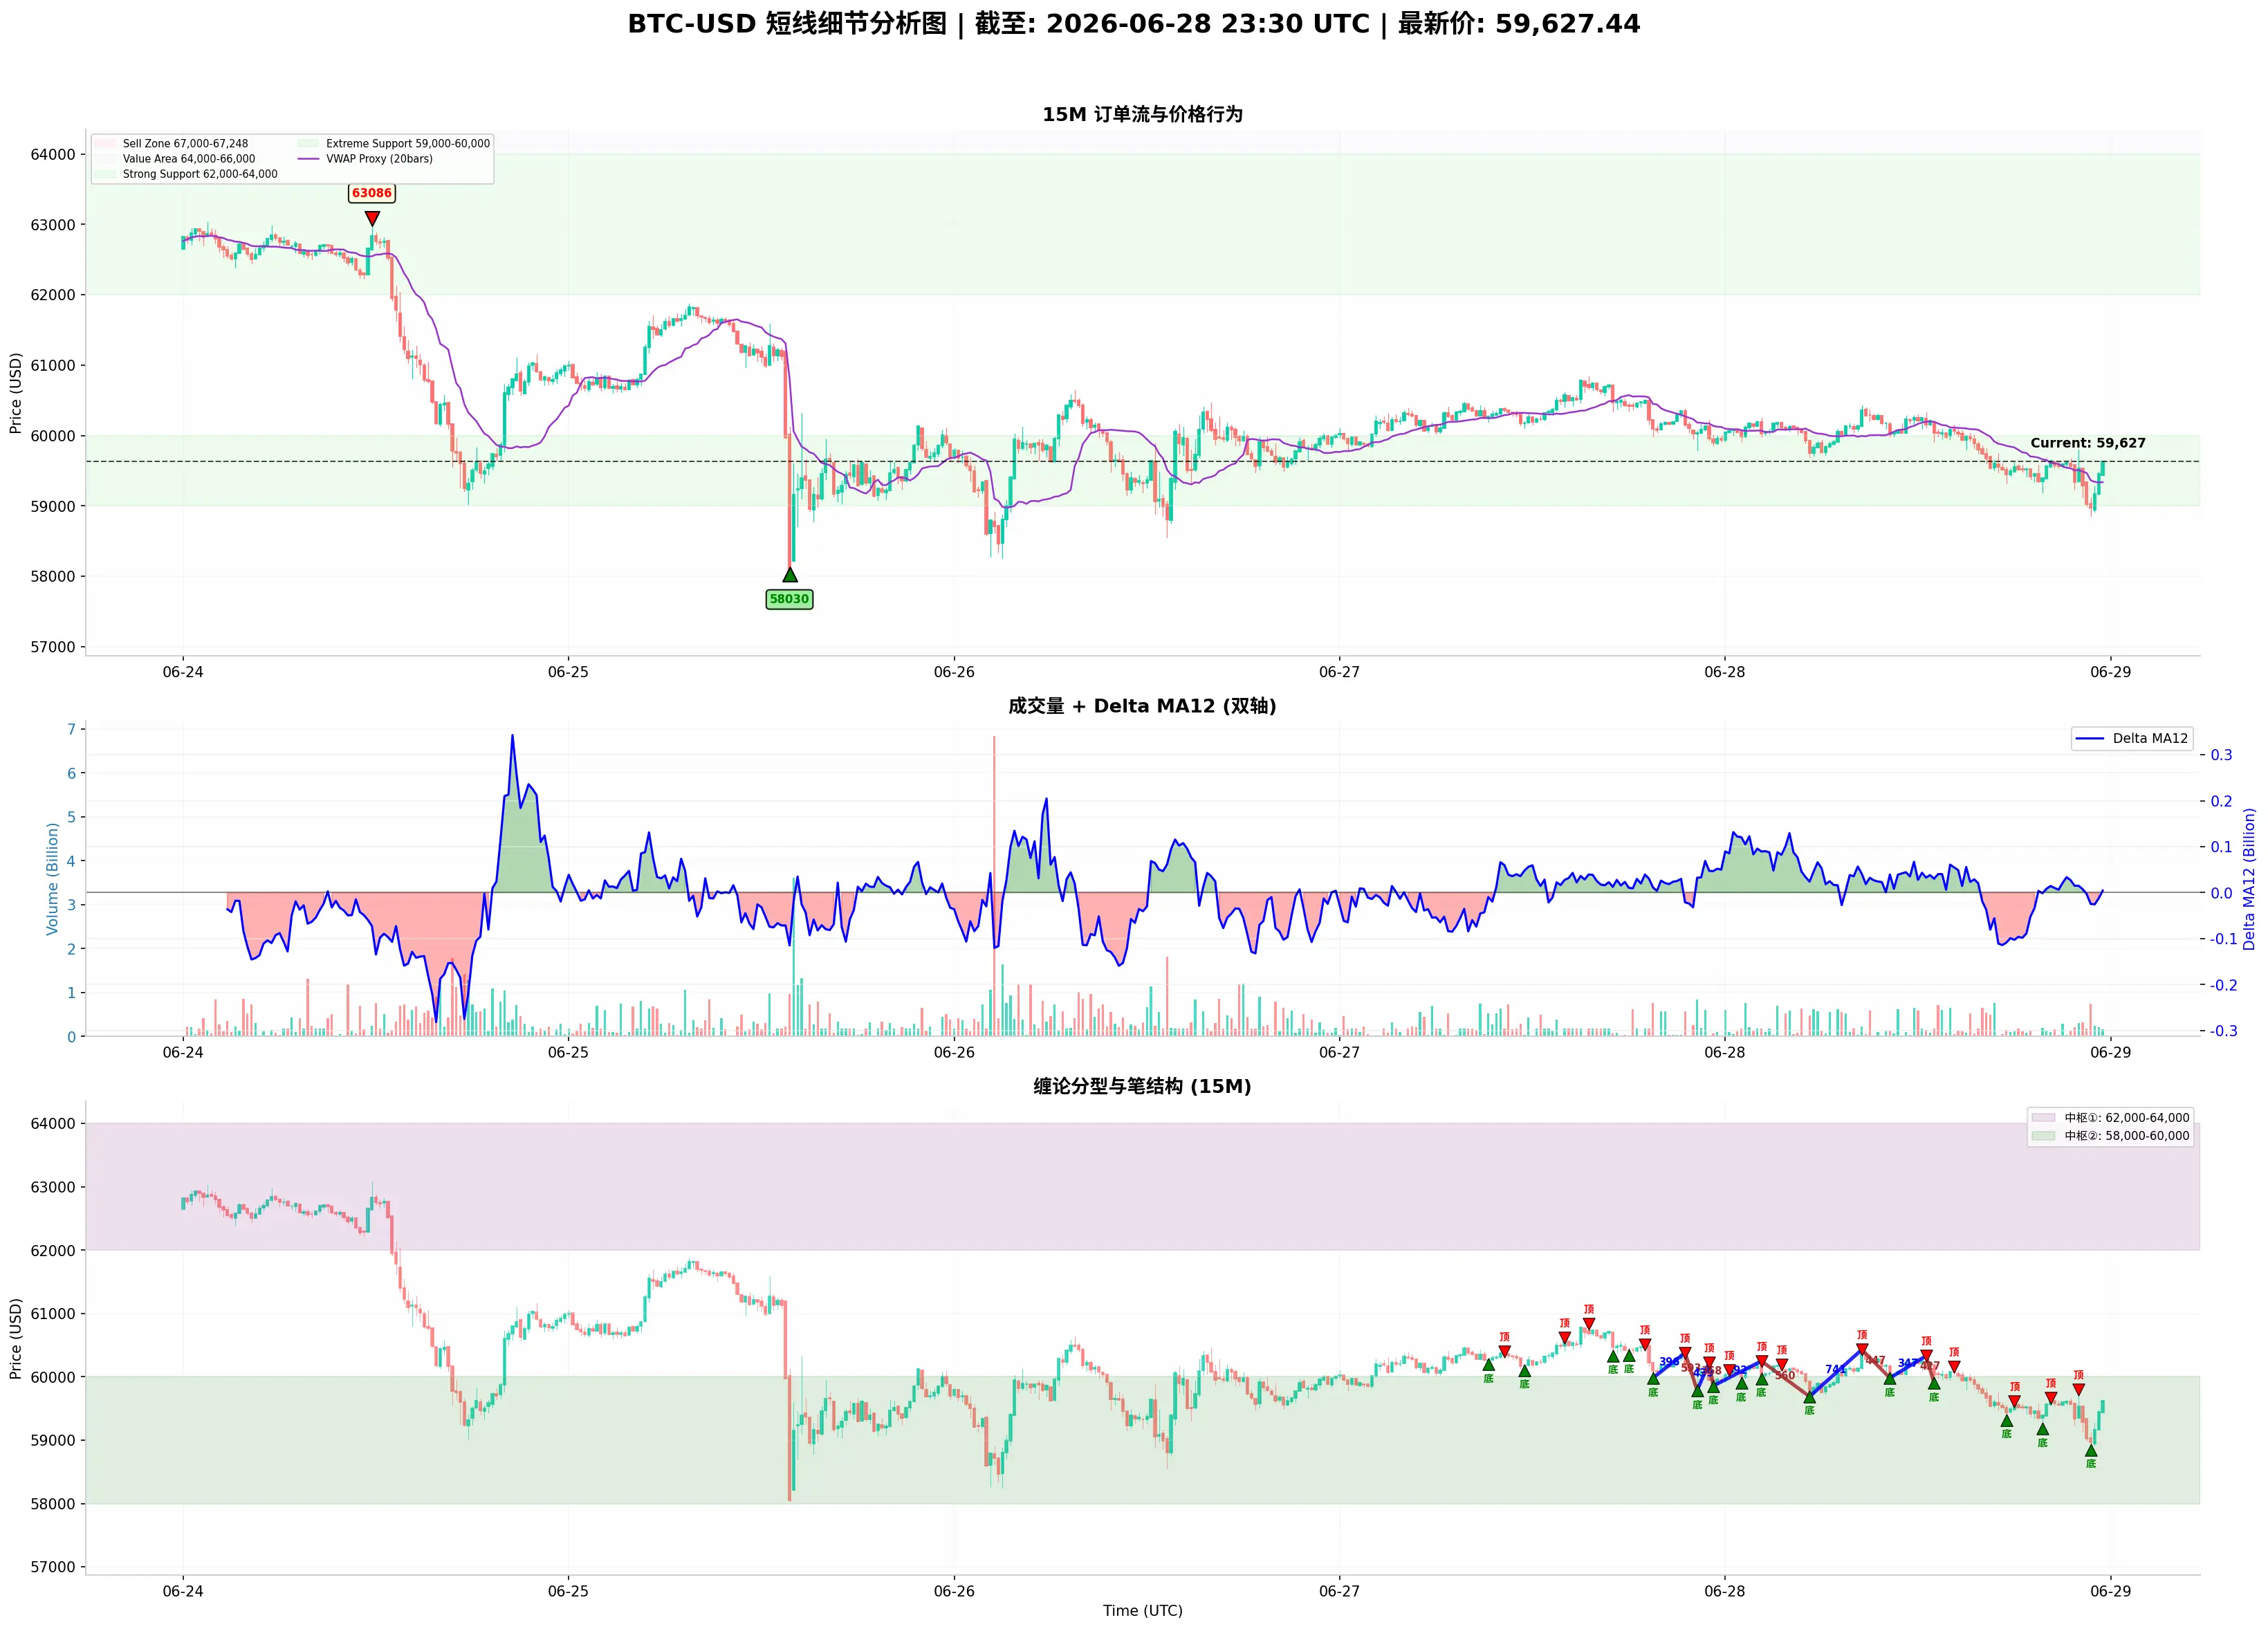
Primary Trend (1-hour level): The medium-term downtrend from the May 29 high of 74,222 is extremely clear and steep. The price has been collapsing from 74,222, with several rebounds along the way (to the 67,500 range on June 18 and to 63,086 on June 24), but none broke through previous highs, forming a classic "lower highs" bearish arrangement. After the high of 63,086 on June 24, bears struck again, with a panic crash to 58,0
BTC-1.52%
View Original
post-image
post-image
  • Reward
  • Comment
  • Repost
  • Share
Briefly analyzing BTC short-term trends from Dow Theory, Chan Theory, Wave Theory, Volume-Price Relationship, Order Flow, and Price Action (Strategy Suggestions)
$BTC
Comprehensive Analysis
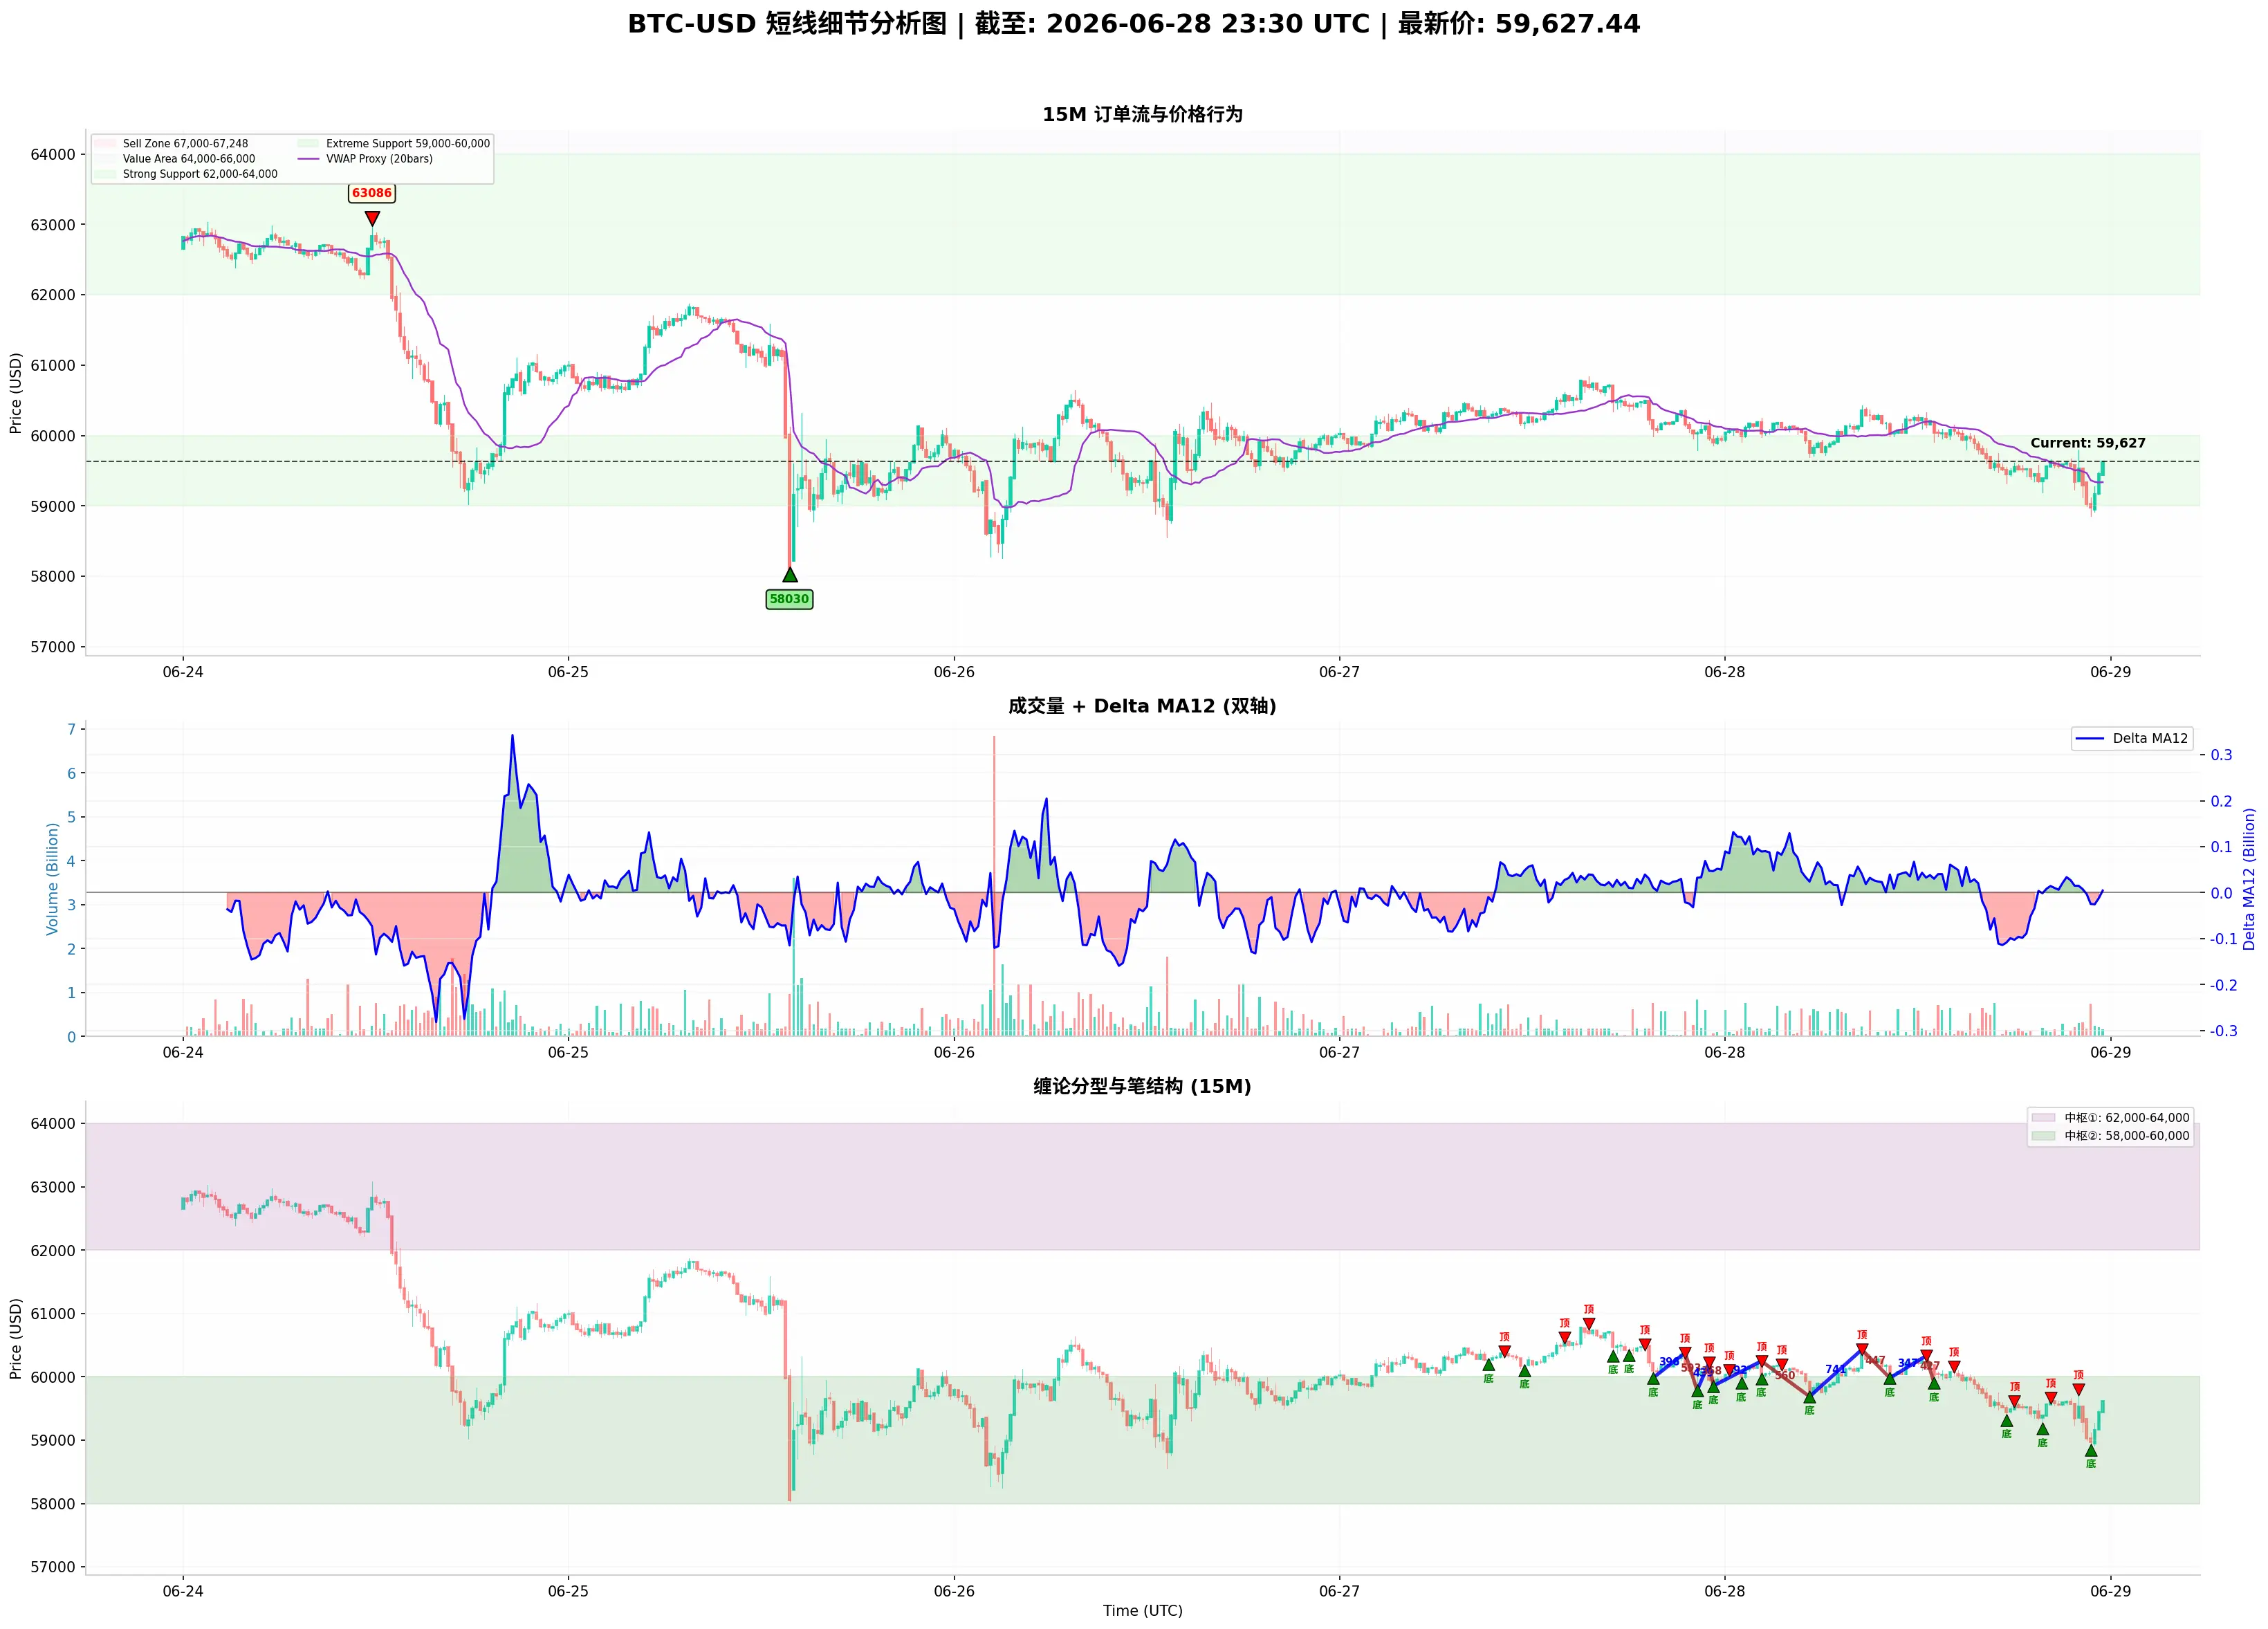
Dow Theory indicates that the primary trend remains a deep decline, but the downward momentum is significantly weakening. The short-term trend is in a converging triangle consolidation, with key levels at 60,500 (upper) and 59,500 (lower).
Chan Theory shows that the downward stroke is extremely strong (-6,166), but an upward stroke has appeared (+2,434). Subsequent small strokes oscillate with converging t
BTC-1.56%
View Original
post-image
post-image
  • Reward
  • Comment
  • Repost
  • Share
From Dow Theory, Chan Theory, Elliott Wave Theory, Volume-Price Analysis, Order Flow, and Price Action, a Brief Analysis of BTC Short-Term Trends
$BTC I. Dow Theory
Primary Trend (1-hour level): The medium-term downtrend from the May 29 high of 74,222 is extremely clear and steep. Prices have plummeted from 74,222, and although there have been several rebounds (a rebound to the 67,500 range on June 18, and a rebound to 63,086 on June 24), none have broken through the previous high, forming a typical "lower highs" bearish arrangement. After the June 24 high of 63,086, bears struck again, with
BTC-1.56%
View Original
post-image
post-image
  • Reward
  • Comment
  • Repost
  • Share
  • Pinned