CryptoZeno

vip
Age 4.7 Year
Peak Tier 3
Featured Creator on #CoinMarketCap and #CryptoQuant | On Chain Research and Market Insights
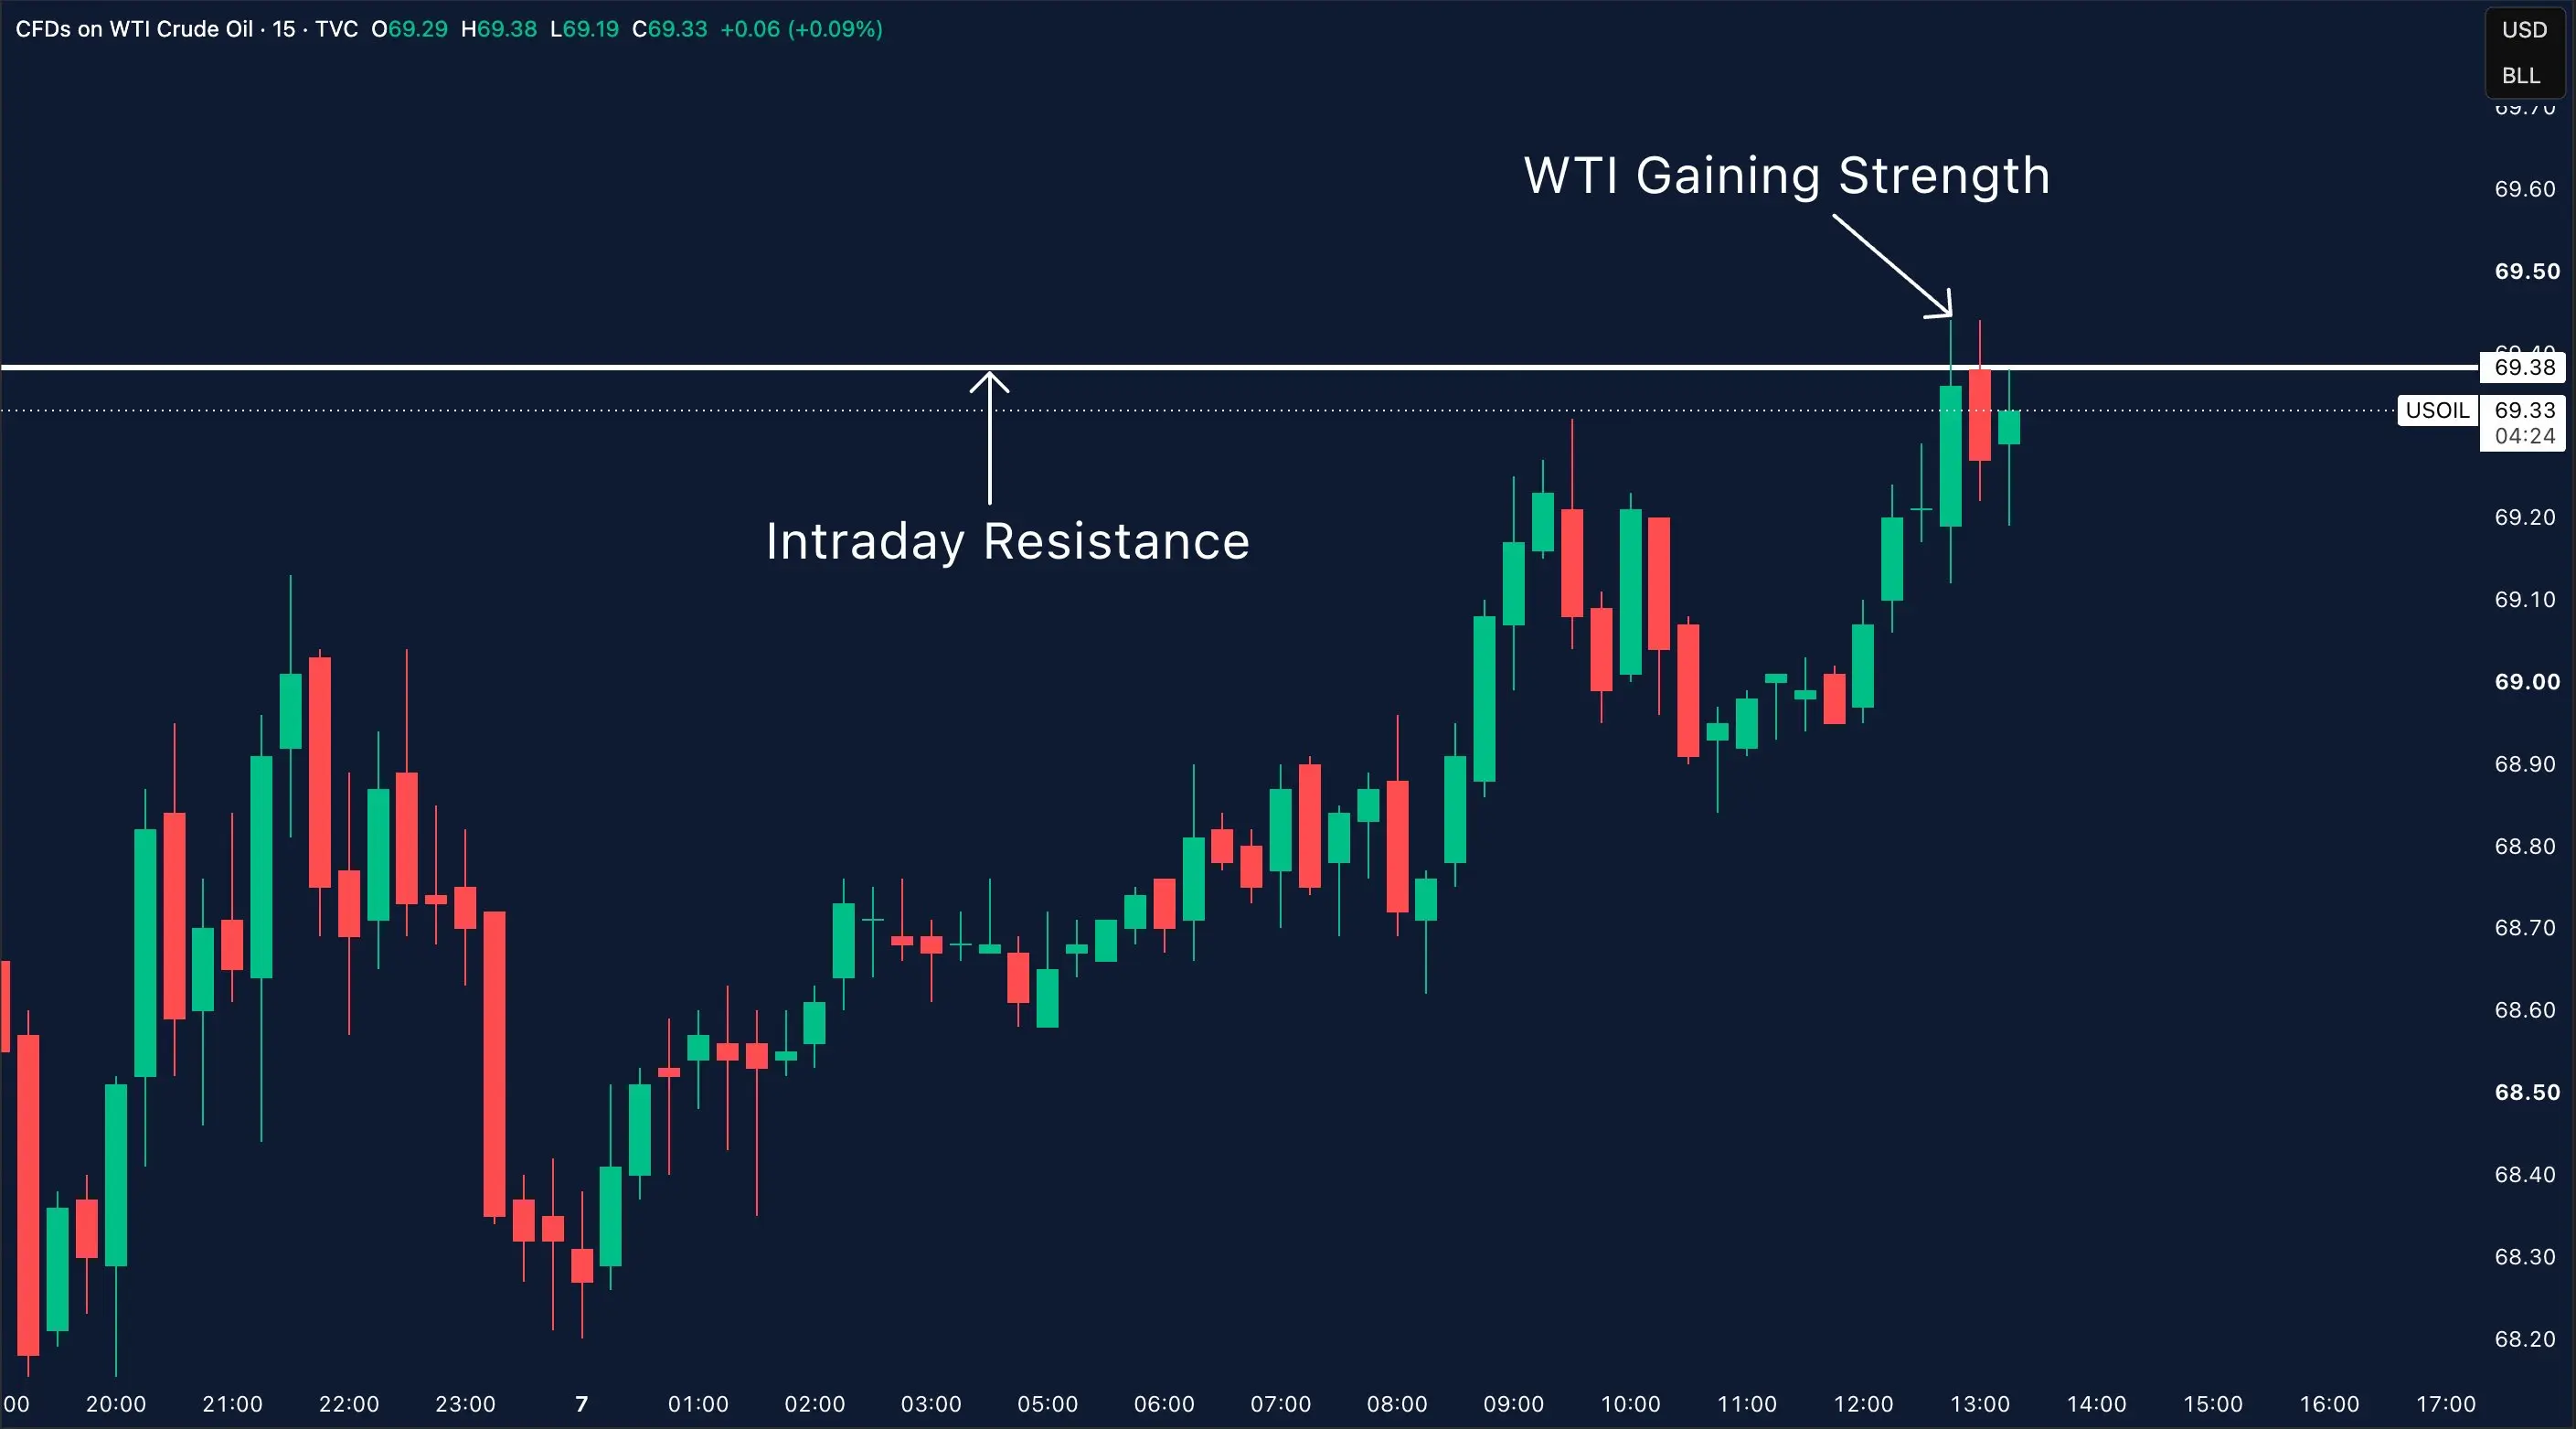
Oil is starting to regain strength.
WTI has pushed back towards intraday resistance after renewed tensions around the Strait of Hormuz.
So far, buyers are still stepping in.
A clean break above this level would suggest markets are beginning to price in a higher geopolitical risk premium.
If oil keeps climbing from here, it's something Bitcoin traders should be paying attention to.
Higher oil prices don't just impact energy, they can quickly spill over into broader market sentiment.
BTC1.02%
post-image
  • Reward
  • 4
  • 3
  • Share
Abdulwaliyy:
oil is gold , crude oil can be gotten from Nigeria
View More
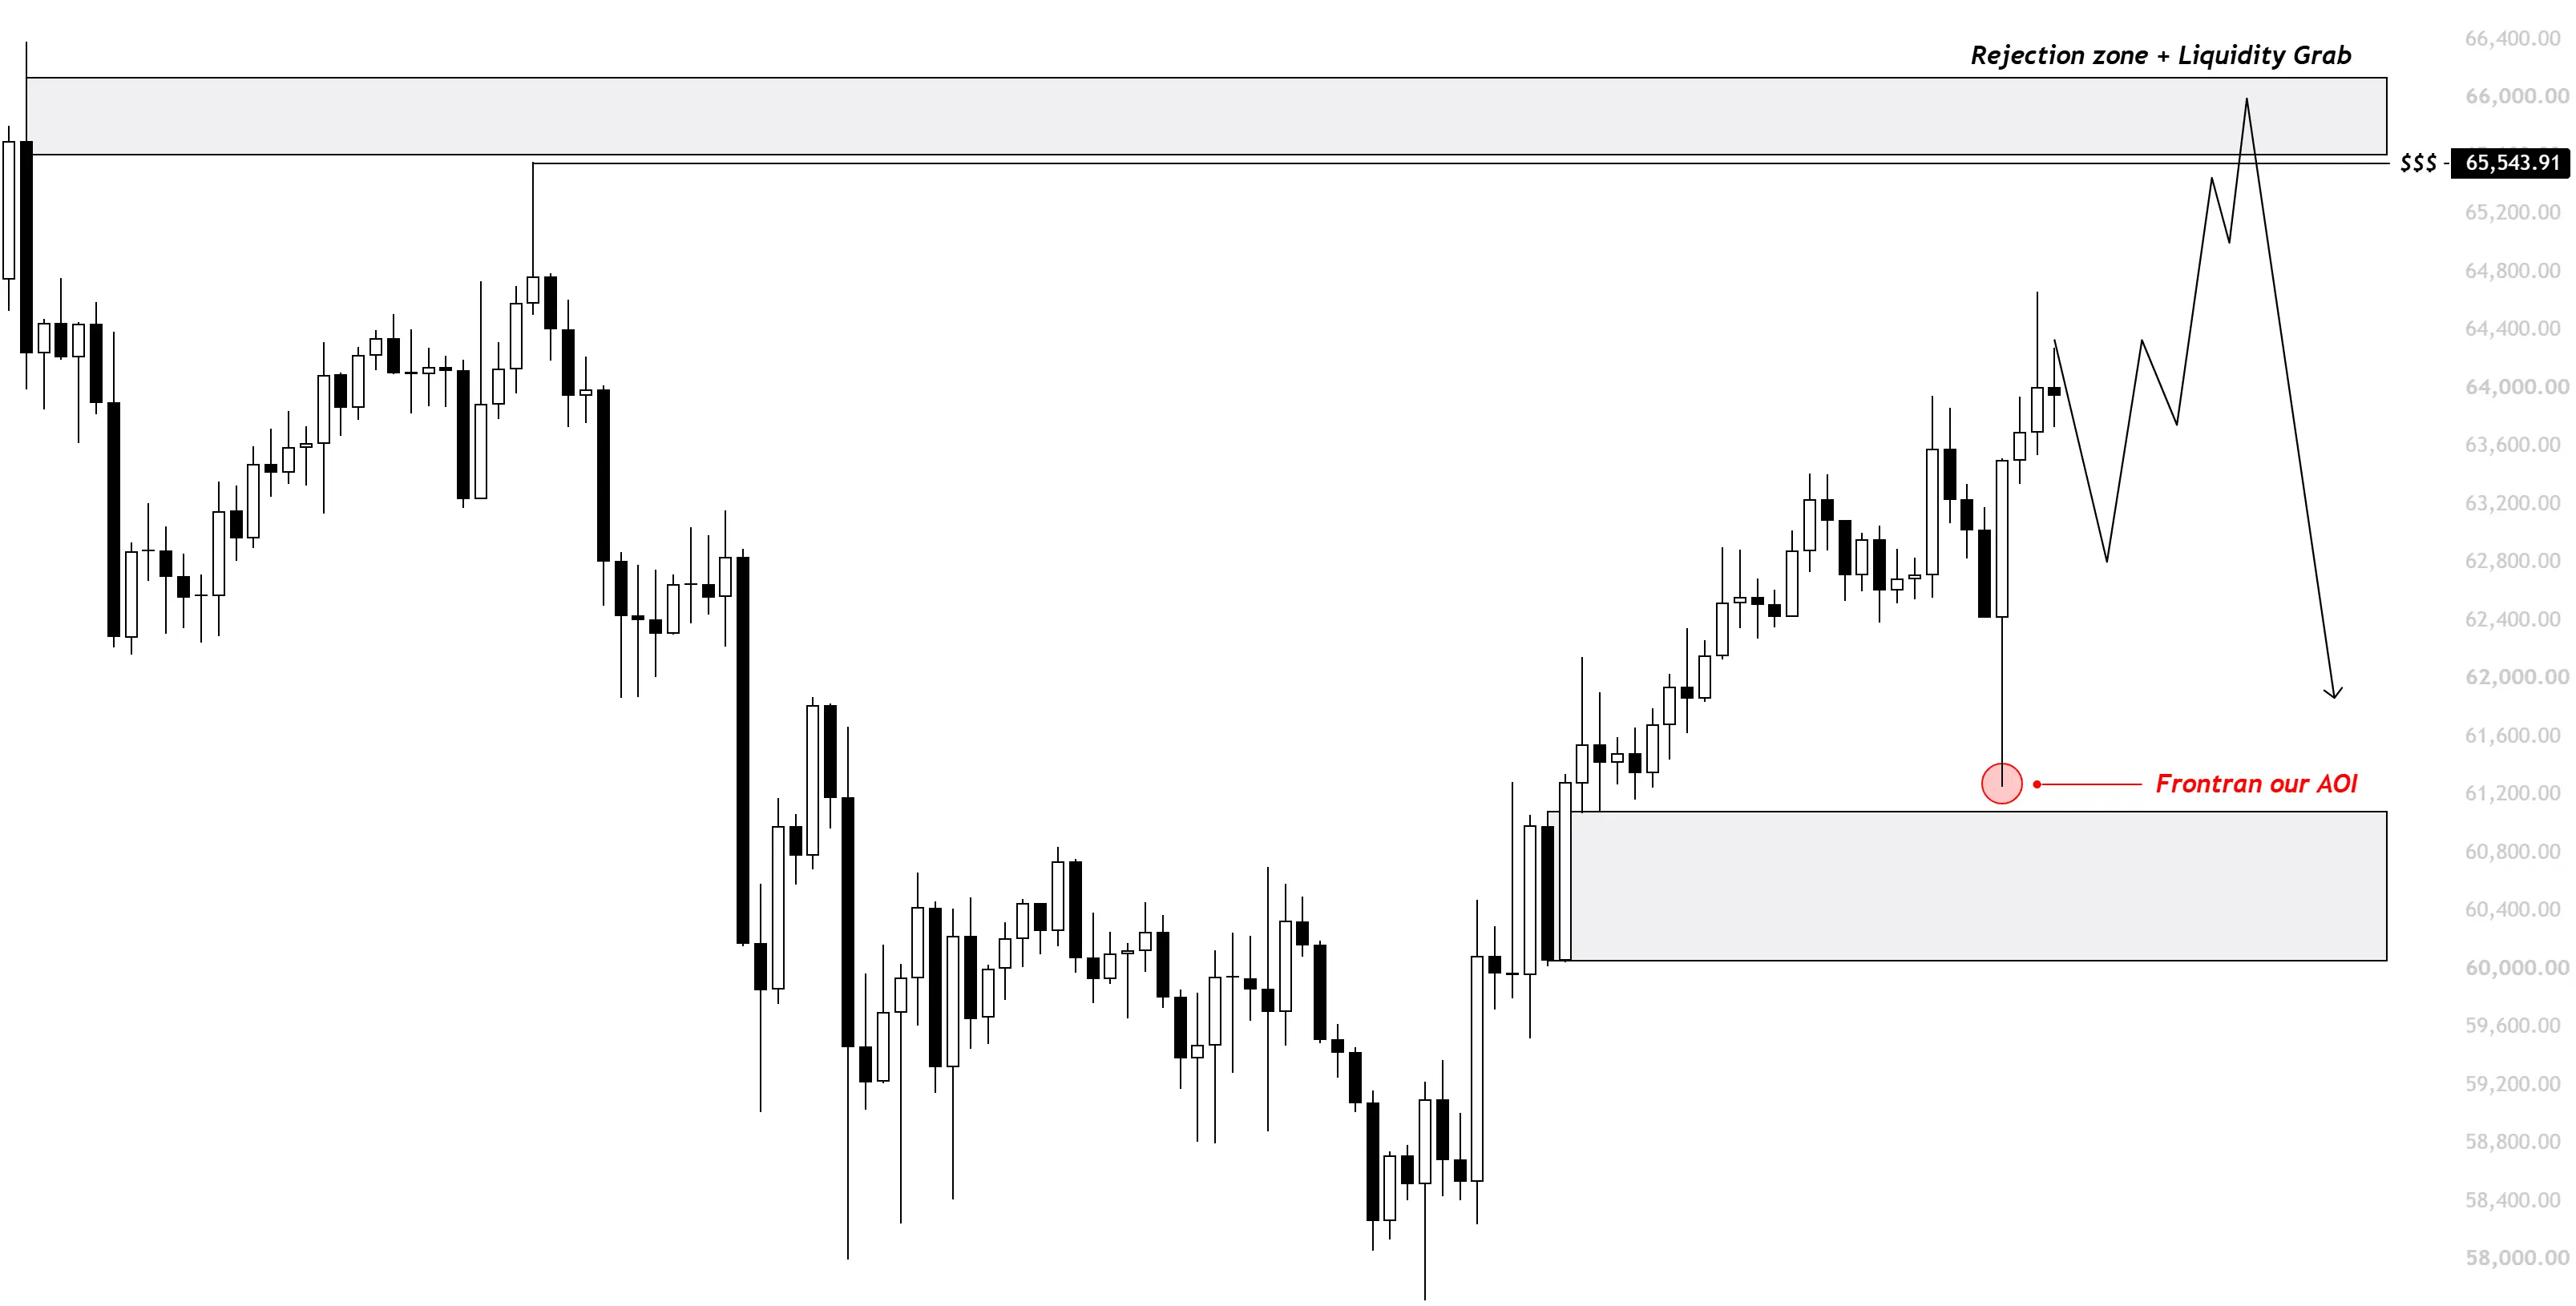
$BTC After dumping from Asia session yesterday,
Price came down near our 60-61k AOI, but that zone got frontran and now we are back into 64ks.
We still have liquidity sitting in our zone but from the look of current PA,
I think we are gonna extend this move up by directly targeting the 65.6k region before 60k.
What I am looking at now is for price to dump into 62.7k level, as that area is our Monthly POC + we got a FVG there.
So I am expecting price to test that area and then continue the move towards upside and clear out the 65.6k highs,
From there we should get a rejection and finally hea
BTC1.02%
post-image
  • Reward
  • 2
  • 2
  • Share
GovernanceVotingTug-Of-WarKing:
This wave pumps first to 65.6k, then slams back down to 60.5k—typical liquidity hunting. A short has already been placed and posted at 65.6k.
View More
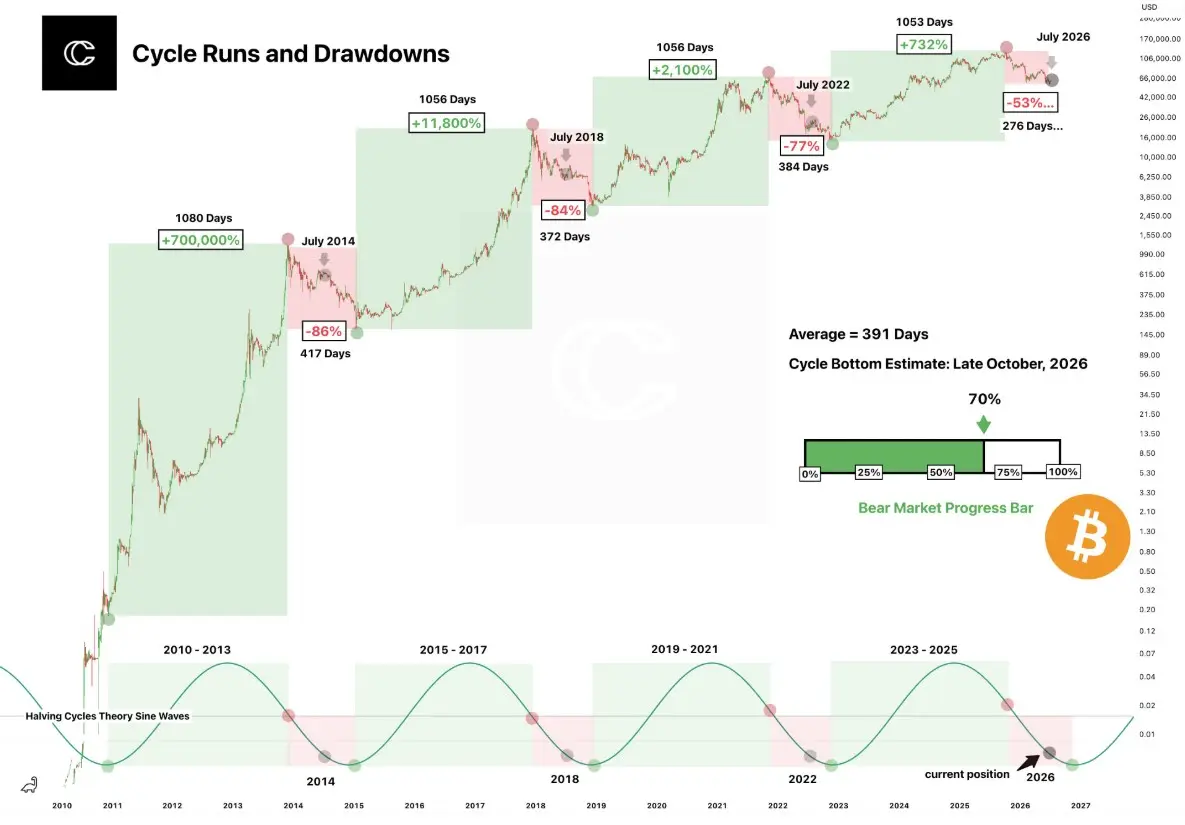
Bitcoin Cycle Fractal Is Repeating... But This Time Is Different.
History rarely repeats perfectly, but it often rhymes. Previous Bitcoin cycles delivered explosive rallies followed by brutal corrections averaging 77% to 86%. The current cycle has only retraced around 53%, significantly shallower than historical bear markets, suggesting structural strength remains intact despite extreme fear.
From a cycle perspective, Bitcoin has completed roughly 70% of its historical bear market duration, with the statistical cycle bottom projected around late October 2026. If this fractal continues to play
BTC1.02%
post-image
  • Reward
  • 5
  • 2
  • Share
MoonlightColdWallet:
#GTBurns2.57MInQ2 This tag looks so out of place mixed in here, but data destruction is indeed a long-term positive. It's more interesting when viewed together with the cyclical viewpoint.
View More
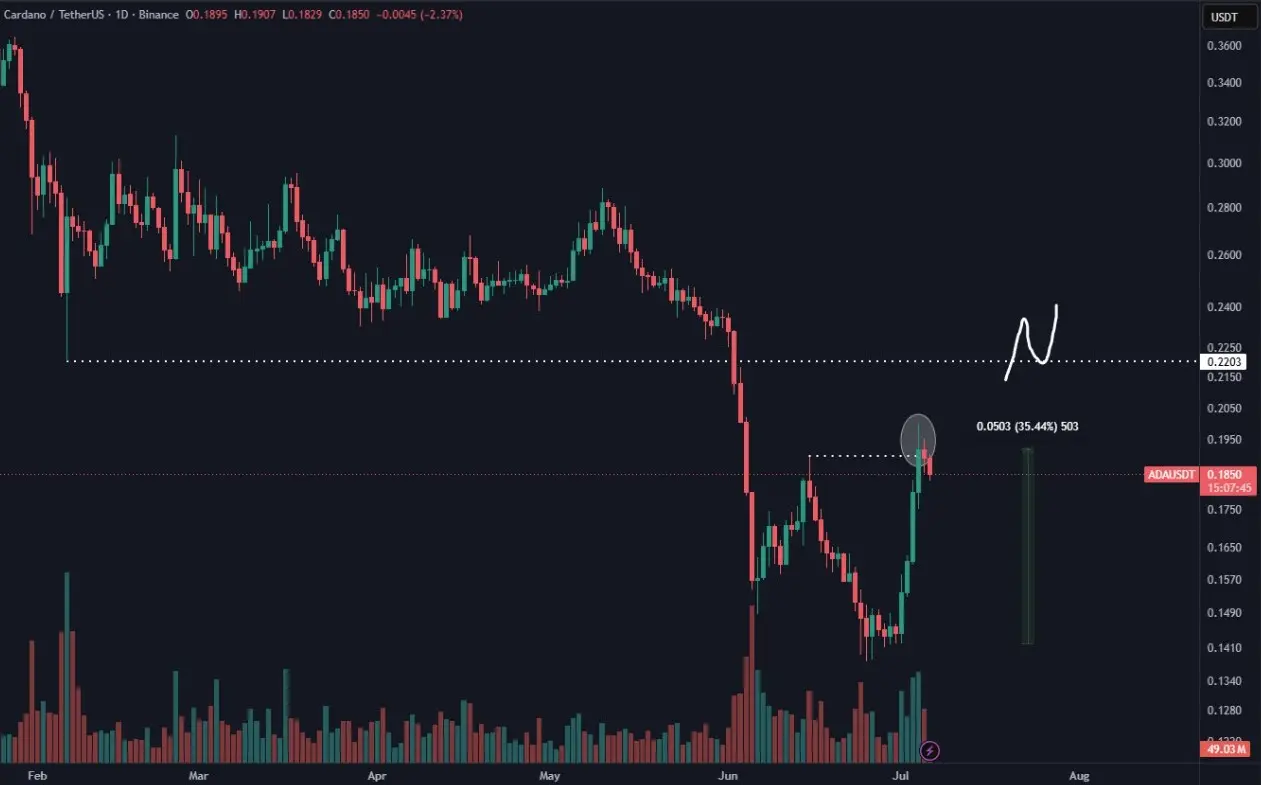
$ADA Big rally the past week and the stand-out within the majors.
Usually coins like these moving does tend to be a decent sign for overall altcoin risk appetite, but I'd want to see a follow up leg to properly confirm this.
One leg up is generally met with a decent amount of short covering/profit taking and isn't enough to confirm a bigger reversal after a big down trend.
But good to watch regardless.
ADA-1.63%
post-image
  • Reward
  • 4
  • Repost
  • Share
GateUser-06596f3b:
Under observation, reversal signals need double confirmation.
View More
SAYLOR SOLD - BUT TOM LEE BOUGHT.
post-image
post-image
post-image
post-image
  • Reward
  • 4
  • 1
  • Share
NotificationSoundInMistyValley:
The divergence among institutions is the opportunity for retail investors, but the question is — who do you follow?
View More
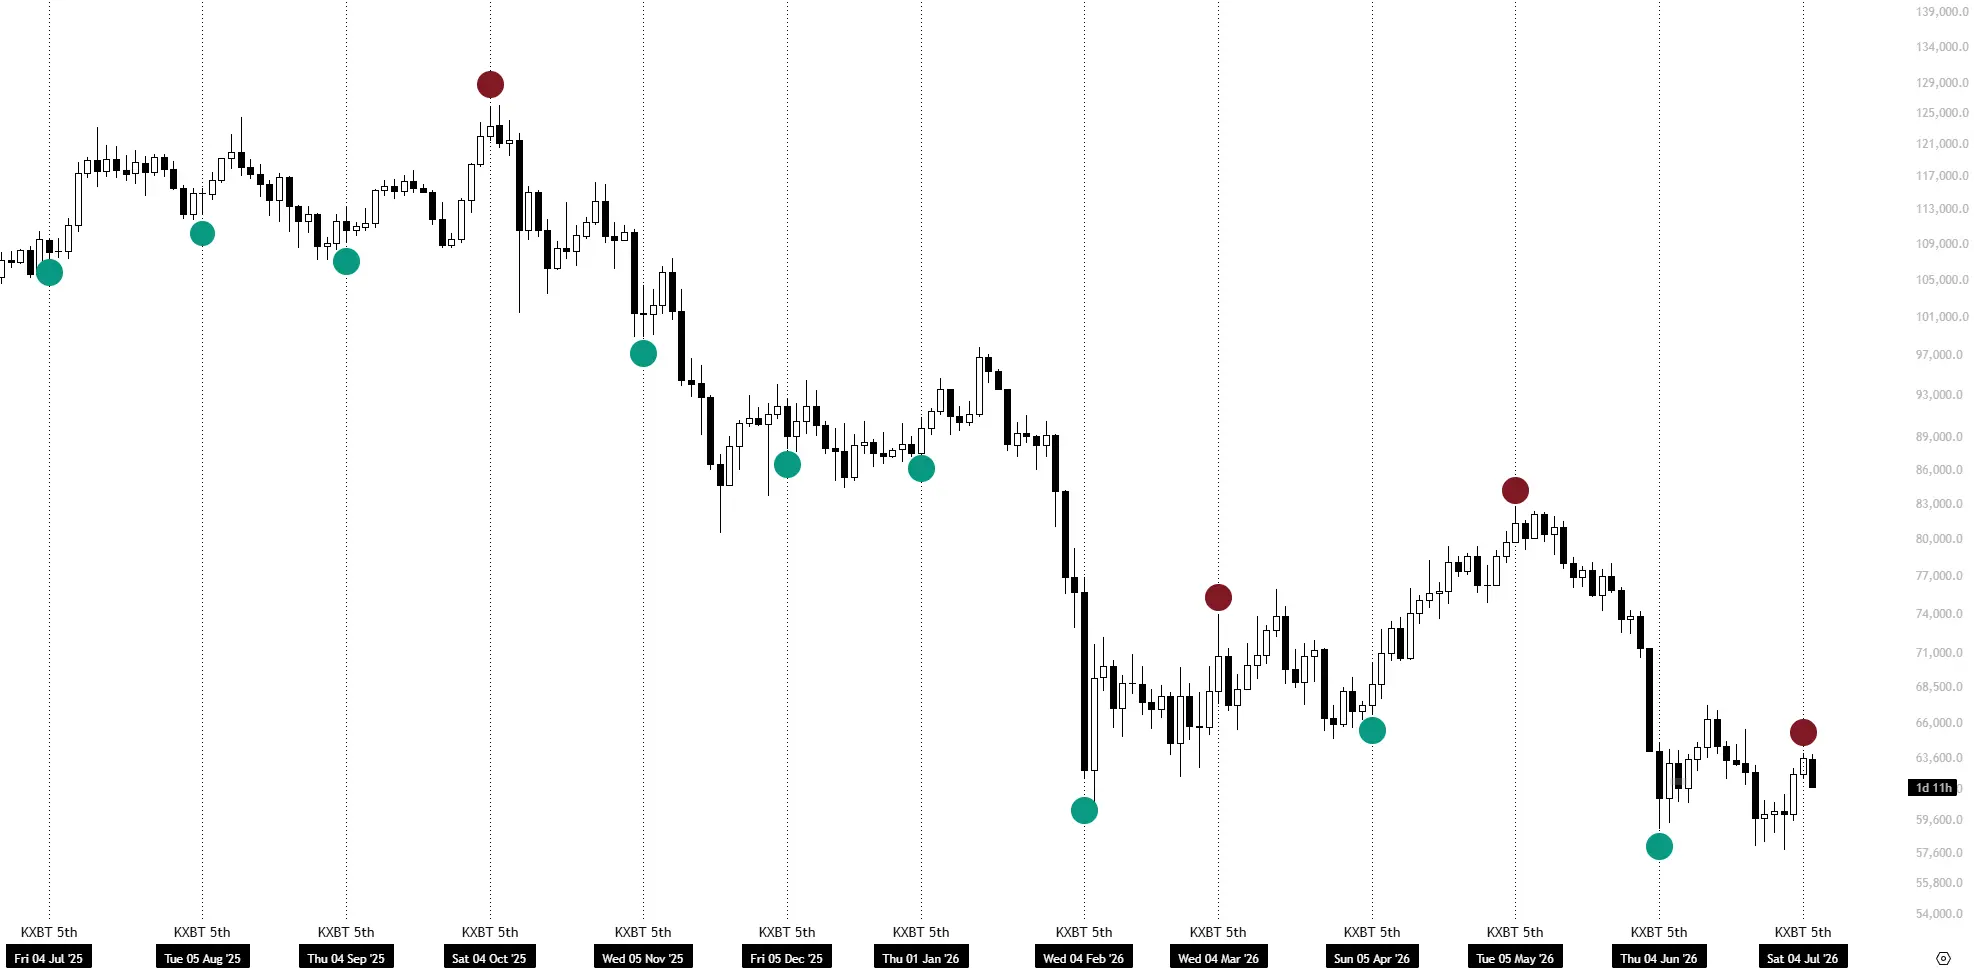
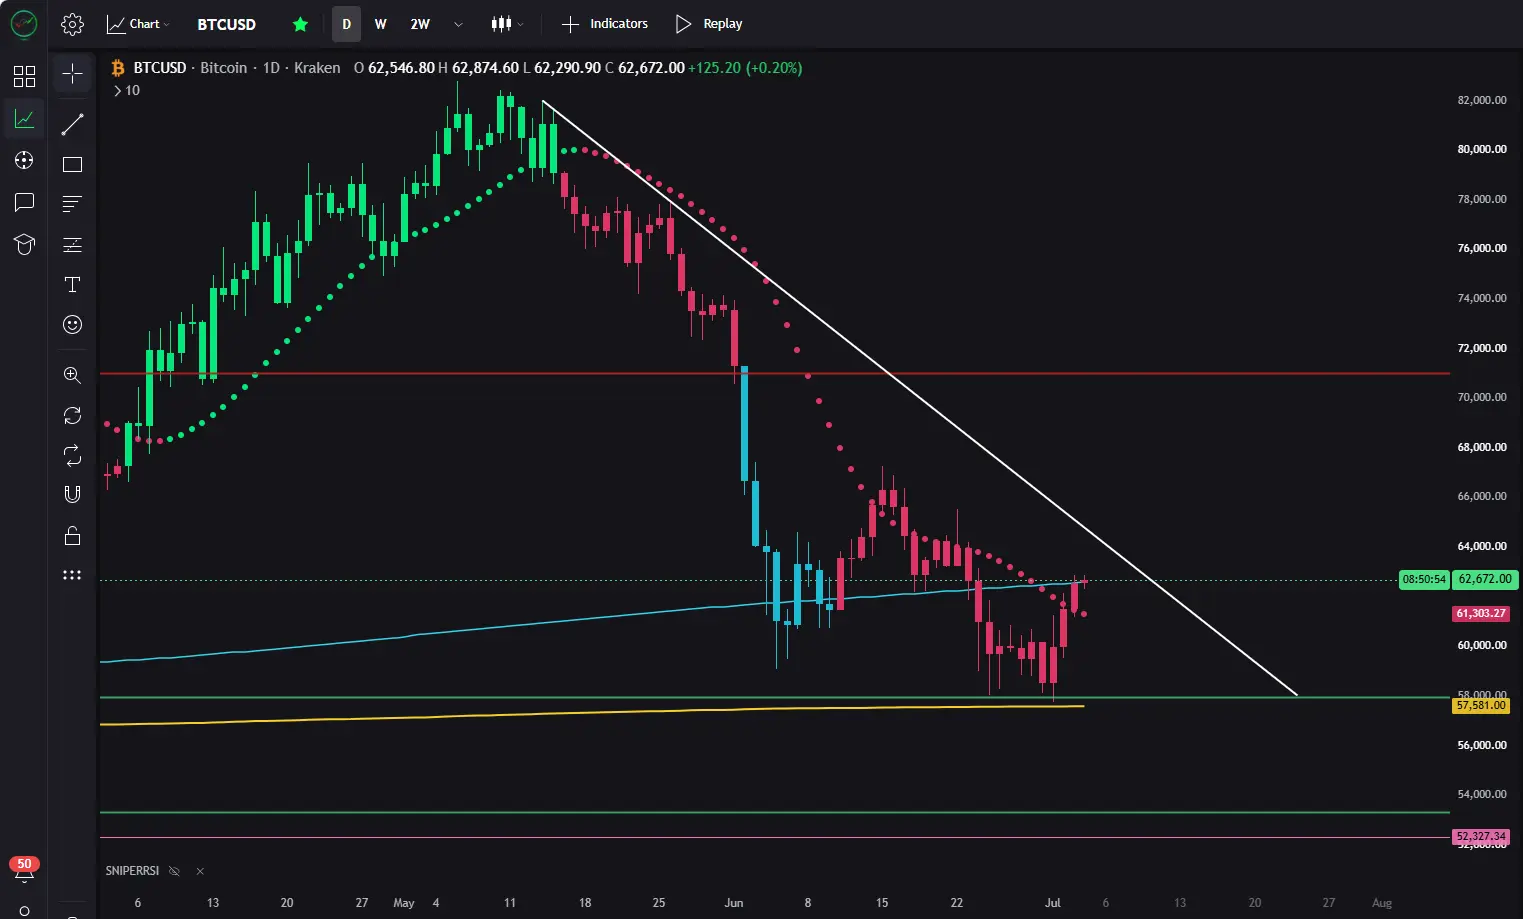
$BTC We are -3% after my 5th Pivot.
Standard Procedure.
BTC1.08%
post-image
  • Reward
  • 5
  • 2
  • Share
GateUser-bff4a462:
Really?
View More
$BTC | LTF
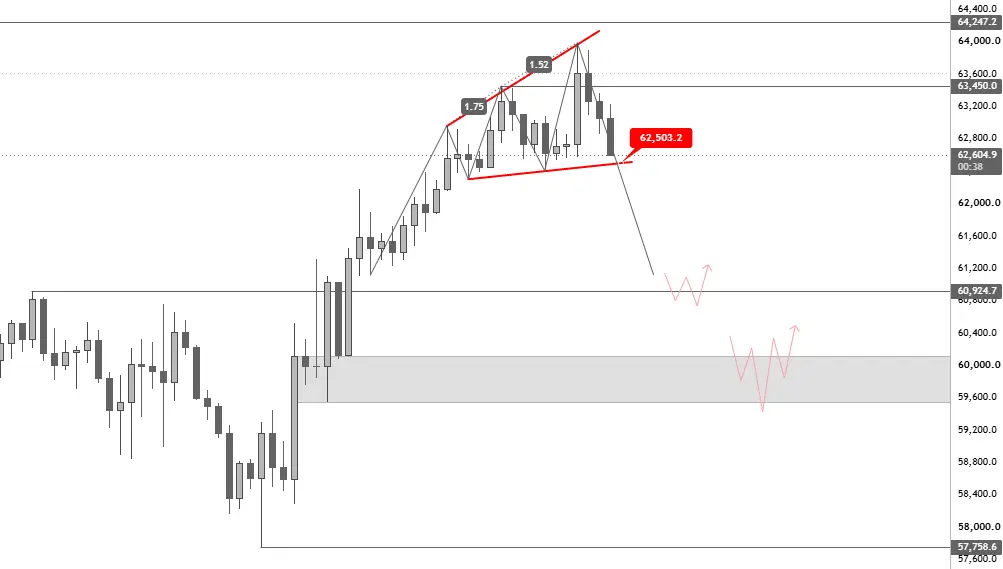
The H&S Pattern was invalidated as we got another squeeze above the highs, Which resulted in a Three Drives Pattern.
The Idea of the Retest is still valid and for confirmation, we need to break below 62.5k.
Looking for a retest of 60.9k, Down to the liquidity box at 60.1k-59.5k region. These zones are my areas of interest for a long this week.
A bounce there will signal towards further continuation towards the upside inside this month, Confirming that the bottom is likely in.
BTC1.08%
post-image
  • Reward
  • 6
  • 1
  • Share
SlothSignal:
The Three Drives Pattern has formed. The liquidity box below at 59.5k-60.1k is the key observation area this week. If it breaks below 62.5k, then consider left-side entry.
View More
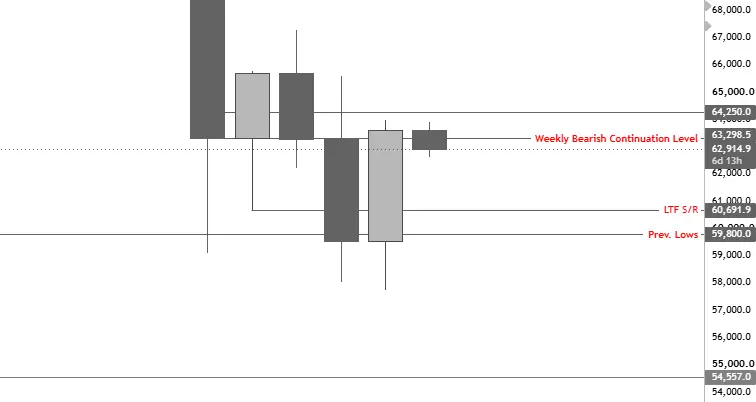
$BTC | 1W
We closed the weekly above the Bearish Continuation Level, resulting in a Bullish Engulfing candle.
I'm personally leaning towards the Bullish Scenario here, where we see a small pullback before continuing towards the 68.2k region later this month.
However, if we lose the 60.9k-59.5k region on the retest, the Bearish Scenario comes back into play.
BTC1.02%
post-image
  • Reward
  • 2
  • Repost
  • Share
Stop-LossInTheEveningGlow:
The range of 60.9k-59.5k is very critical. If it breaks below, the narrative will flip directly. Don't FOMO for now.
View More
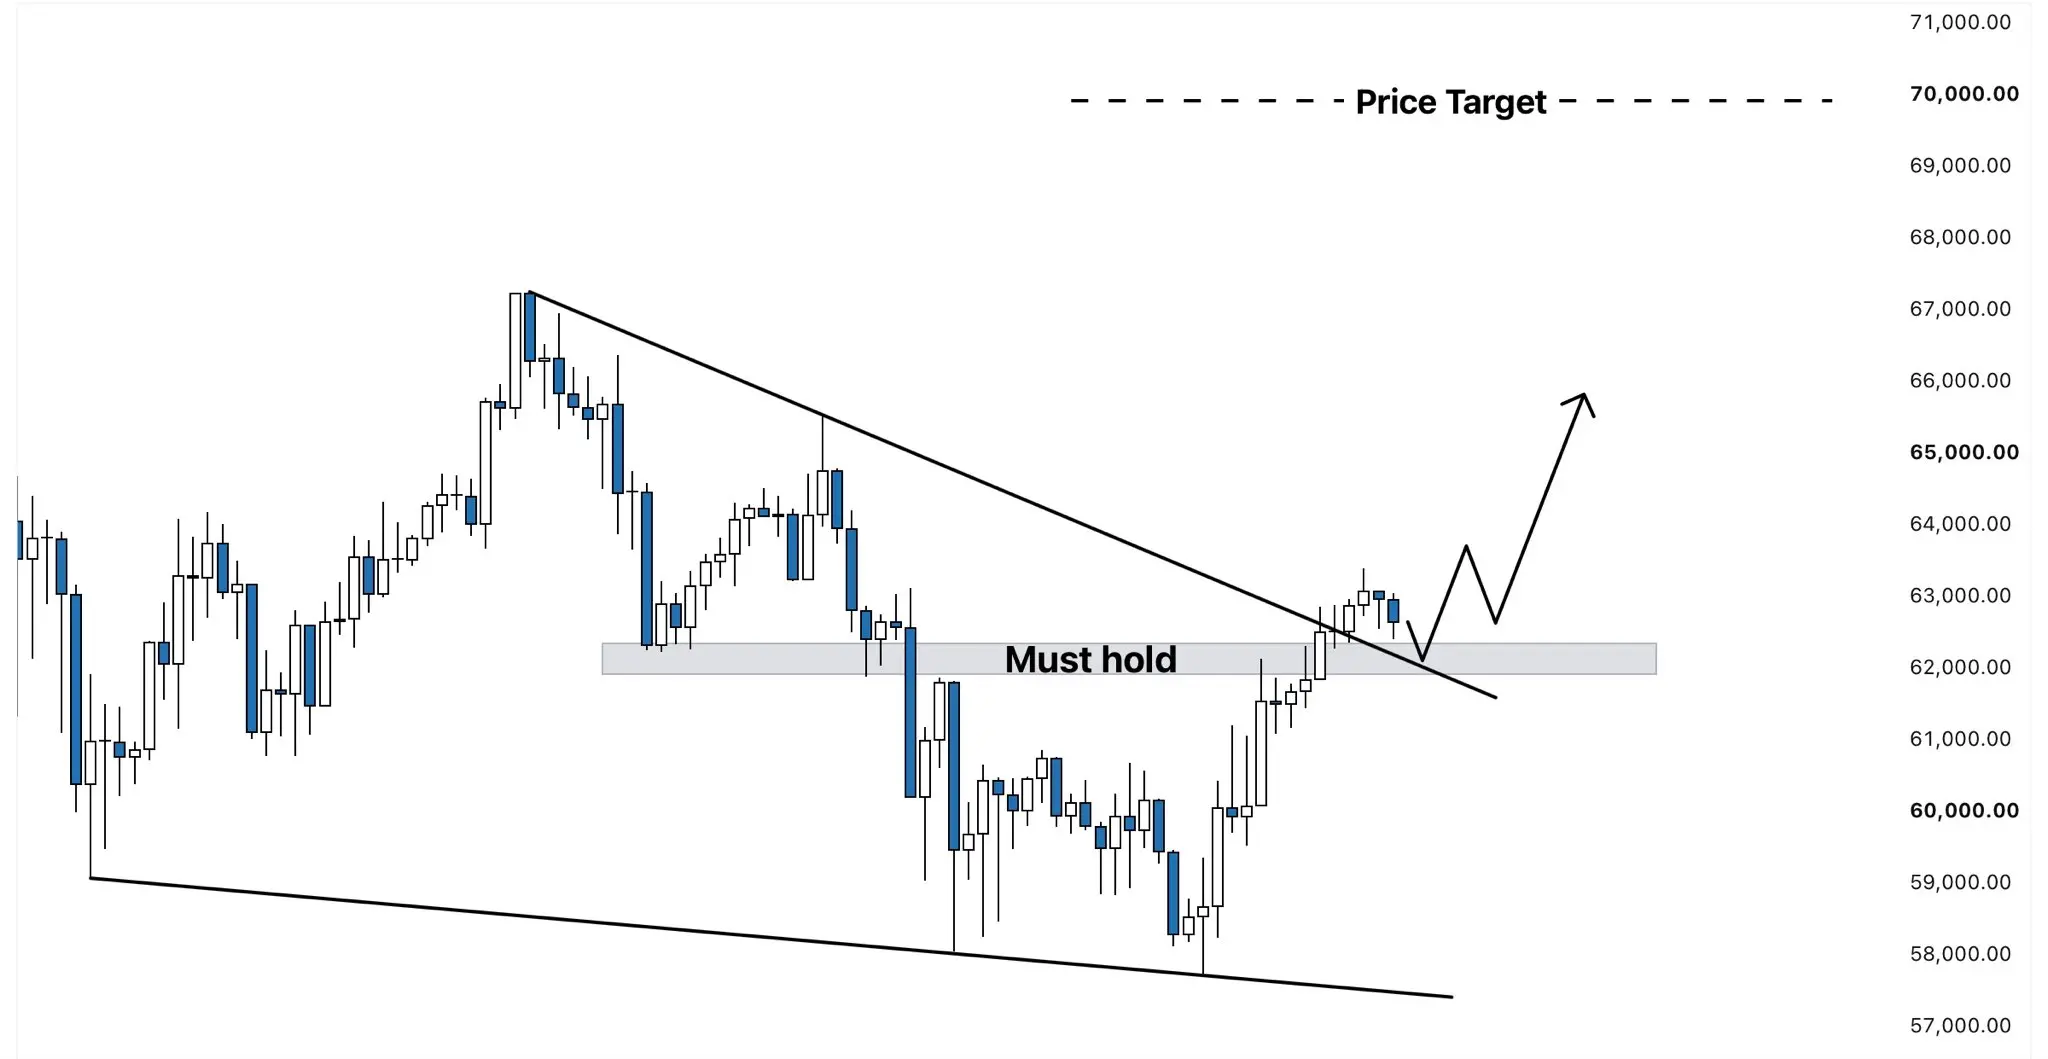
$BTC I recently saw a lot of people on CT posting about the falling wedge on BTC, but nobody talked about a potential price target.
Now that we’ve broken above the resistance and are still holding above it, the pattern has been validated.
However, it looks like we’ll get a retest of the breakout trendline, along with a key S/R level (grey box).
Both of these levels are around 62k, which has been a key level for months now.
If we see a bounce there, a bullish continuation is very likely and would point toward a price target of around 69k-70k.
However, if we break below and find acceptance back
BTC1.02%
post-image
  • Reward
  • 5
  • 2
  • Share
MintColdBrew:
The 69k target is quite conservative; breaking through the previous high could drive sentiment higher, potentially pushing it even higher.
View More
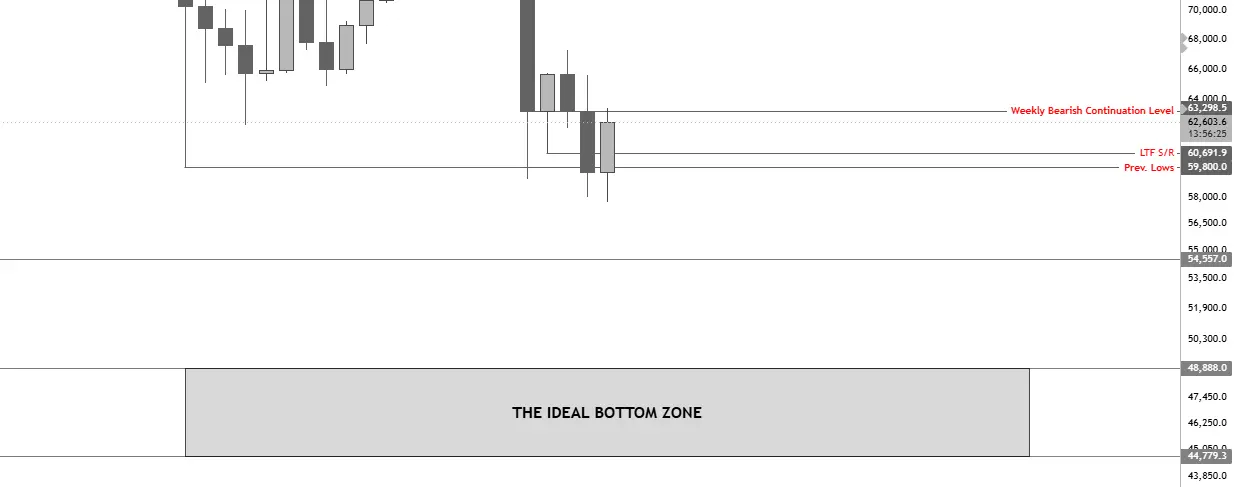
$BTC We're at a point where the next weekly close will give us a much better idea of whether we've already bottomed or if one final leg lower is still ahead.
A weekly close above 63.3k would be a strong sign of strength. It would give us a Bullish Engulfing on the weekly and add another confluence supporting the early bottom scenario.
If the bottom is in, we need to hold the 60.6k-59.8k region on a revisit.
We've built liquidity there during this move up, and it's a level that's likely to get swept. If we reclaim it and hold after taking out the liquidity, it'll be another strong confirmation
BTC1.08%
post-image
  • Reward
  • 6
  • 1
  • Share
GateUser-21ddf7c7:
From a technical perspective, both sides have their points, but things at the weekly level should still be respected.
View More
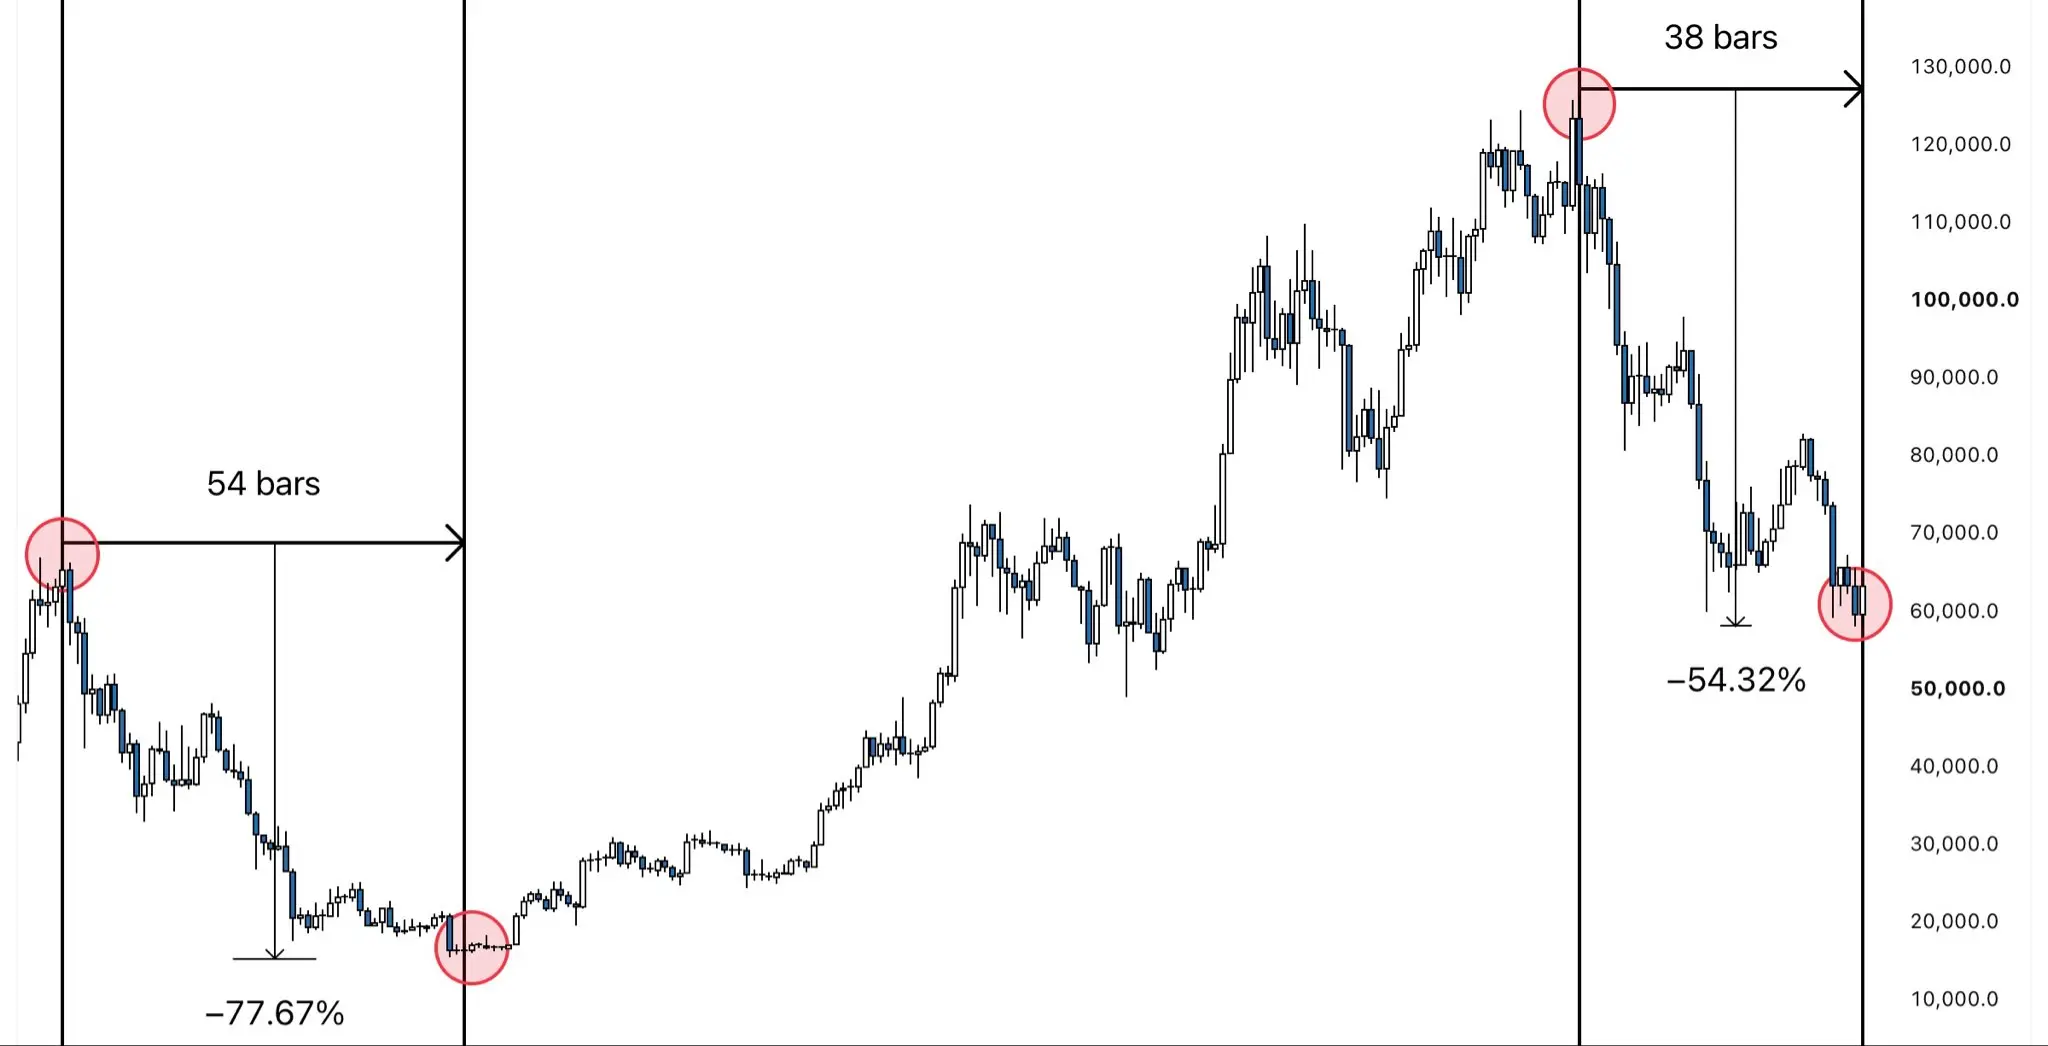
$BTC This is wild.
Last bear market, we saw roughly a 78% drawdown over a 54-week period.
Now we’re 38 weeks into the bear market and have so far seen a 54% decline from the top.
Comparing these stats shows that, on both metrics, we’re currently at around 70% of the previous bear market.
The biggest deviation from previous cycles was the last one, which bottomed at around 86%.
Keeping in mind that we have both diminishing returns and diminishing drawdowns, a bottom at 70% of the previous bear market doesn’t sound so crazy anymore.
Everyone who follows me knows that I think the probability of a
BTC1.02%
post-image
  • Reward
  • 7
  • 1
  • Share
OwlAuthorizationMonitor:
If you don't pick up cheap chips, you'll regret it in a bull market.
View More
$BTC continues higher on the bounce, regaining the 200-week SMA.
Altcoins are hitting higher targets.
Pink line will be hit before the end of this bear market.
BTC1.08%
post-image
  • Reward
  • 4
  • Repost
  • Share
HypeVaccinated:
The end of a bear market is always the most tormenting, position management is more important than prediction.
View More
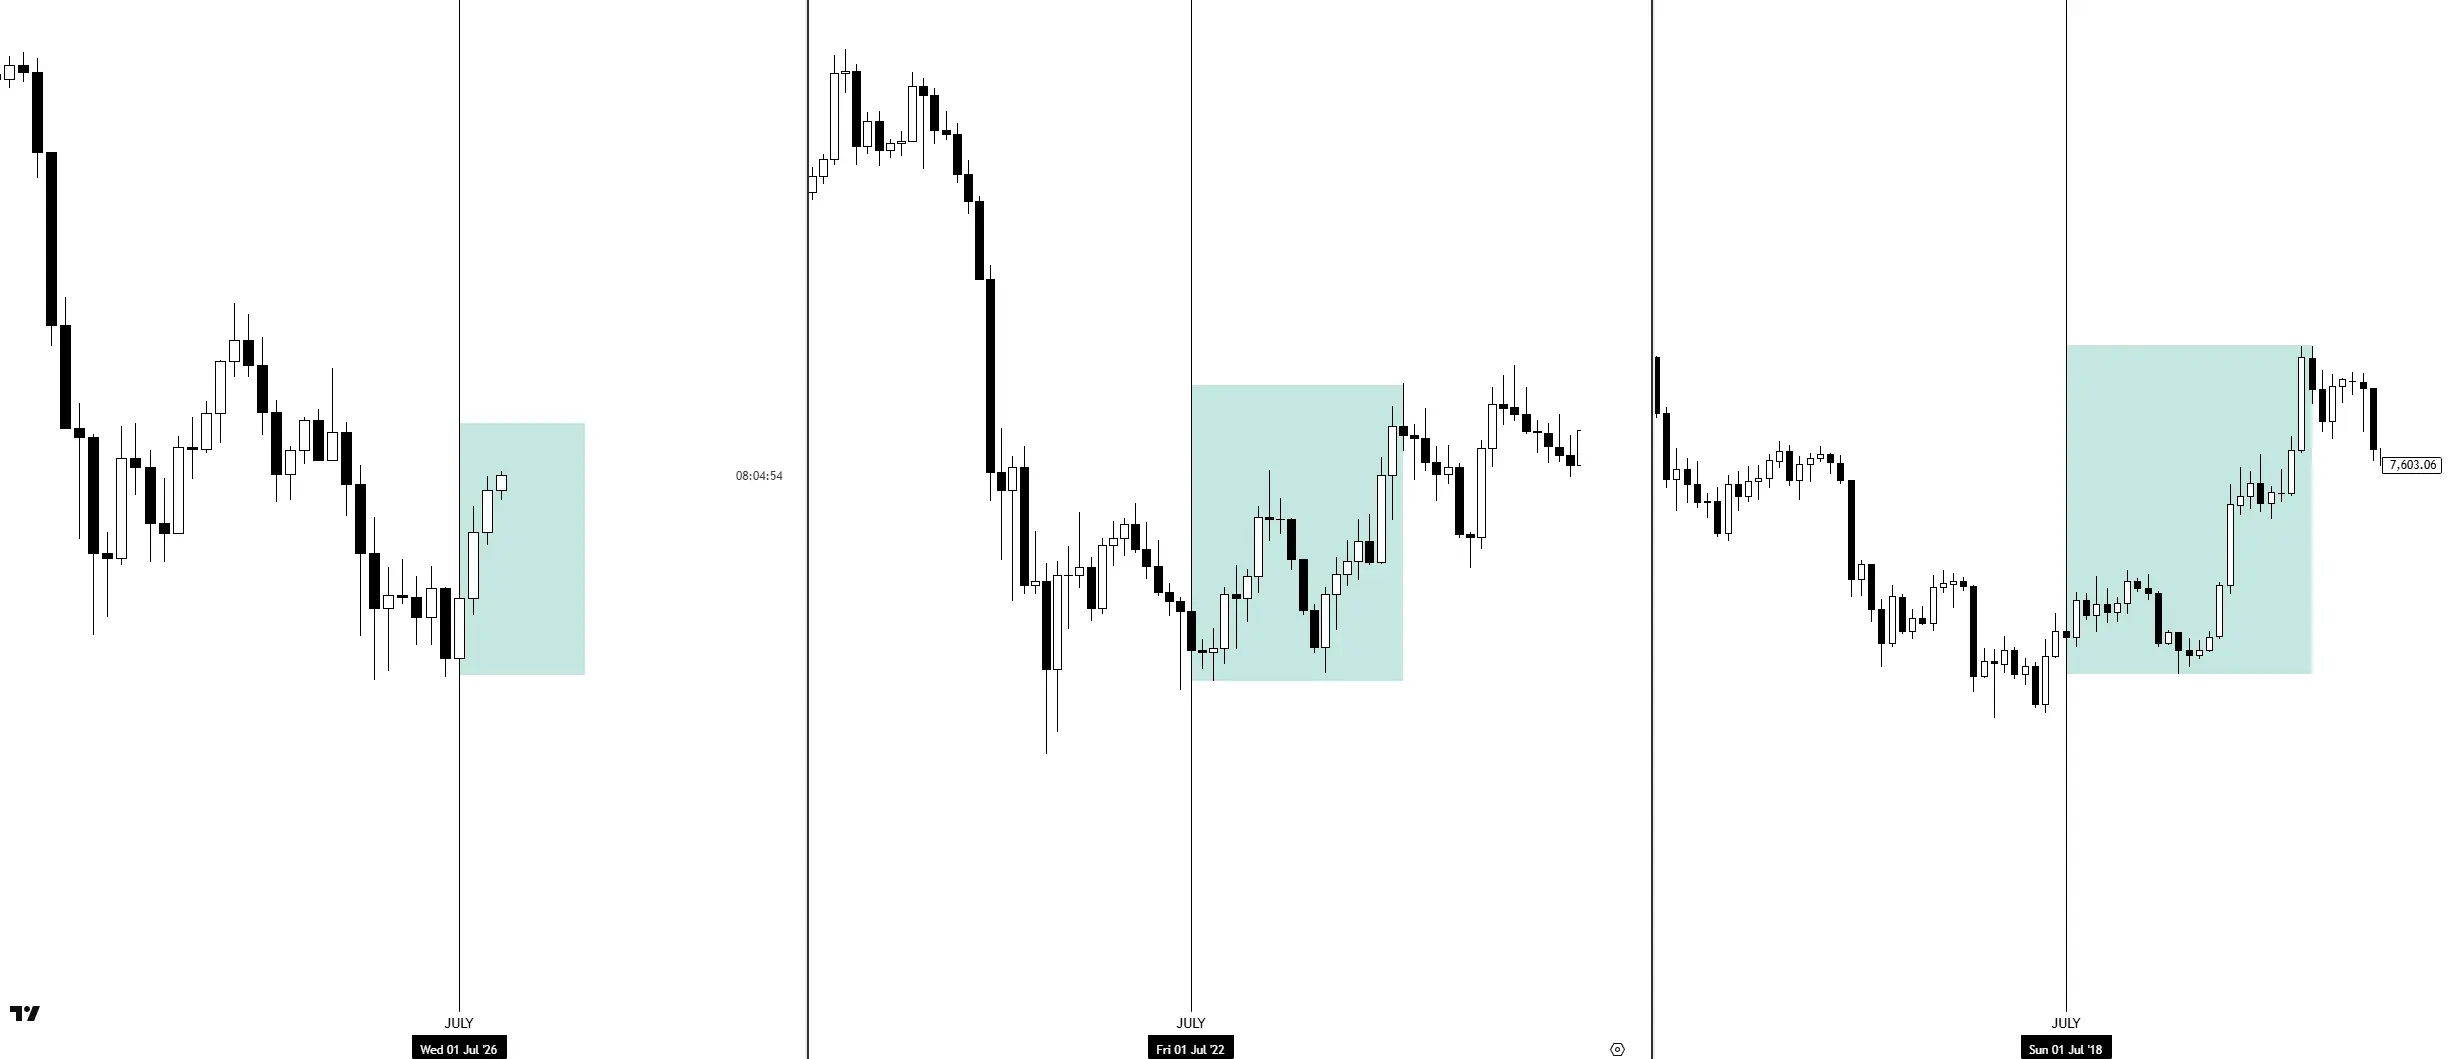
$BTC We're seeing an early July pump, similar to what we saw during the 2018 and 2022 bear markets.
In both cases, the rally ultimately formed a lower high on the LTF.
I'm bullish on the HTF, but major bottoms have historically taken time to develop. aka. more chop.
BTC1.08%
post-image
  • Reward
  • 17
  • 2
  • Share
RememberMe:
lik follow me
View More
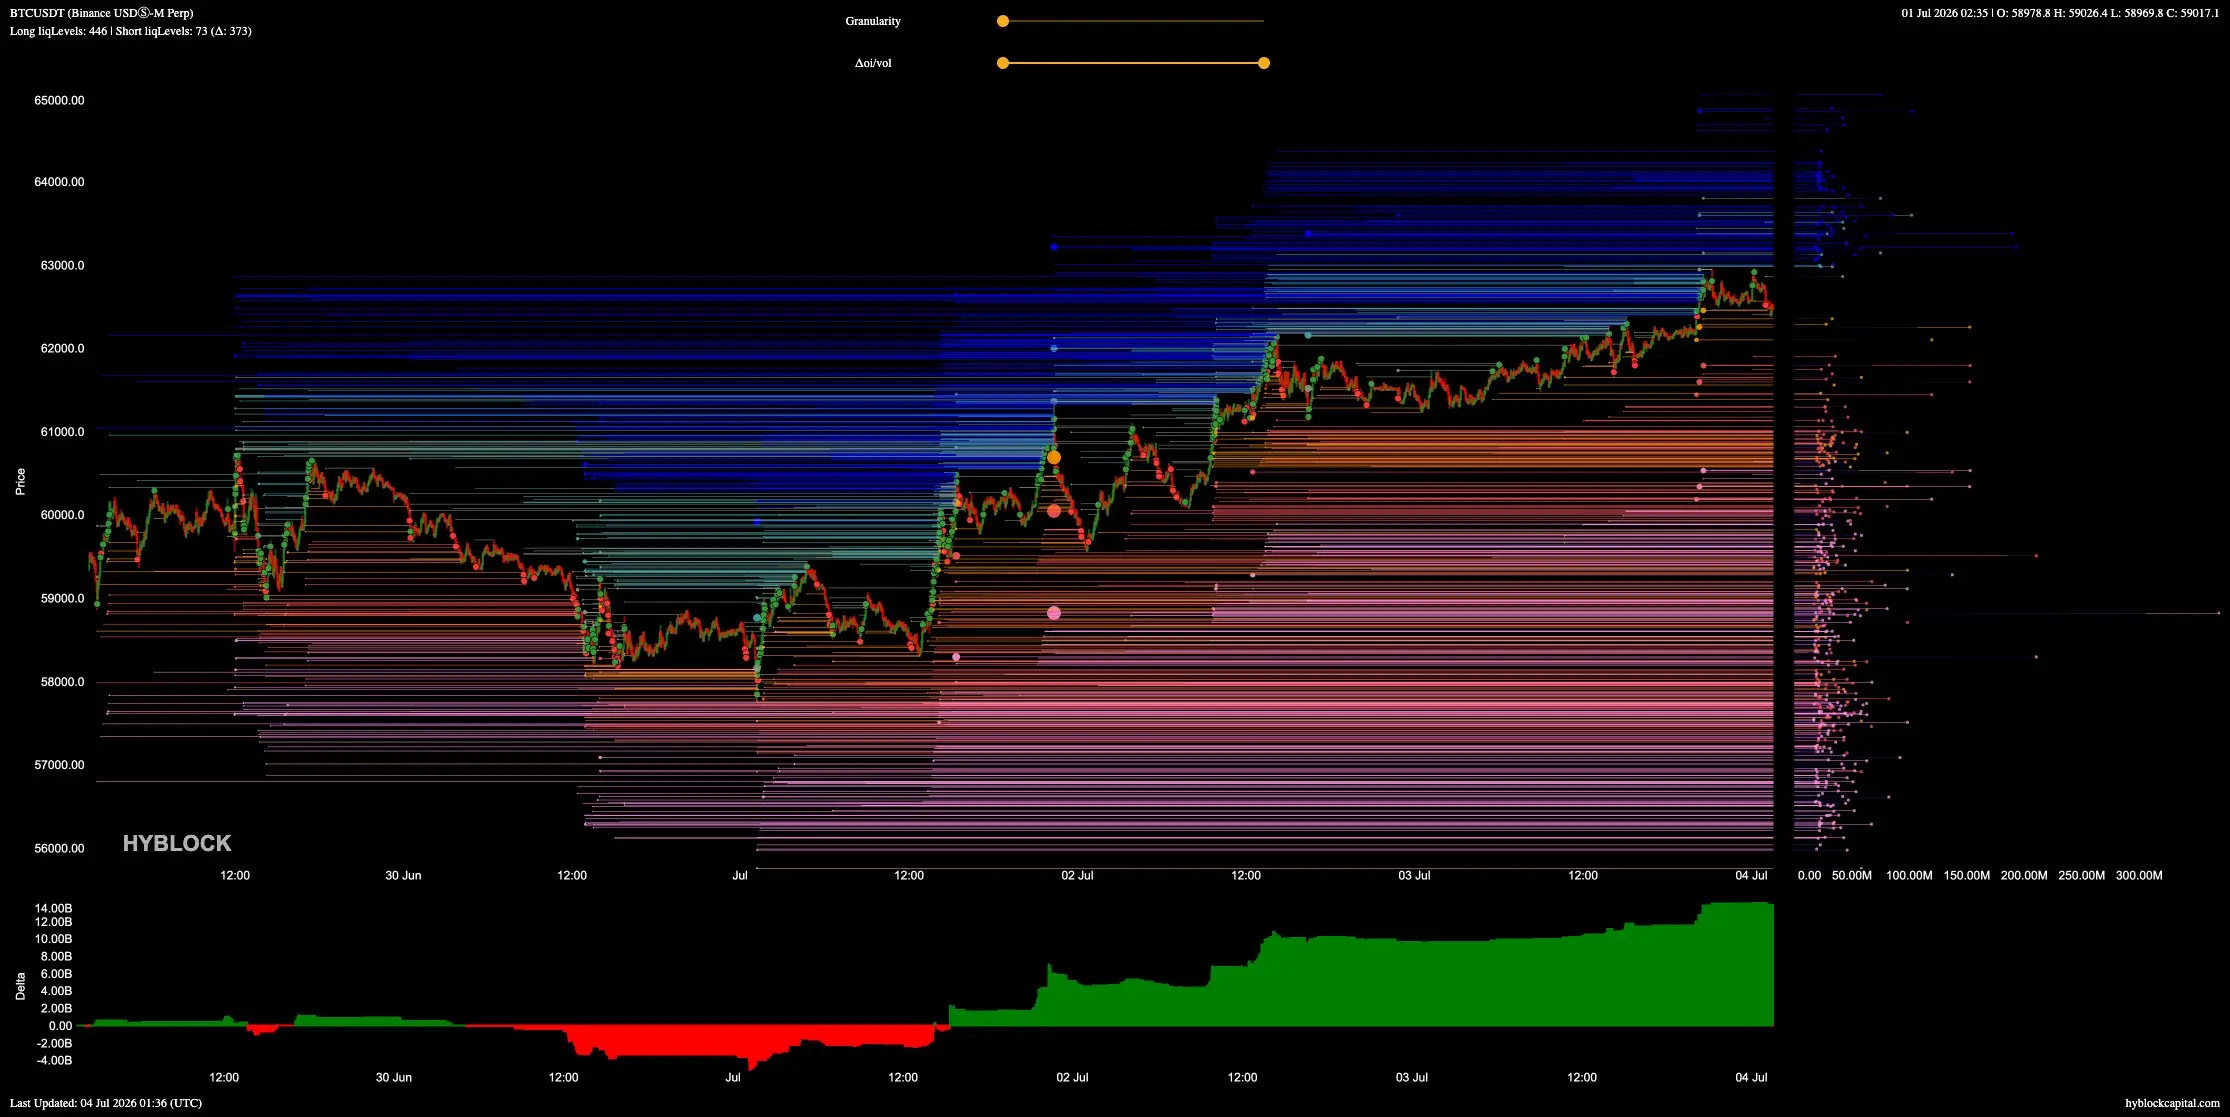
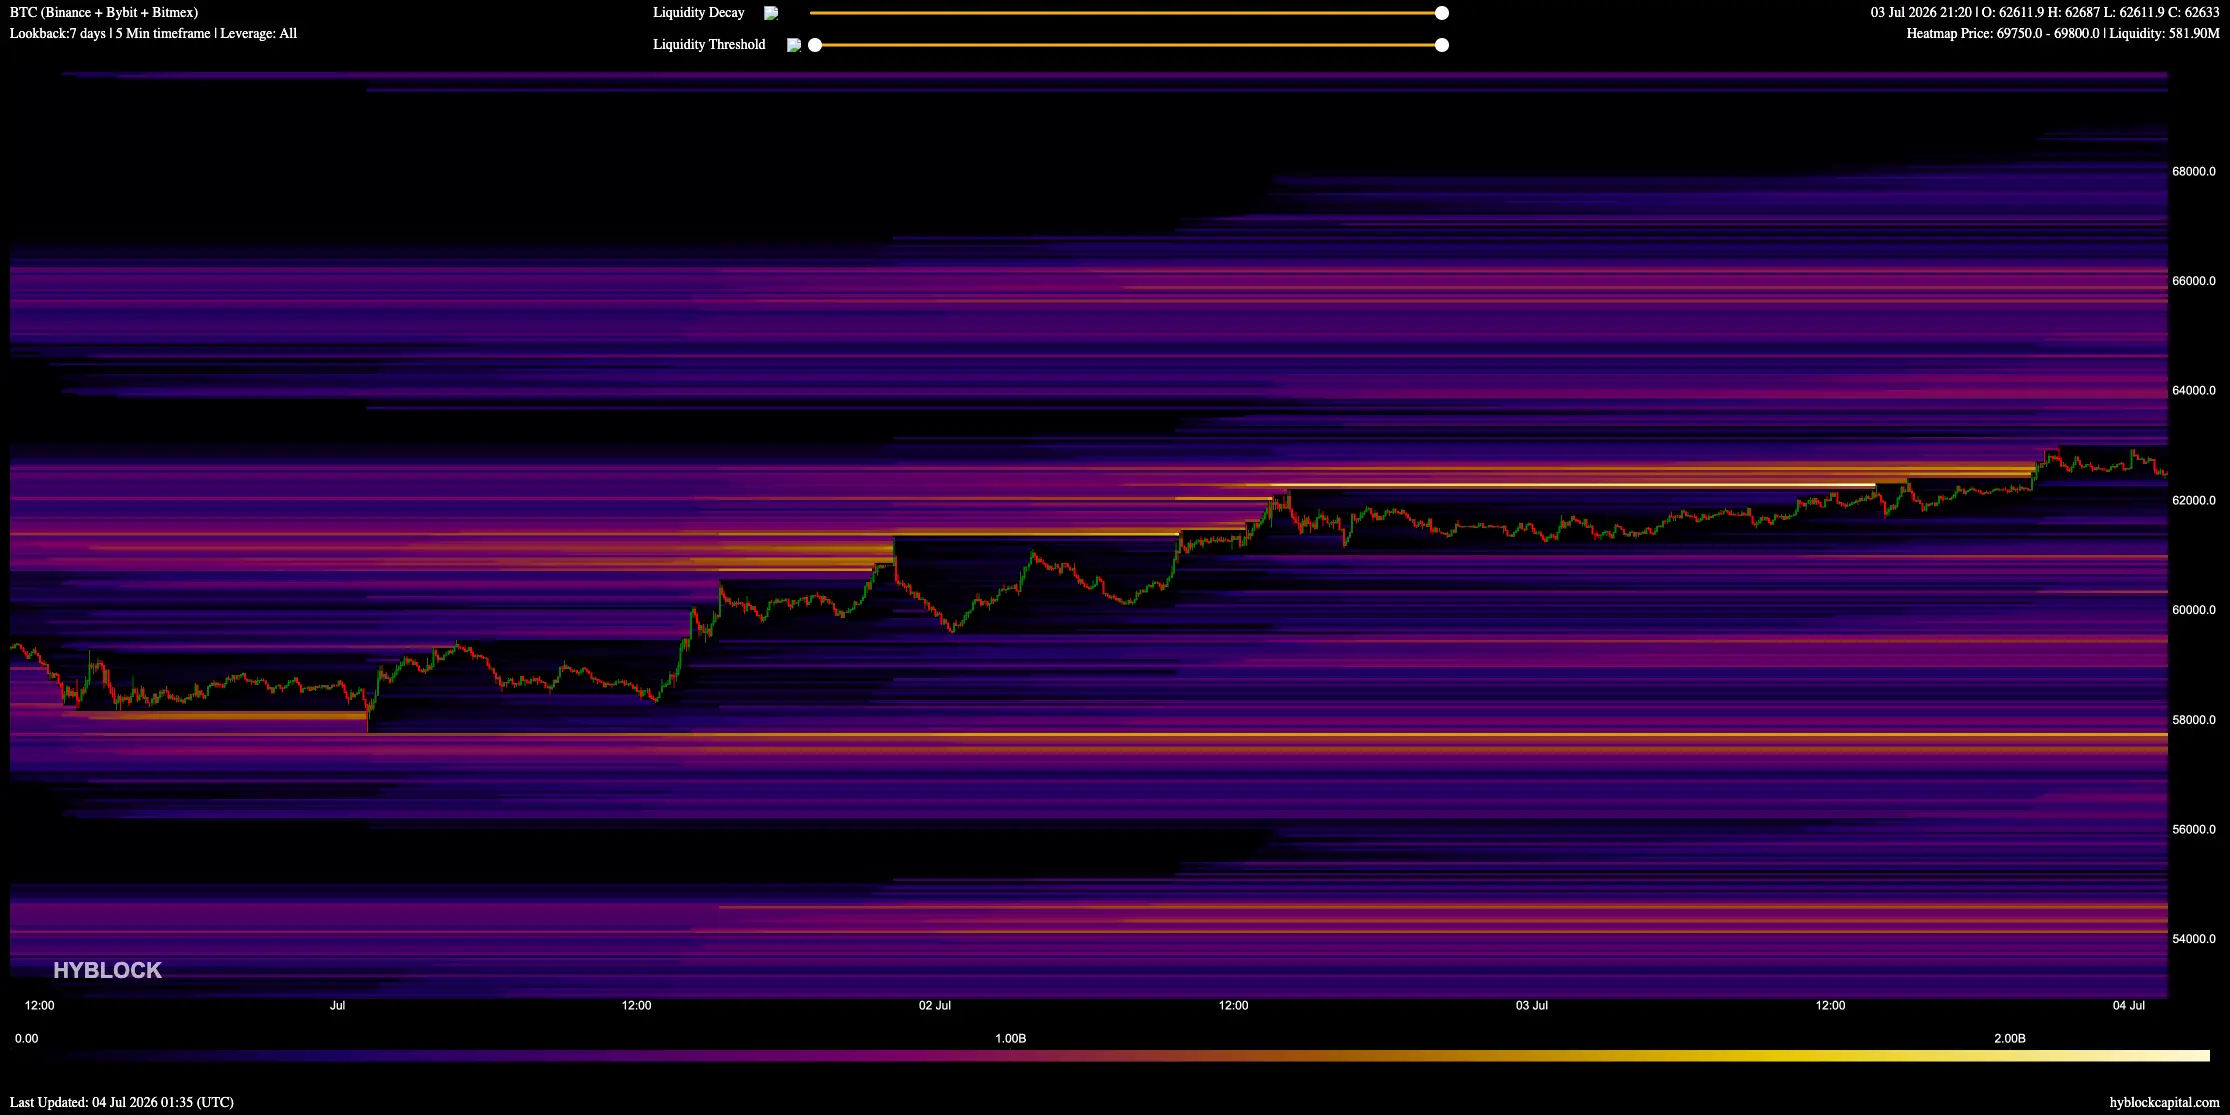
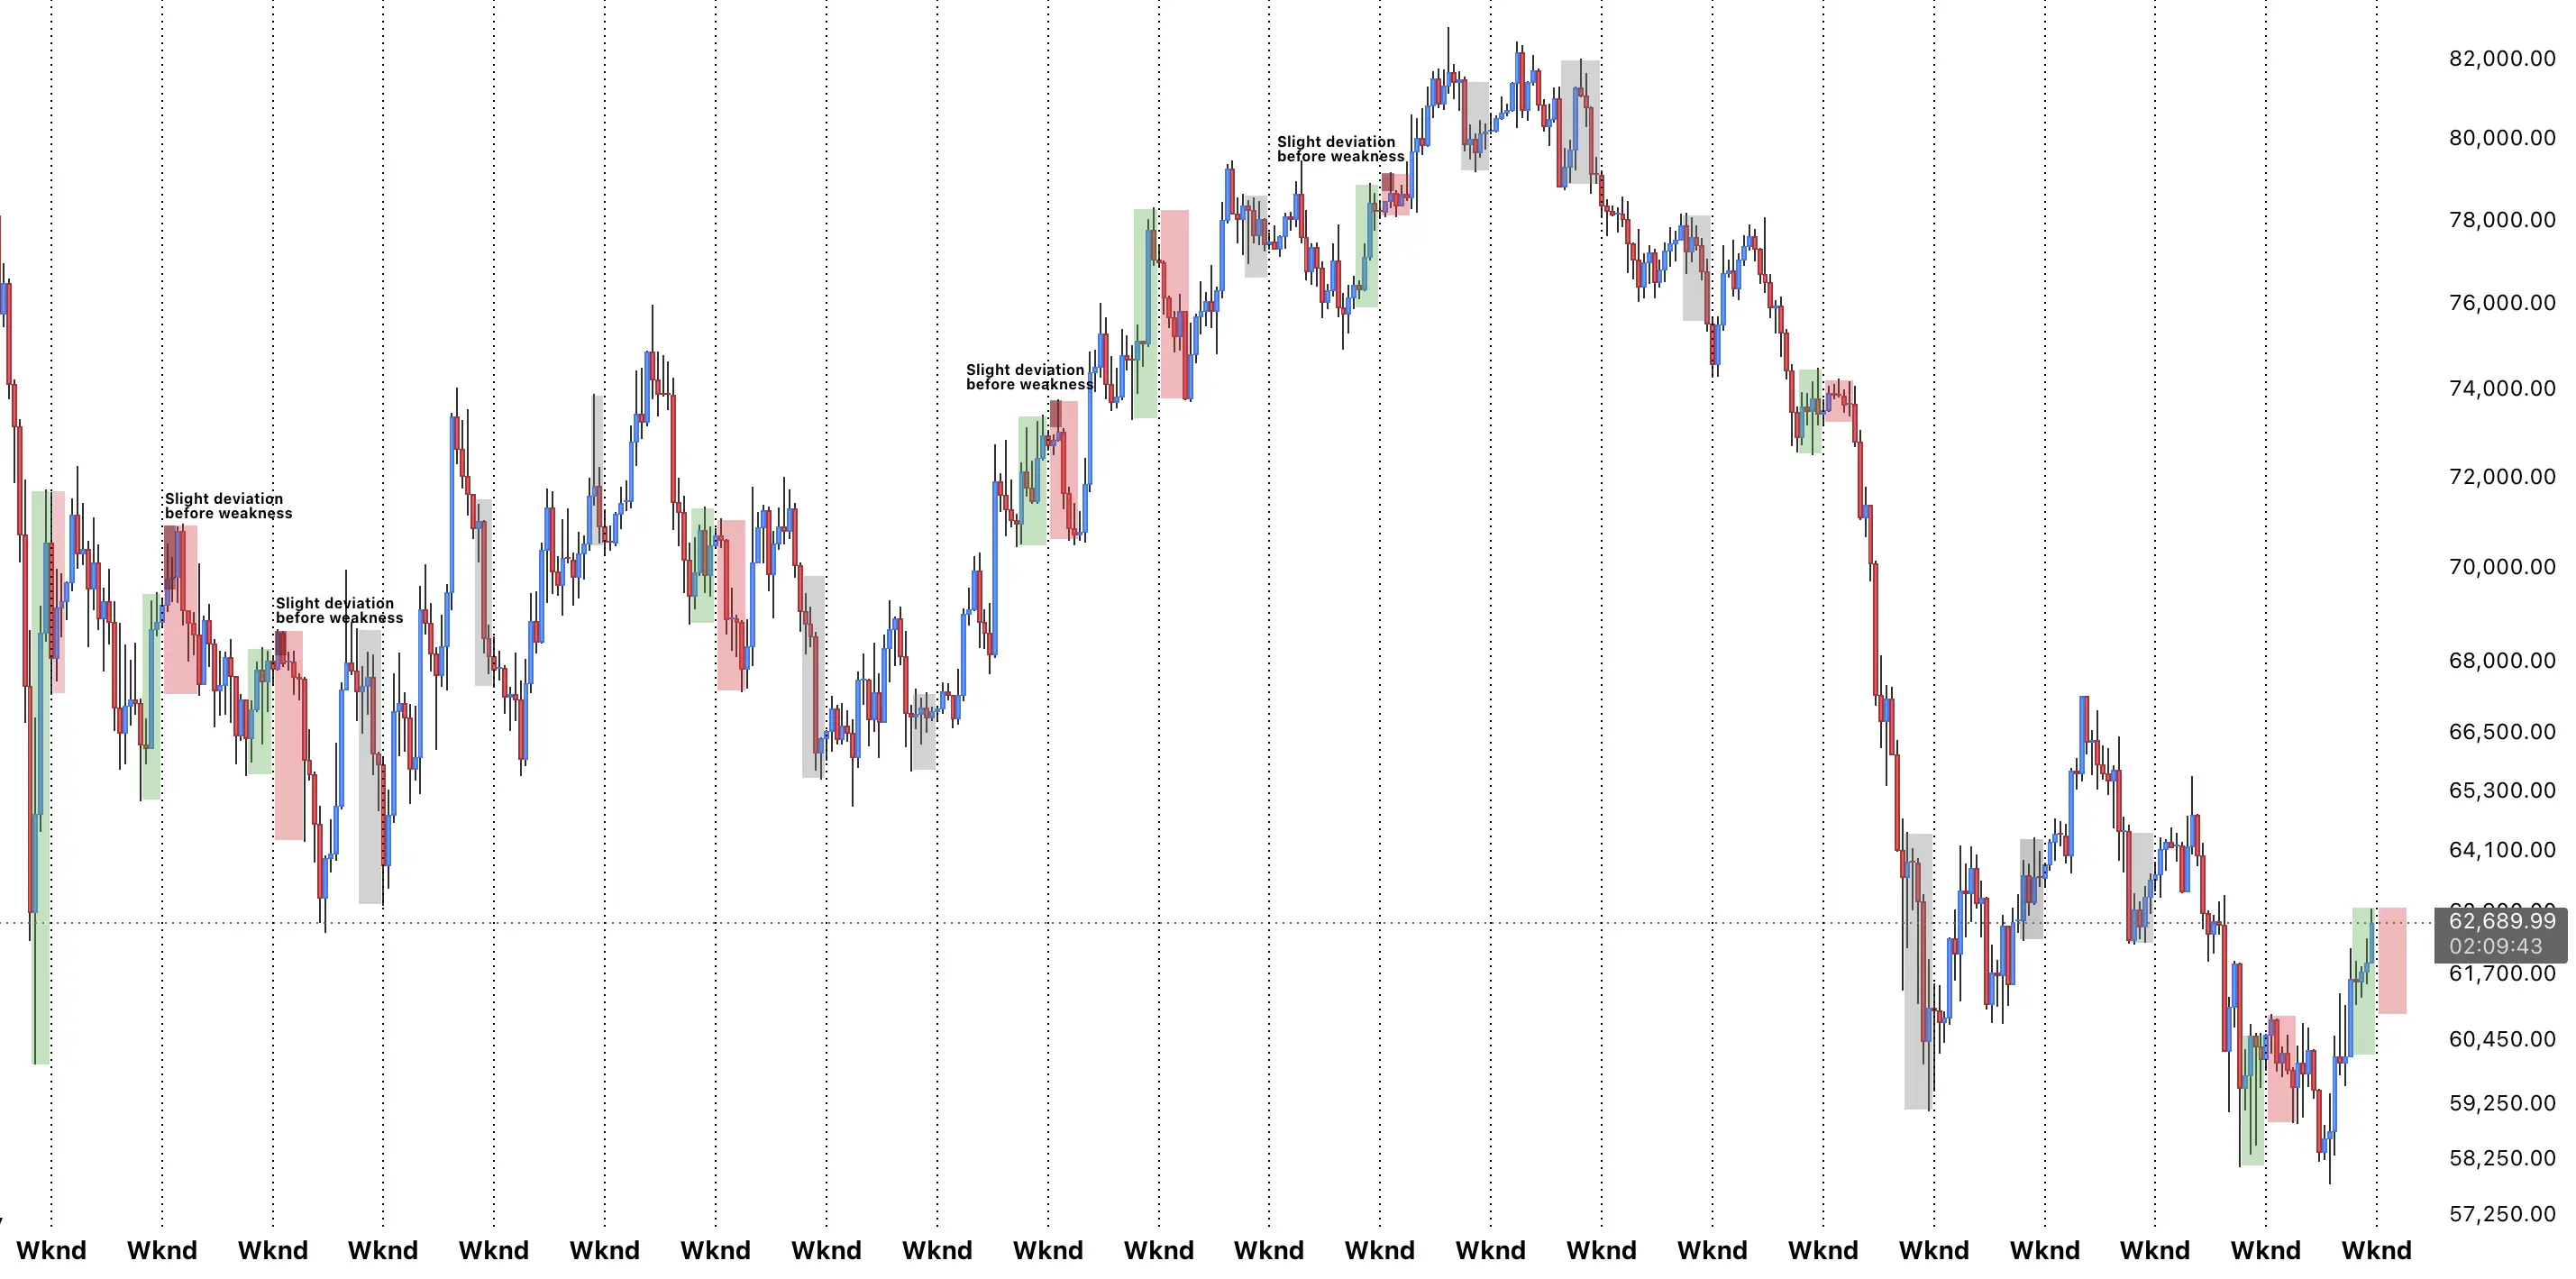
$BTC liq & positioning
Short-term, we’ve cleared most of the liquidity clusters above us.
> Long liqLevels: 446, Short liqLevels: 73
Δ: 373 (~$14B imbalance)
That doesn’t mean we immediately dump. It means leverage is building, and once selling starts, the move down can accelerate much faster.
The largest liquidity magnet is still 58.8k.
One thing to keep in mind: it’s the weekend.
Weekends usually mean more ranging and liquidity spikes, making positioning below current price more interesting.
At the same time, flows remain bullish. In a thin weekend order book, even relatively small buying fl
BTC1.08%
post-image
post-image
  • Reward
  • 5
  • 1
  • Share
GateUser-744c843b:
Flows are still bullish. In a thin order book, even small buy orders can push prices up. No rush to short on the left side for now.
View More
$BTC Remember...
The pattern continues to repeat. Out of the last 9 Fridays that saw strength, all 9 weekends pushed lower and closed below Friday's close.
Today is Friday. Price pushed higher...
I'm not fading a pattern that's 9/9.
BTC1.08%
post-image
  • Reward
  • 4
  • Repost
  • Share
GateUser-b4b056d3:
Friday rises, weekend falls — this script is too familiar. Wait until Sunday to see the closing line before deciding.
View More
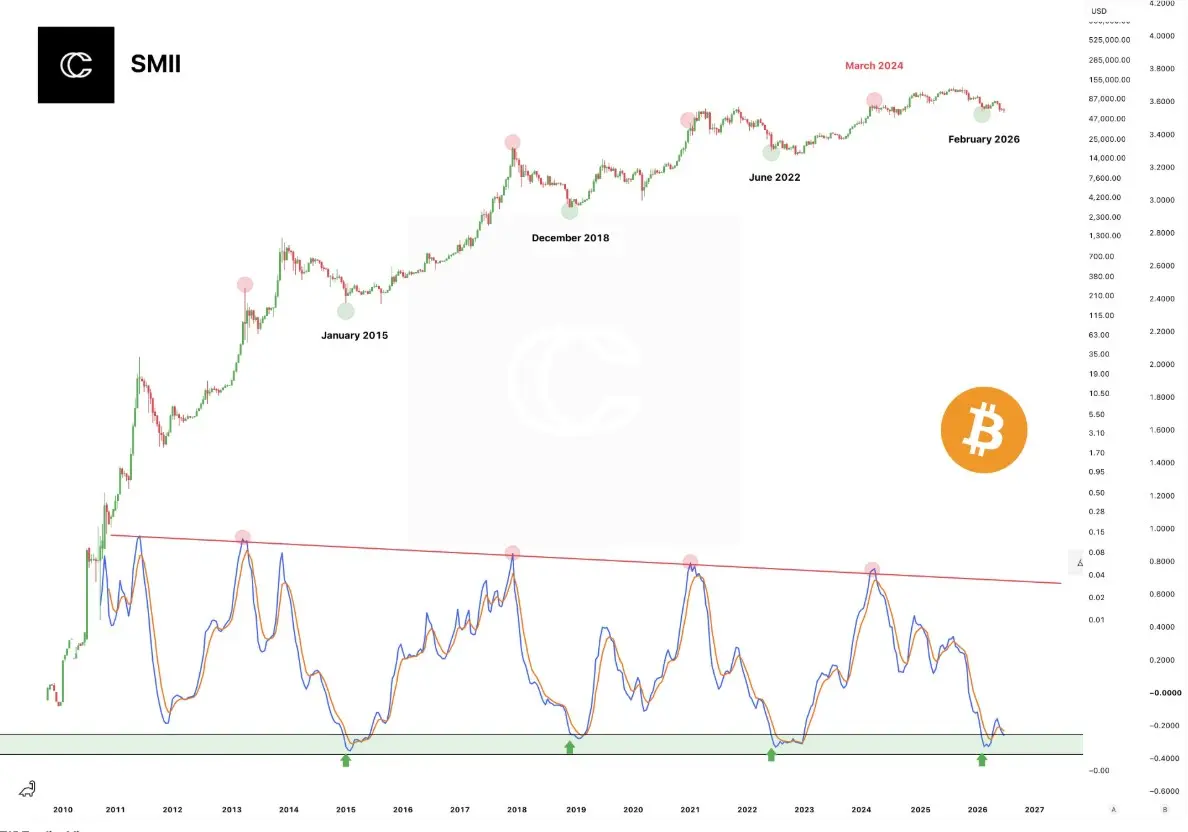
$BTC Just Flashed One of Its Rarest Macro Buy Signals
The SMII oscillator has once again entered its historical accumulation zone, a region that has consistently marked major cycle bottoms in 2015, 2018, 2022, and now 2026. Each previous visit to this level preceded a powerful expansion phase, while every macro peak formed with progressively weaker momentum, creating a clear long term bearish divergence across multiple market cycles.
This combination of declining momentum at cycle highs and repeated oversold resets suggests that Bitcoin is transitioning through a late cycle correction rather t
BTC1.08%
post-image
  • Reward
  • 18
  • 1
  • Share
LighthouseInTheMist:
History never guarantees repetition, but you have to be present when it rhymes. The risk-reward ratio is right here. Fear is fear, but your position must be honest.
View More
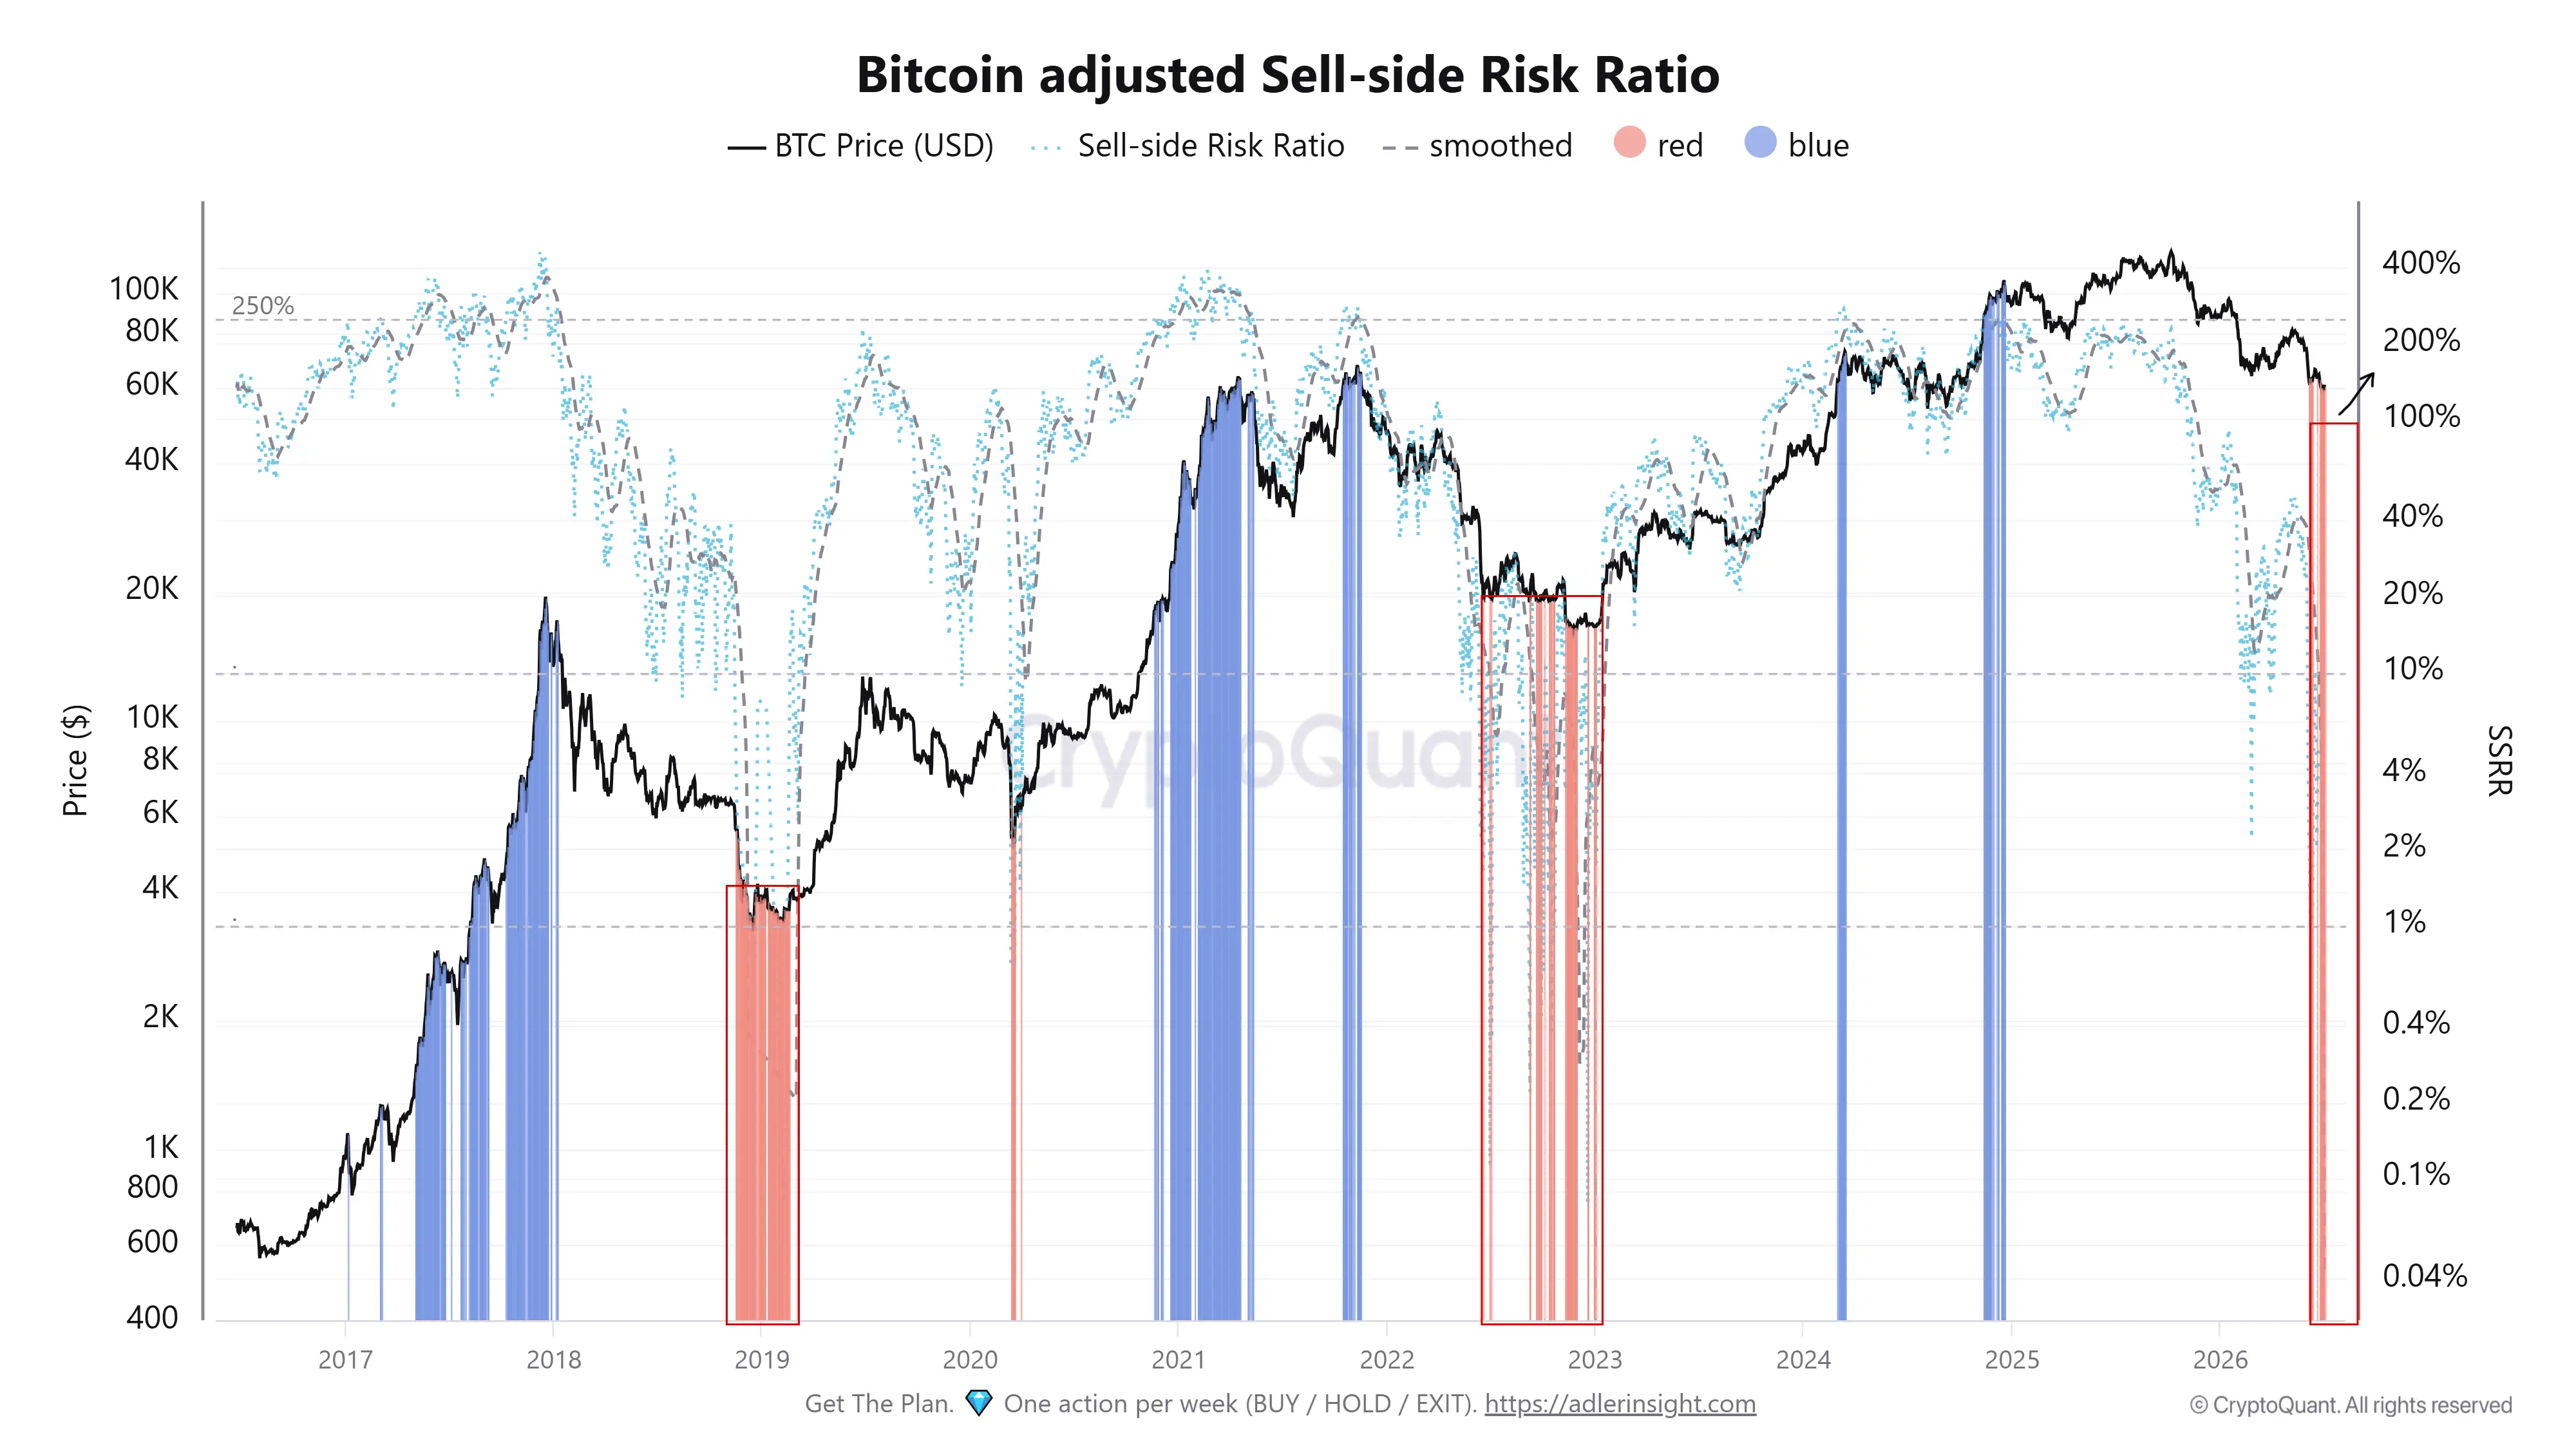
Bitcoin Sell-side Risk Ratio Enters Historical Accumulation Zone
$BTC Adjusted Sell-side Risk Ratio (aSSRR) has once again fallen into an extreme low zone a level that has repeatedly marked periods of accumulation before the next major bullish expansion. Historically, similar readings appeared in early 2019, late 2020, early 2023, and during several consolidation phases that ultimately preceded strong upward trends. The current structure suggests the market is approaching another critical inflection point.
A depressed Sell-side Risk Ratio indicates that realized profits and losses have become
BTC1.08%
post-image
  • Reward
  • 8
  • 1
  • Share
DustCollector7:
The Sell-side Risk Ratio has entered an extremely low zone. In simple terms, no one wants to sell; the chips are all held by diamond hands, waiting for the wind to come.
View More
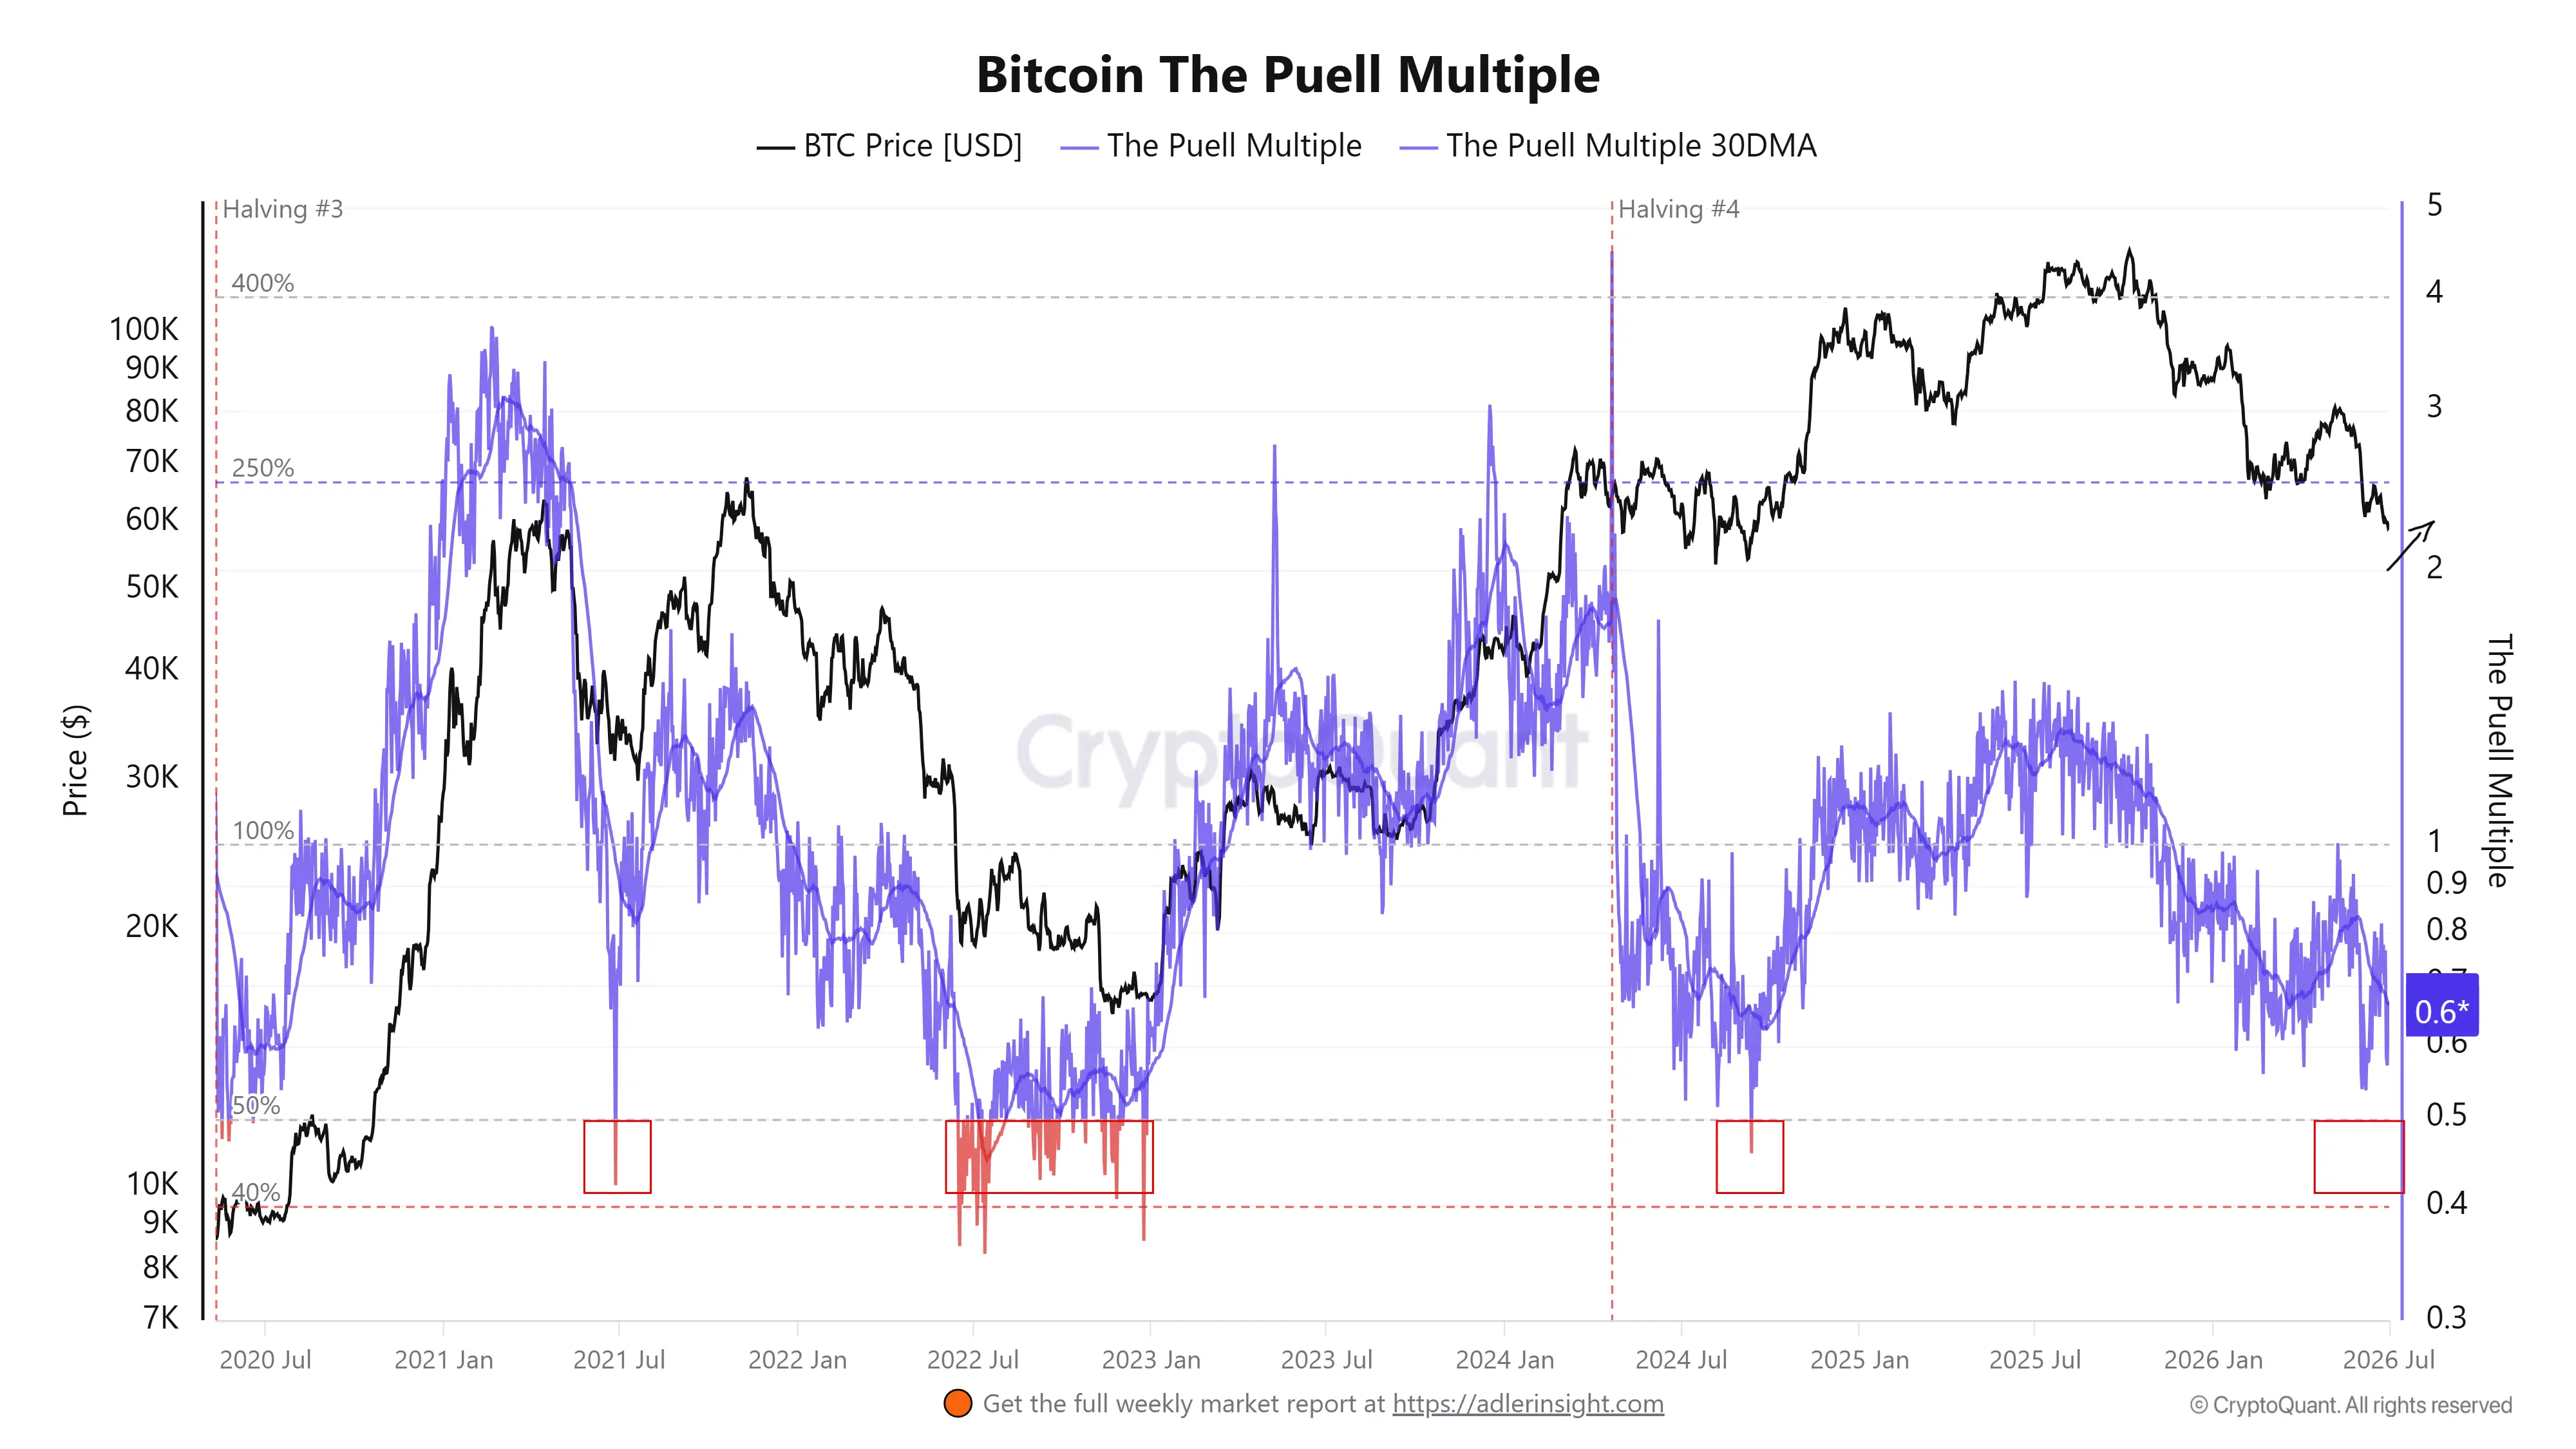
Bitcoin Miners Continue to Hold Back Distribution as Puell Multiple Revisits Historical Accumulation Zone
The latest reading of the Puell Multiple has declined to around 0.6, placing the indicator back inside a zone that has historically coincided with periods of miner revenue compression. From an on-chain perspective, this reflects that miners are earning significantly less in USD relative to the annual average, reducing the incentive to aggressively distribute newly mined BTC into the market.
Looking across previous cycles, every major drop of the Puell Multiple below 0.5–0.6 has appeared du
BTC1.02%
post-image
  • Reward
  • 3
  • 2
  • Share
GateUser-170ee8b1:
Waiting for a confirmation signal, miner capitulation is often a prelude to the final drop.
View More
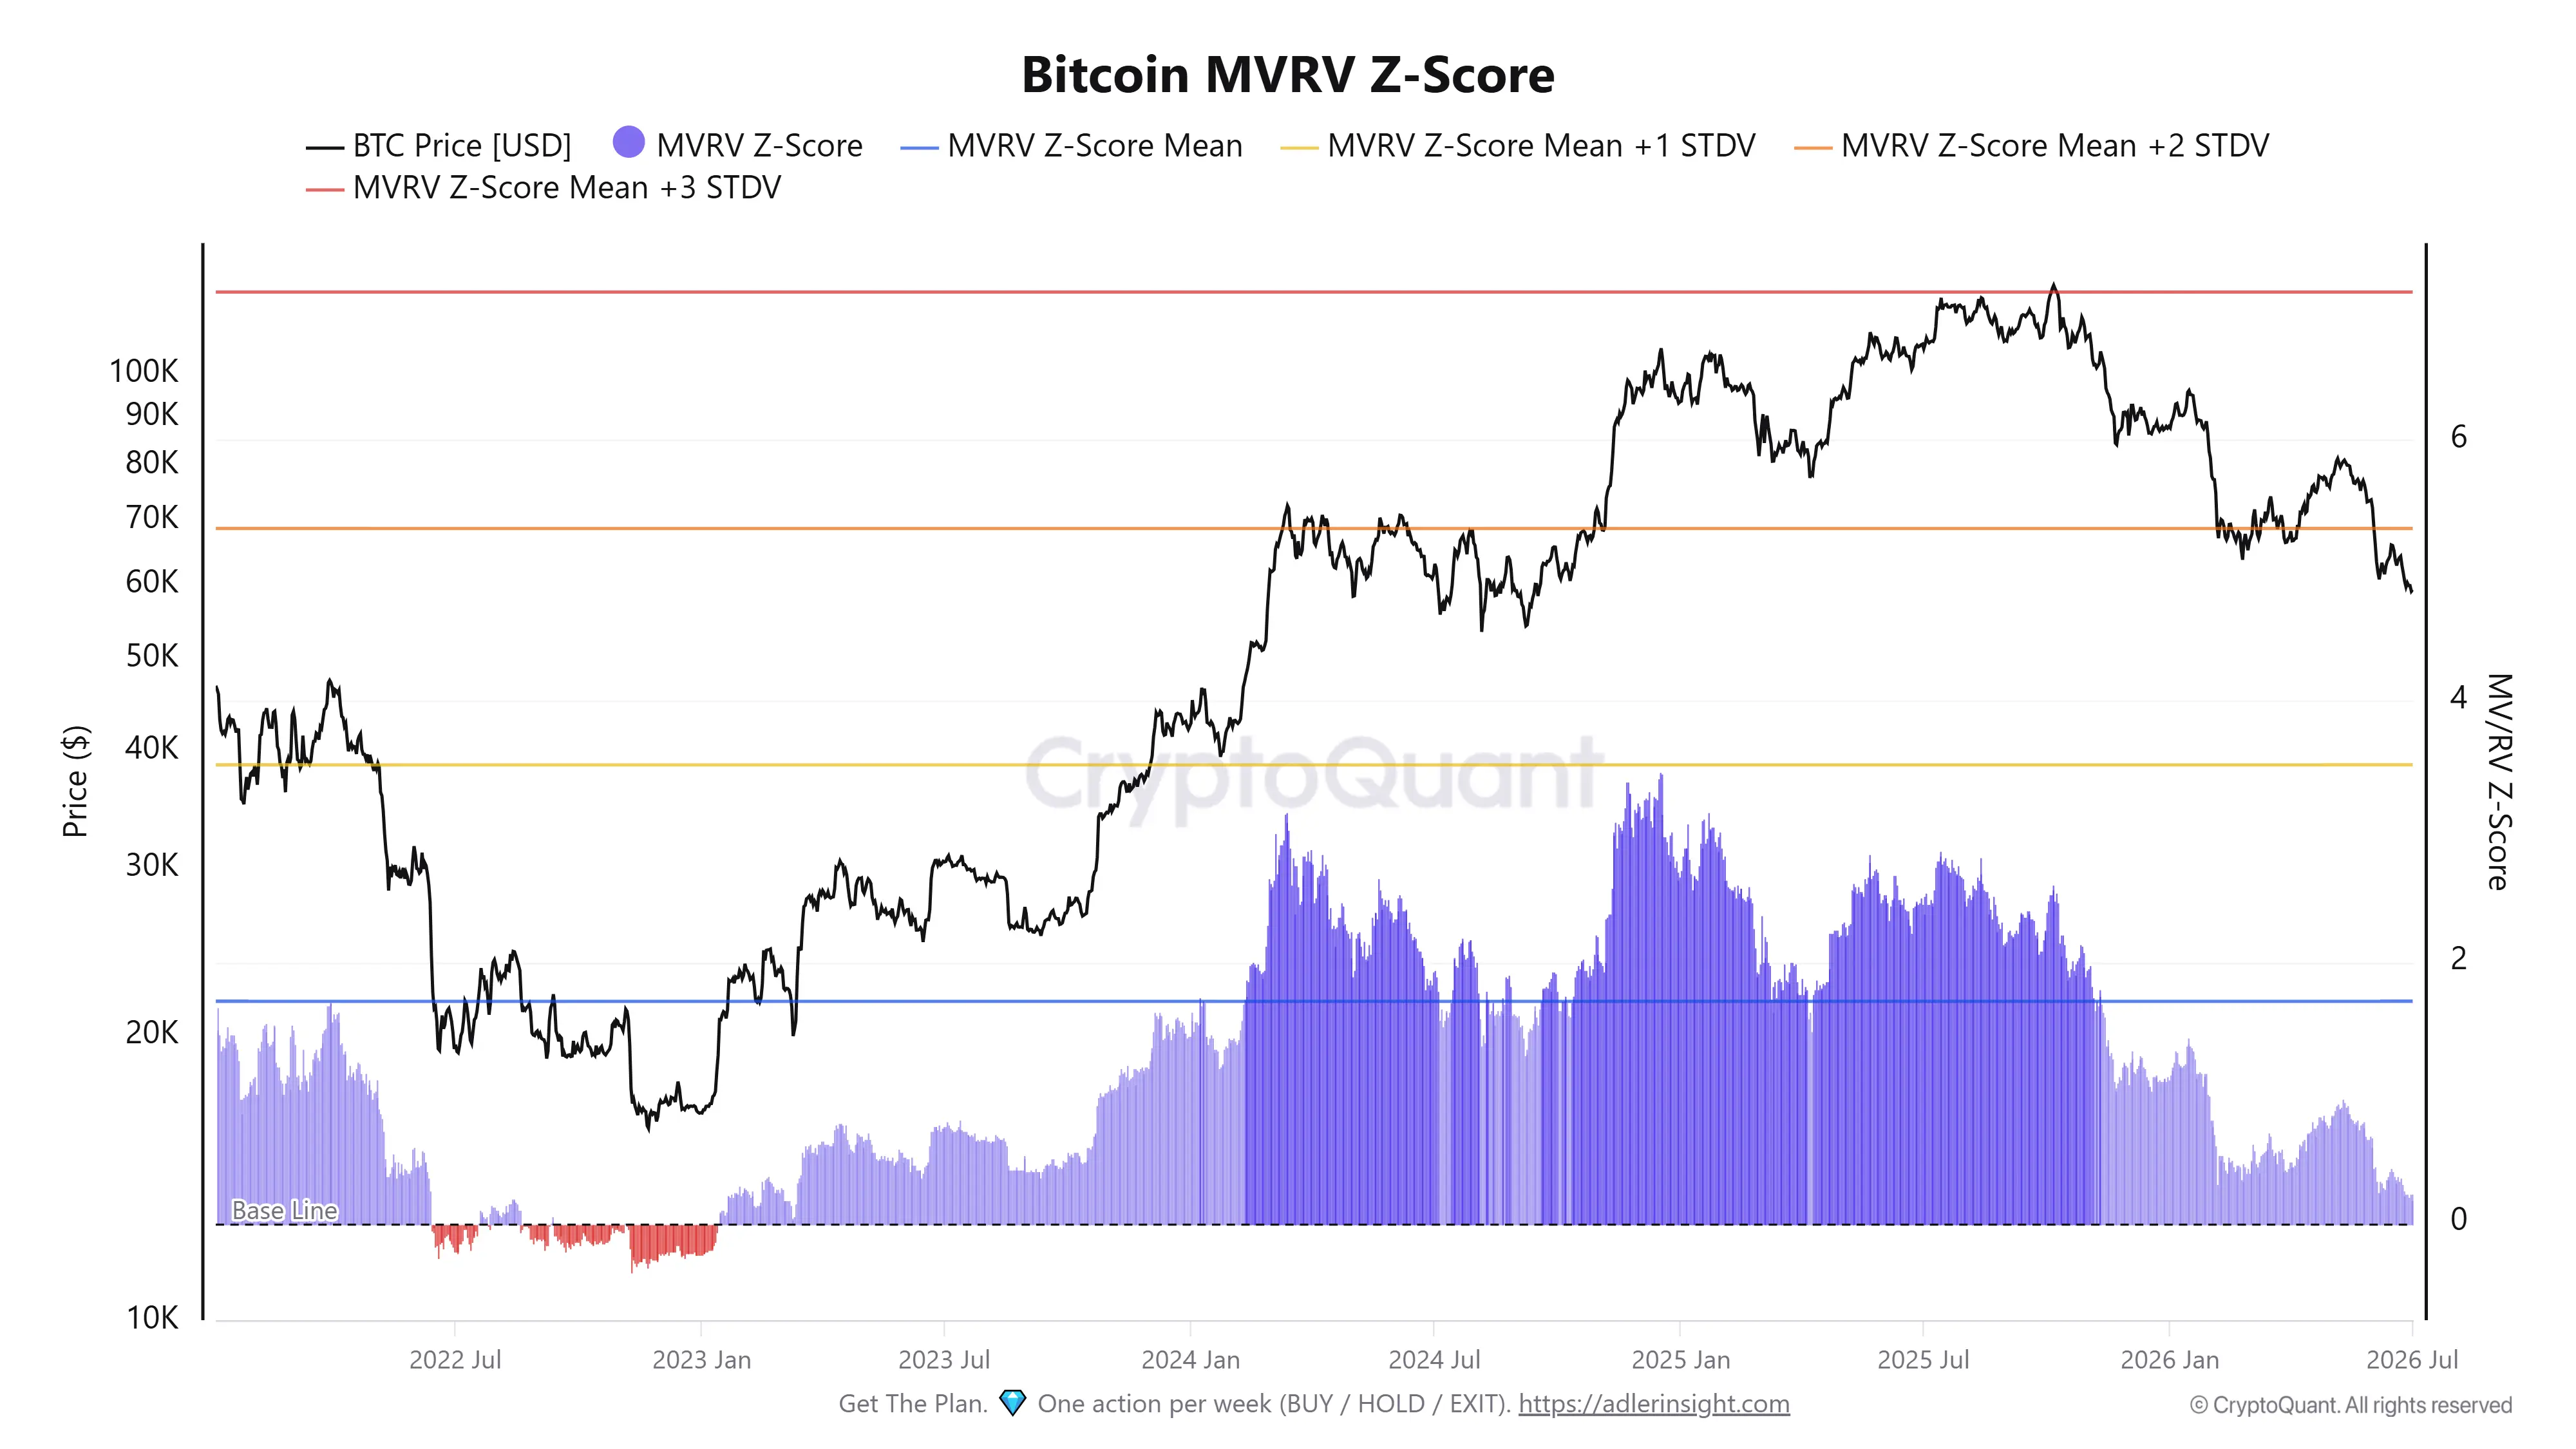
Bitcoin MVRV Z-Score Falls Below +2σ: Valuation Premium Is Cooling, Not Collapsing
$BTC MVRV Z-Score has now dropped below the +2 standard deviation threshold after spending much of the previous cycle in elevated territory. From an on-chain valuation perspective, this marks a meaningful transition. Historically, readings above +2σ indicate aggressive unrealized profit expansion across the network, while a move back below that level reflects a normalization of valuation rather than an immediate bear market signal.
The current decline is notable because it has occurred alongside sustained price
BTC1.08%
post-image
  • Reward
  • 12
  • 1
  • Share
LeverageWhisperer:
I've been watching this indicator for half a year, and now it's a typical halftime break, not the endgame.
View More
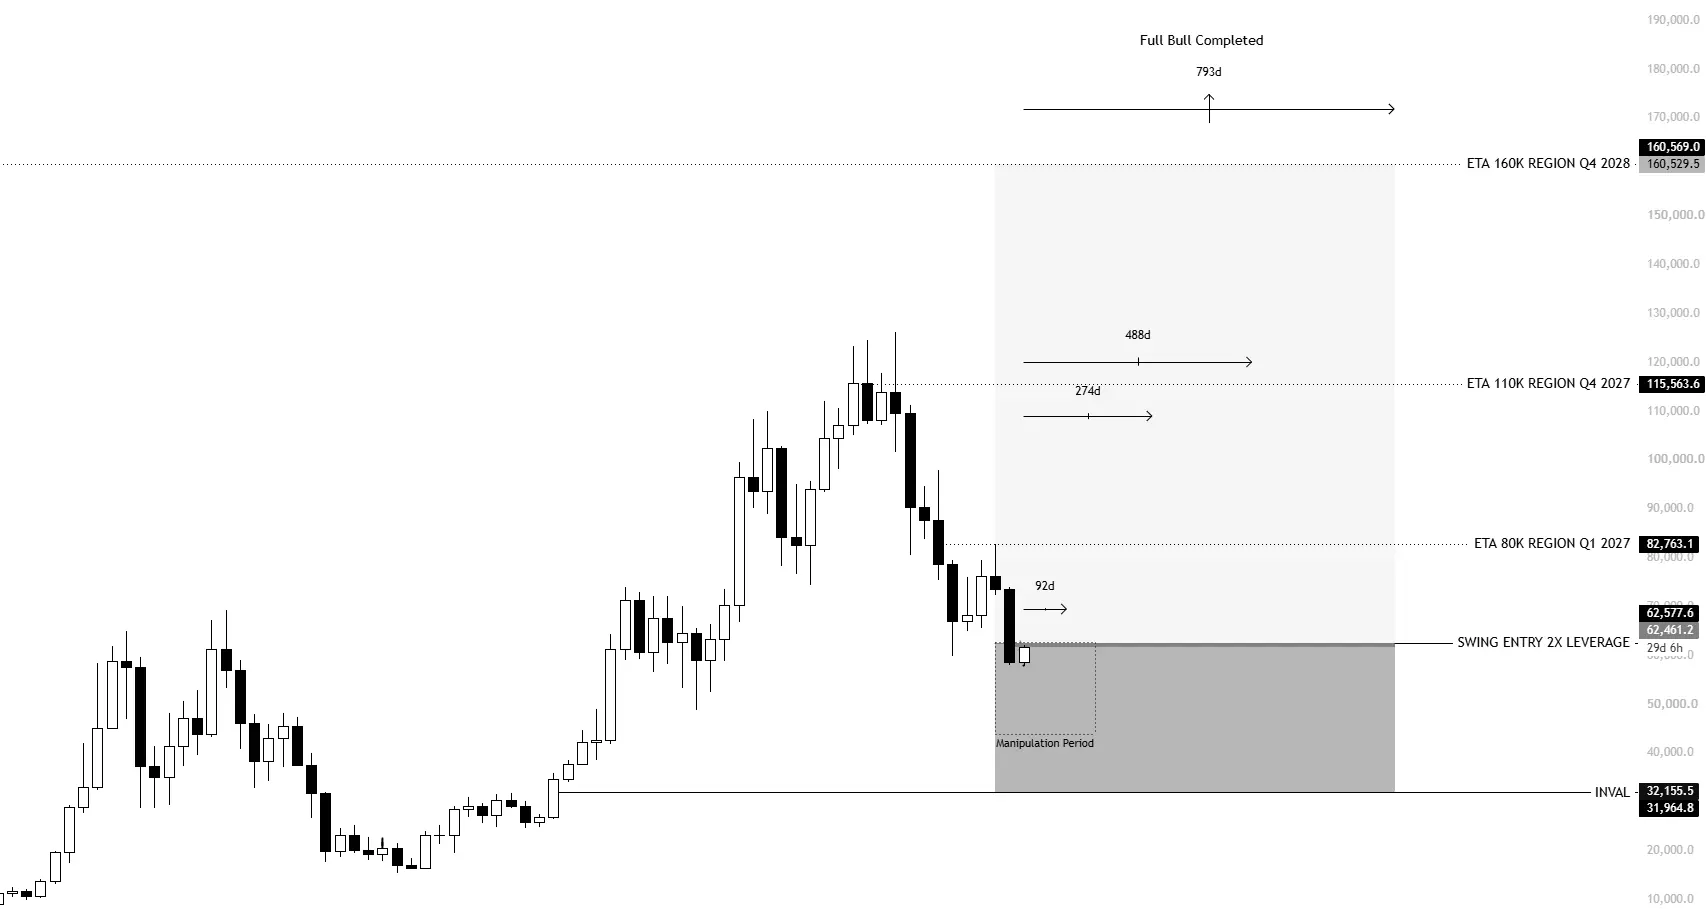
Nothing has changed with my $BTC swing long.
I'm expecting to hold this for 1.5–2 years.
I expect BTC above 80K in Q1 next year, and above 110K around Q4 2027.
~488 days to go.
If you can't be patient, don't follow me. However, you might regret it later.
BTC1.08%
post-image
  • Reward
  • 9
  • Repost
  • Share
ContractsMustNotLie.:
The 2-year cycle perfectly coincides with the post-halving main uptrend, which is logically consistent.
View More
  • Pinned