KamileUray

vip
Age 4.7 Year
Peak Tier 0
No content yet
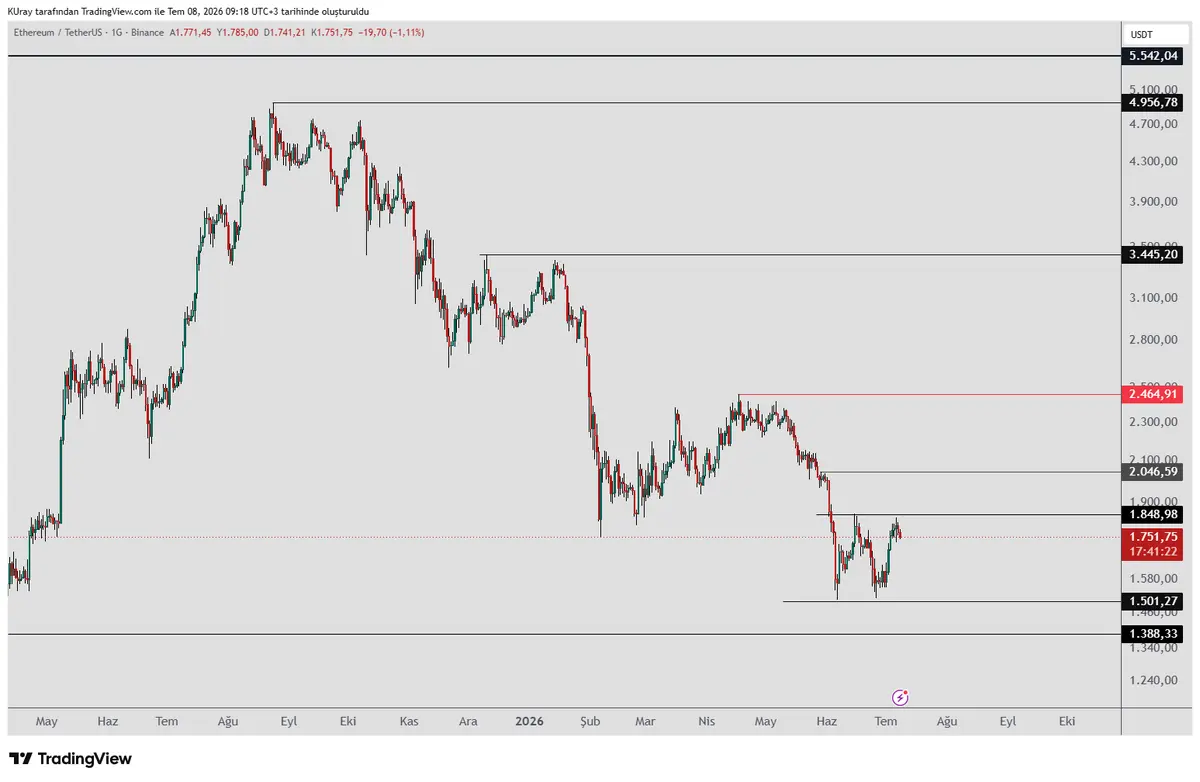
When we look at #eth, there is a possibility of a double bottom. If it stays above 1848 on the daily, a rise may come.
As long as the 1501 bottom is held, the possibility of a rise continues.
Resistances to watch
are at 2046-2464-3445-4956 levels.
ETH-1.81%
View Original
post-image
  • Reward
  • Comment
  • Repost
  • Share
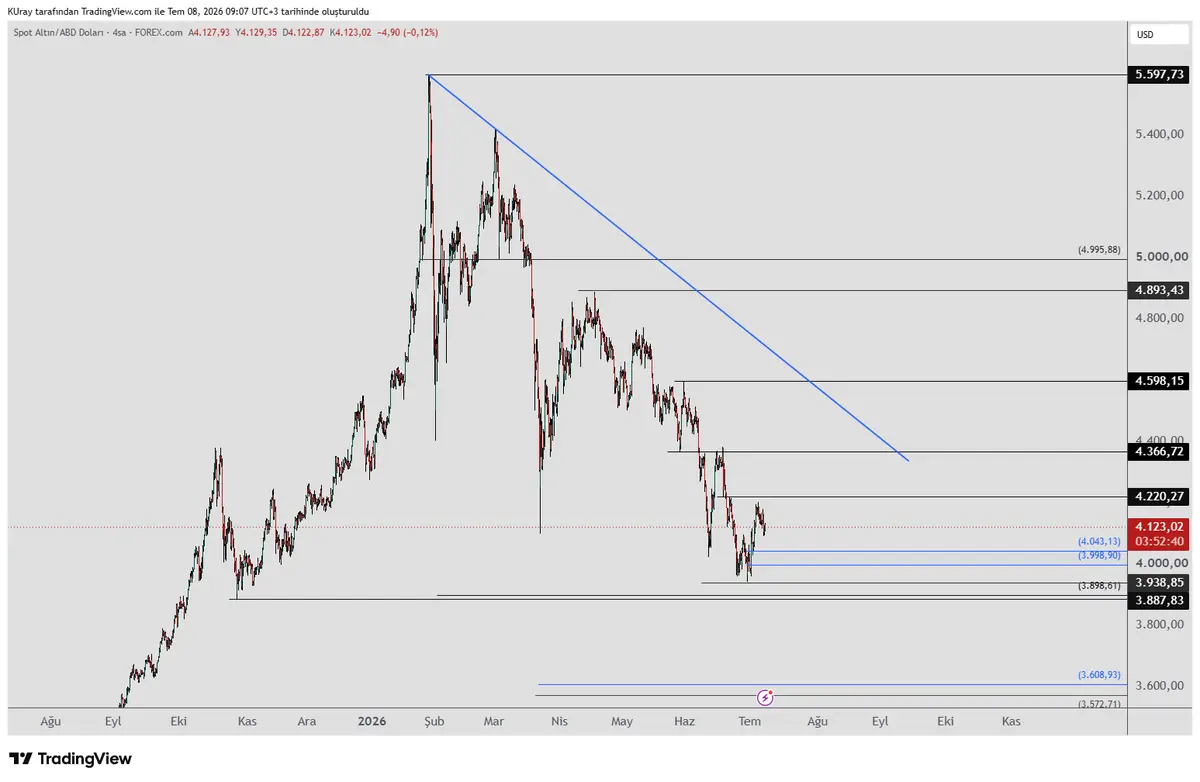
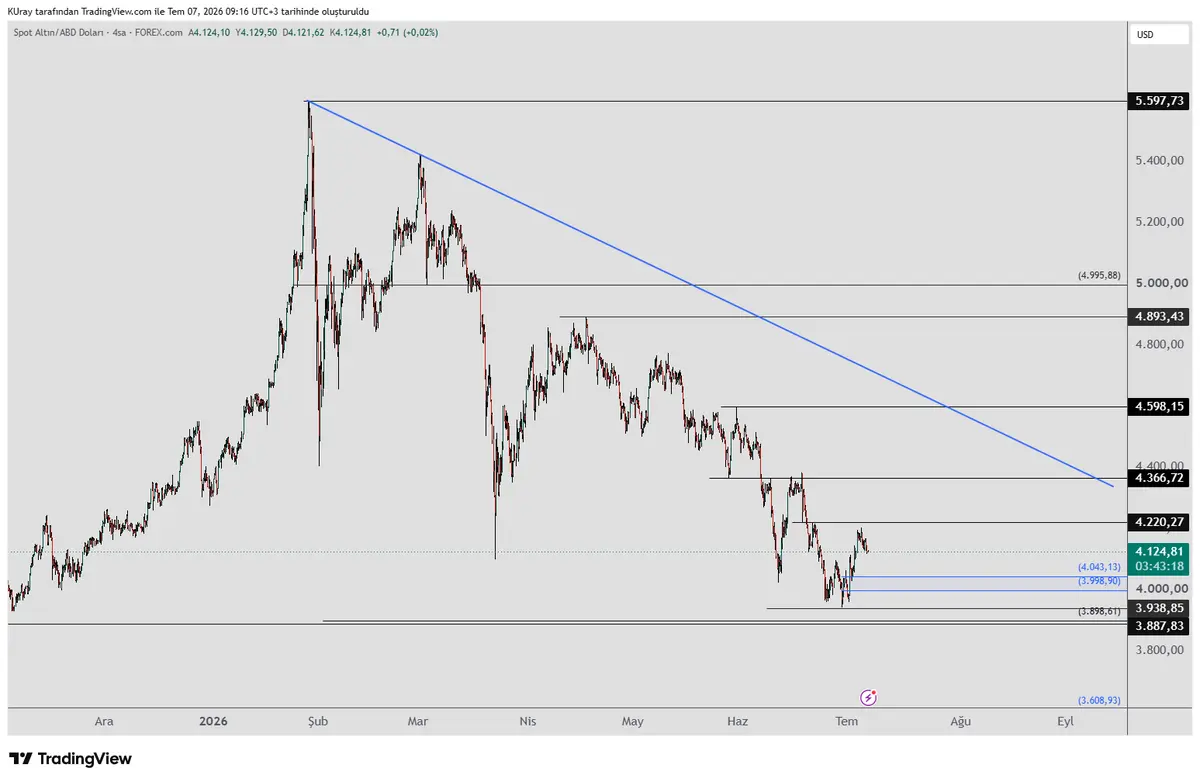
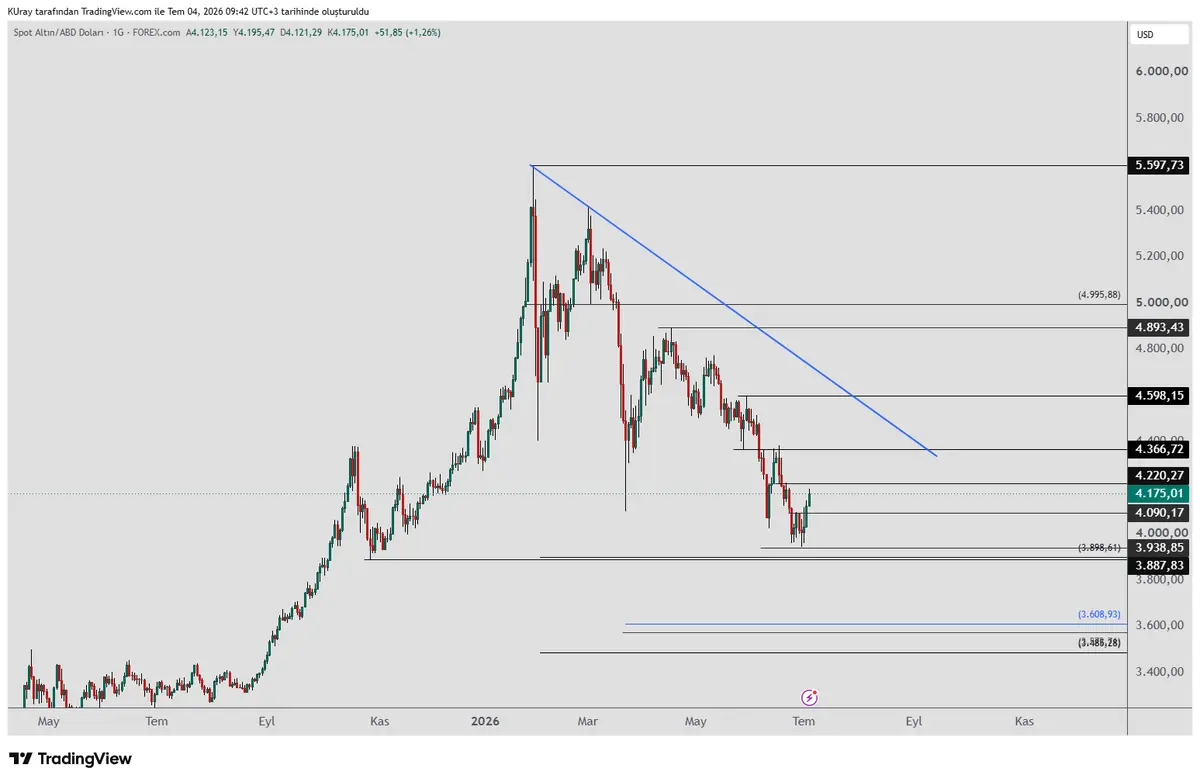
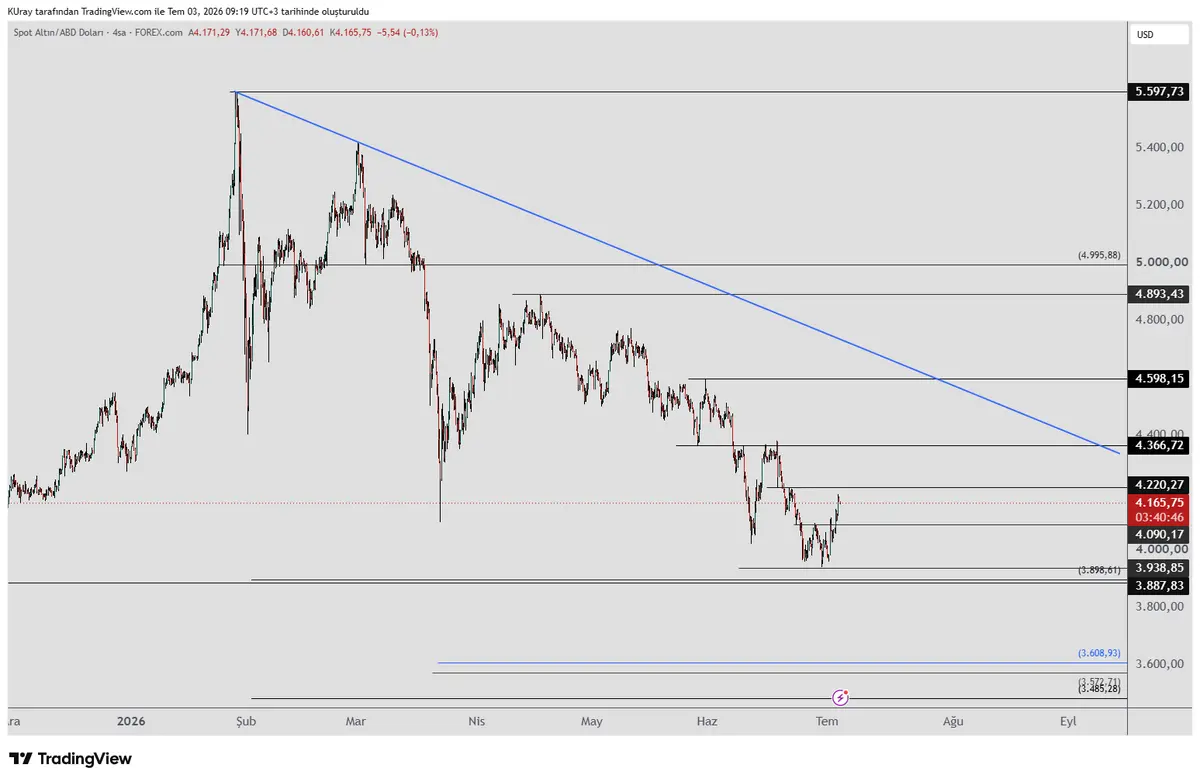
#xauusd #Gold the bottom signal formed on the daily chart continues as long as it protects the 3938 bottom.
And even if there is a pullback, the rise may continue, it is interpreted. In the pullback, the 4043-3988 region is the Fibonacci support region. There is a possibility of buyers coming from these levels.
On the 4-hour chart, we are following the resistances 4220-4336, if closings above 4366 come, the rise may continue further.
When it stays above the falling blue trend, the rise is expected to continue further. When the trend is broken, it can try the peak again.
XAUUSD0.24%
View Original
post-image
  • Reward
  • Comment
  • Repost
  • Share
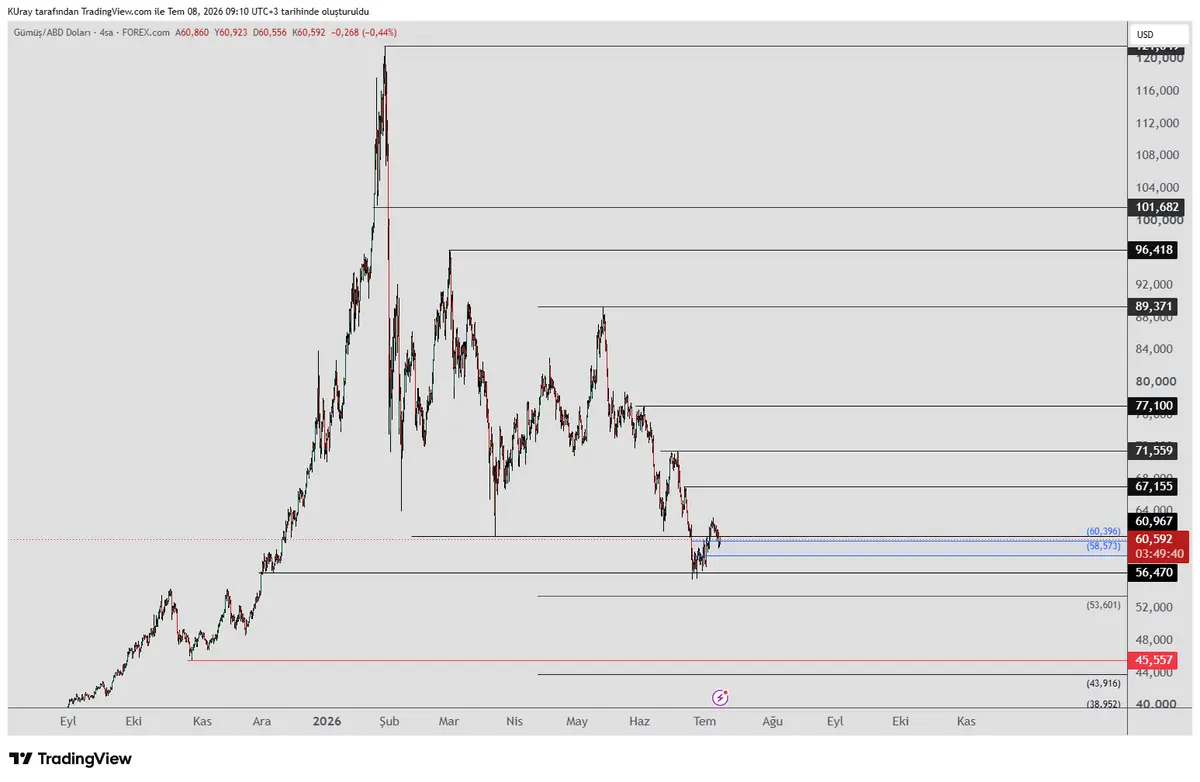
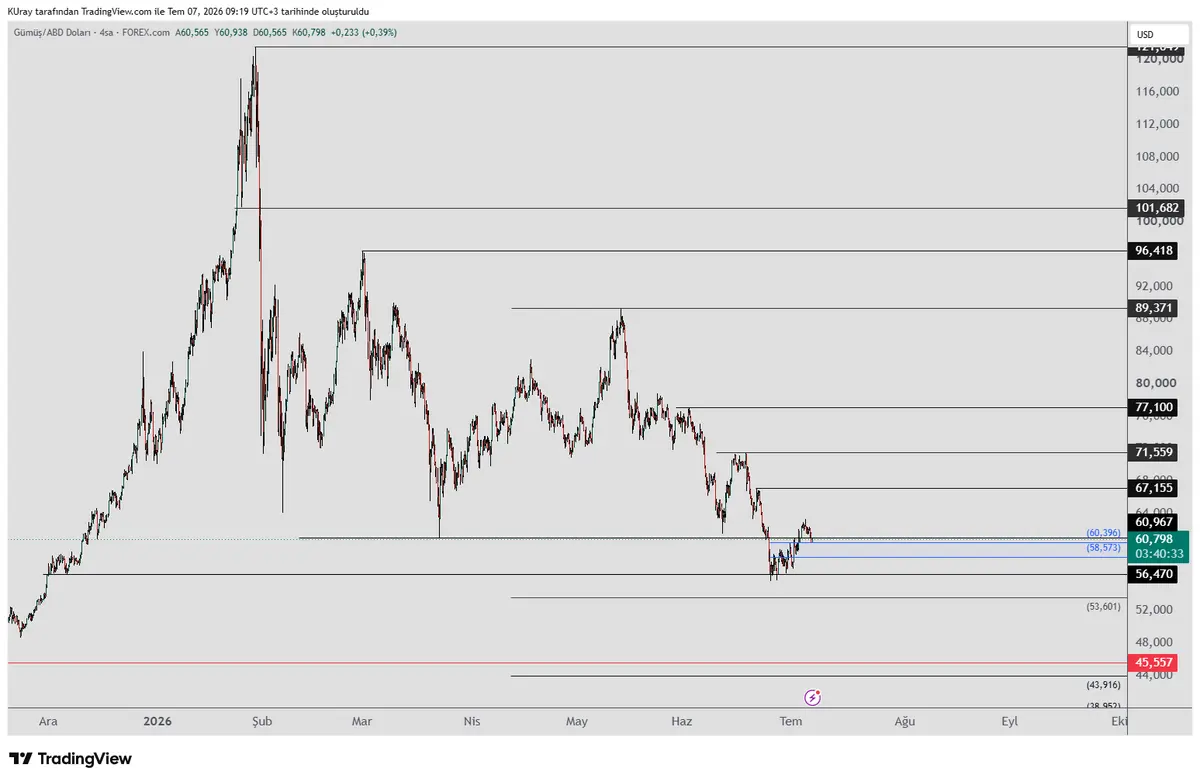
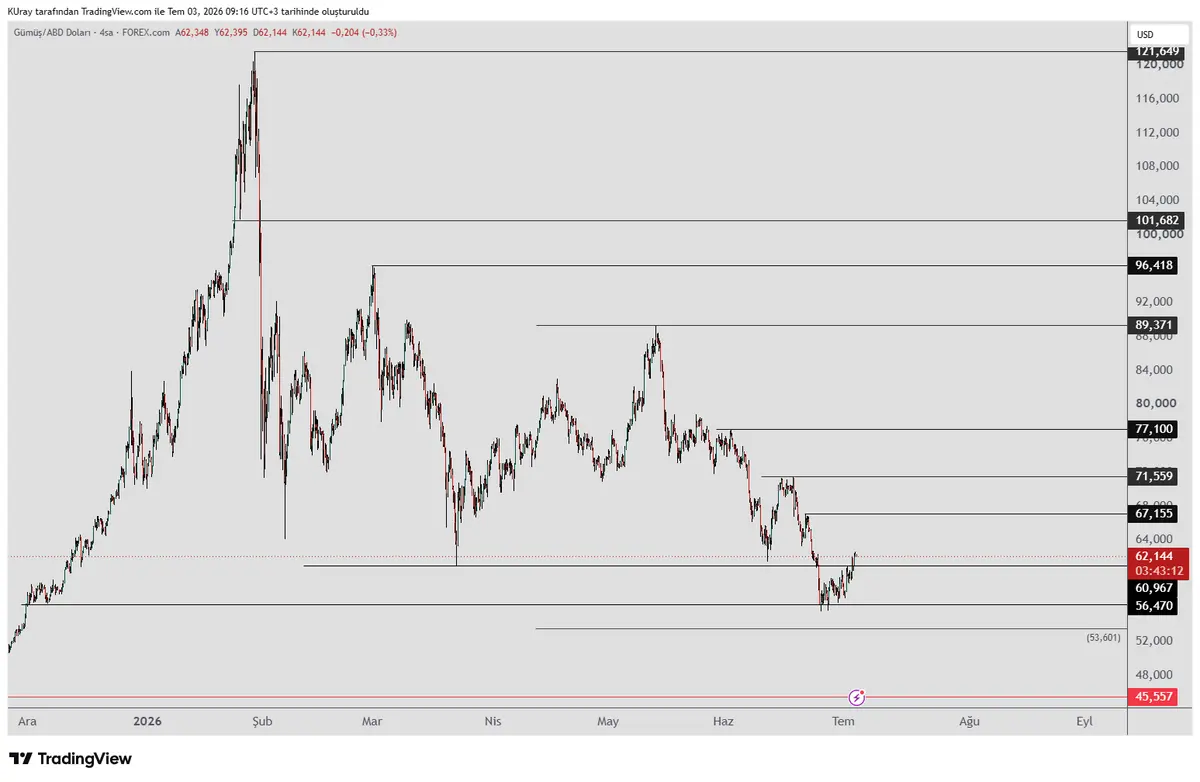
#xag #We mentioned the 60-58 levels that could be support during declines, currently it is trying to hold at this support.
When it holds, a rise towards the 67 level is possible. When it stays above 67, 71-80 resistances can be monitored. If it can stay above 89 during the rise, the probability of retesting the peak increases.
On a close below the 56 support, 50 and 45 supports can be monitored.
The 45 support is important. As long as it stays above on the weekly, it means the uptrend is maintained.
XAG-0.72%
View Original
post-image
  • Reward
  • Comment
  • Repost
  • Share
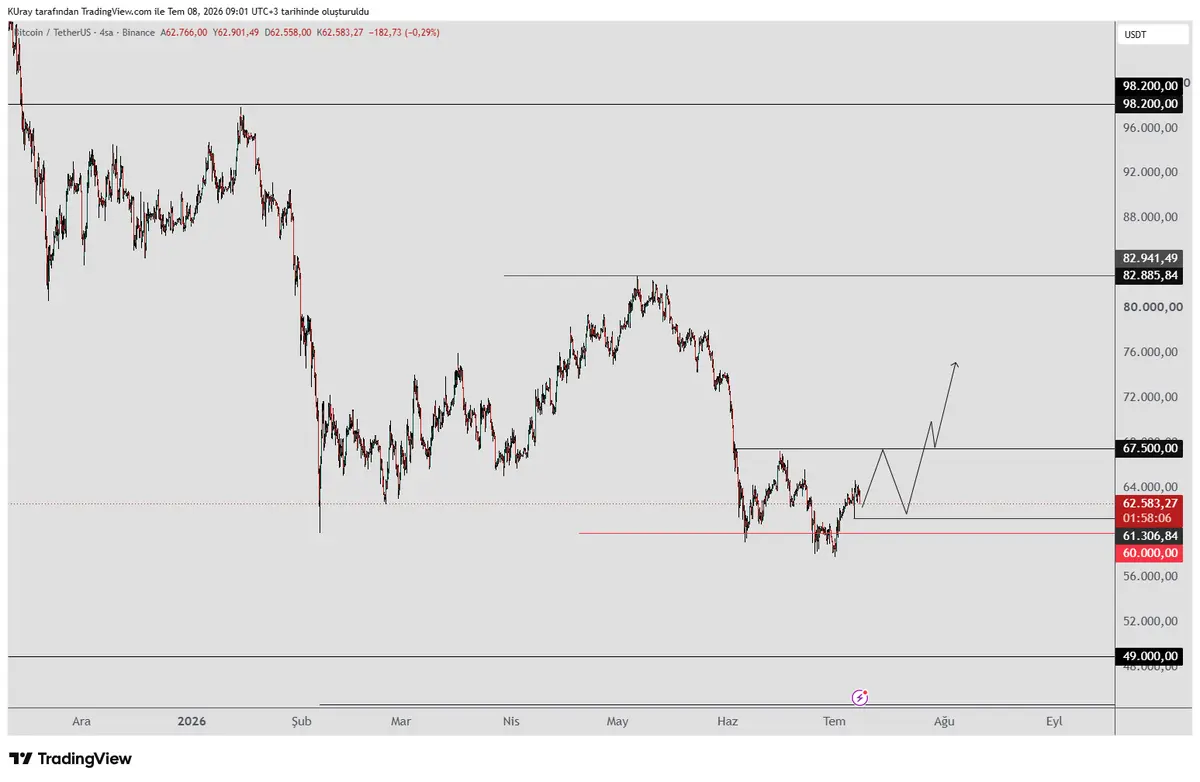
#BTC If it stays above 67500 on the daily chart, this signals that the uptrend will continue.
As long as it holds the 61306 level on the 4-hour chart, the possibility of making the movements I've drawn remains.
After the rise towards 67500, there is a pullback and then breaking the 67500 resistance and rising towards 75000.
If the weekly close is above 82885, this would be another positive signal that the uptrend will continue further.
If it reaches the 102-107k region, this is an important resistance. A new decline could occur.
When the weekly close falls below 60k again, the likeli
BTC-1.24%
View Original
post-image
  • Reward
  • Comment
  • Repost
  • Share
Good morning,
The rules of success in trading are actually quite simple.
• Don't rush into a trade, wait for your setup. Patience protects your capital.
• Let the price decide, not your emotions. The market always has the final say.
• Determine your risk before entering a trade. A single trade should not change your future.
• When you are wrong, don't let a small loss grow. A small loss keeps you in the game for new opportunities.
• Stay true to your system. Even the best strategy is useless without discipline.
Remember…
Success in trading is not about making more trades, but being able to ex
View Original
  • Reward
  • Comment
  • Repost
  • Share
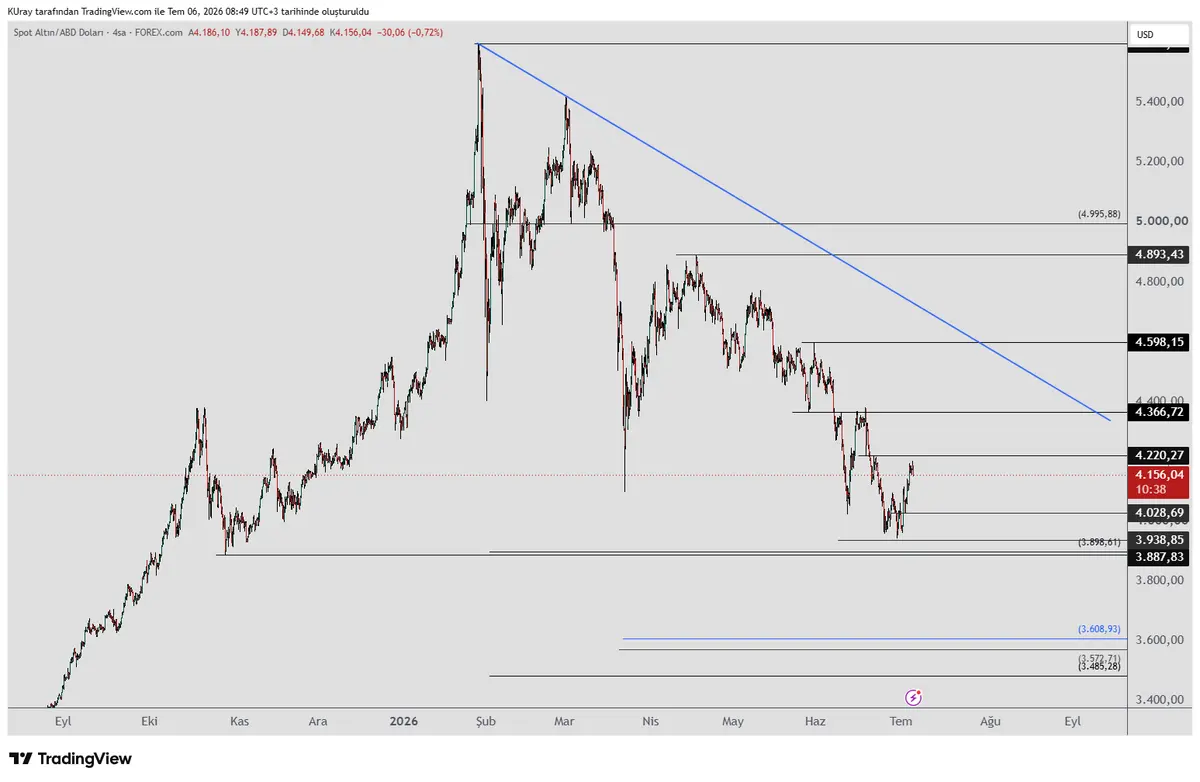
#xauusd #Gold daily chart shows a bottom formation signal, continuing as long as it holds the 3938 low. After such signals are formed, a pullback occurs.
Even if a pullback occurs, the rise can continue, it is interpreted. In a pullback, the 4043-3988 region is the Fibonacci support zone. Buyers may come from these levels.
We are following the 4220-4336 resistances on the 4-hour chart, if closing above 4366 occurs, the rise may continue further.
The real rise will come with the break of the falling blue trend. When the trend is broken, it may test the peak again.
On
View Original
post-image
  • Reward
  • 1
  • Repost
  • Share
User_any:
To The Moon 🌕
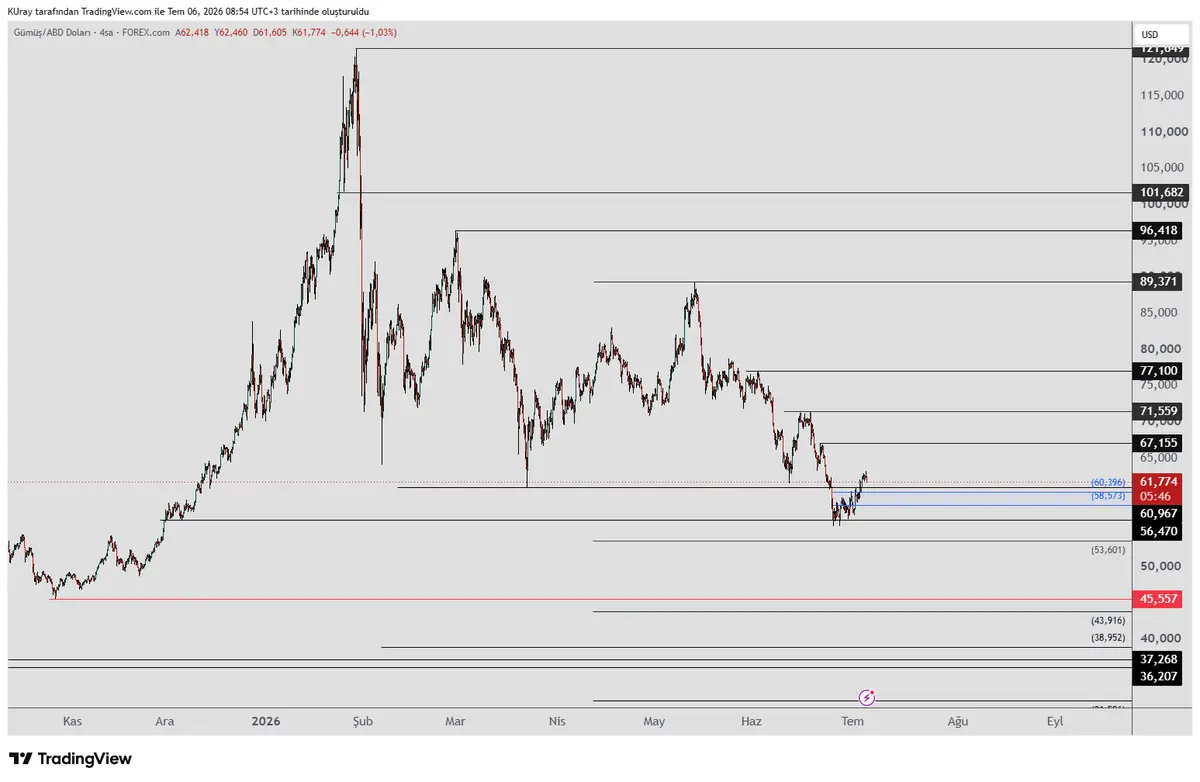
#xag #After closing above the 60 resistance, we had discussed that a pullback could occur.
Now it has arrived at the blue box area, which is the fib support region between the 60-58 levels. If it holds, a rise towards the 67 level could occur. If it stays above 67, the 71-80 resistances can be followed.
If it can stay above 89 during the uptrend, the chance of retesting the peak increases.
If it closes below the 56 support, then 50 and 45 supports can be followed. 45 support is important.
As long as it stays above the weekly, it means the uptrend is preserved.
XAG-0.72%
View Original
post-image
  • Reward
  • 2
  • Repost
  • Share
User_any:
To The Moon 🌕
View More
#BTC Daily We are tracking the 67500 level; if it stays above, it would signal that the uptrend will continue.
On the 4-hour chart, if it holds the 61306 level, the possibility arises for it to make the moves I have drawn. That is, a pullback after a rise towards 67500, then breaking the 67500 resistance and rising towards 75000.

If the weekly close is above 82885, it would give another strong signal that the uptrend will continue further. If it reaches the 102-107k region, this is an important resistance. A new drop could occur.
When the weekly close remains below 60k agai
BTC-1.24%
View Original
  • Reward
  • 1
  • Repost
  • Share
User_any:
To The Moon 🌕
Good morning,
“When you stop expecting certainty among probabilities, the market becomes much less stressful.”
View Original
  • Reward
  • 1
  • Repost
  • Share
User_any:
GM 🔆🙋 thanks
#xag #Silver closed above the 60 resistance. A pullback from the current area may occur.
In the pullback, the blue box region at the 60–58 level is the Fibonacci support. If it holds, there may be an upward move toward the 67 level.
If it stays above 67, the 71–80 resistances can be tracked. If it can remain above 89 during the rise, the likelihood of retesting the peak increases.
If it closes below the 56 support, the 50 and 45 supports can be followed. The 45 support is important. As long as it stays above it on the weekly timeframe, it means the uptrend is preserved.
XAG-0.72%
View Original
post-image
  • Reward
  • Comment
  • Repost
  • Share
#xauusd #Gold a bottom formation signal on the daily chart as long as it holds the 3938 low, it continues. Even if there is a pullback, the uptrend may continue, interpreted accordingly.
We will follow the 4220-4336 resistances on the 4-hour chart.
If closures above 4366 occur, the uptrend may continue further.
The real uptrend will come with the break of the falling blue trend line. When the trend is broken, it may attempt a new high again.
When we examine the weekly chart, as long as it stays above the 3887 level, the uptrend is maintained.
View Original
post-image
  • Reward
  • Comment
  • Repost
  • Share
#BTC also saw a rise as a reaction to the decline.
On the daily, if it stays above the 67500 level, it would give a signal that the rise will continue.
If the weekly close is above 82885, it would give another strong signal that the rise will continue further.
If it comes to the 102-107k region, this is an important resistance. A new decline may occur.
When the weekly close falls below 60k again, the decline may continue towards the 49-50k supports.
BTC-1.24%
View Original
  • Reward
  • Comment
  • Repost
  • Share
Good morning,
"Your biggest competitor in trading is not the market.
It is your own psychology.
Fear drives you away from the right trade.
Greed makes you take on too much risk.
Doubt, on the other hand, causes you to question even the system you have tested many times.
The market is actually a mirror that shows you yourself.
First, learn to manage yourself.
There is no need to manage the market.”
View Original
  • Reward
  • Comment
  • Repost
  • Share
#xauusd #Gold continues its rise as we expected. And a bottom formation signal came on the daily chart.
As long as it holds the 3938 bottom, the uptrend expectation continues.
On the 4-hour chart, staying above 4220 will provide one of the signs that the rise will continue further. The next resistance is at the 4366 peak. If there are closures above it, the rise may continue further. The real rise will come with the break of the falling blue trend. When the trend breaks, it may test the peak again.
When we examine the weekly chart, as long as it stays above 3887 level,
View Original
post-image
  • Reward
  • Comment
  • Repost
  • Share
#BTC The current rises appear to be a reaction to the decline. On the daily, if it stays above the 67500 level, a signal that the rise will continue would have been given.
If the weekly close is above 82885, another strong signal that the rise will continue would have been given.
But if it reaches the 102-107 thousand region, this is an important resistance. A new decline may occur.
When the weekly close is again below 60 thousand, the decline may continue towards the 49-50 thousand supports.
BTC-1.24%
View Original
  • Reward
  • Comment
  • Repost
  • Share
Good morning,
“In markets,
The real work is building the capacity to execute the same plan without deviation in the face of uncertainty/chaos/randomness.”
View Original
  • Reward
  • Comment
  • Repost
  • Share
TÜİK announced the June 2026 inflation.
CPI monthly 0.99%
CPI annual 32.11%
Expectation was also close to this figure.
View Original
  • Reward
  • Comment
  • Repost
  • Share
#xag #Silver closed above the resistance of 60. When buyers strengthen, there may be a rise towards the 67 level. If it remains above 67, it may test the 71-80 levels.
If it can remain above 89 during the rise, the probability of retesting the peak increases.
If it closes below the support of 56, supports at 50 and 45 can be followed. 45 support is important. As long as it stays above on a weekly basis, the uptrend is maintained.
XAG-0.72%
View Original
post-image
  • Reward
  • Comment
  • Repost
  • Share
#xauusd #Gold continues its rise as we expected.
In the 4-hour chart, if it stays above 4220, that will be one of the signs that the rise will continue further. The next resistance is at the 4366 peak. If there are closes above it, the rise may continue further.
I think the real rise will come with the break of the falling blue trend. When the trend is broken, it may test the peak again.
When we examine the weekly chart, as long as it stays above the 3887 level, the uptrend is maintained.
View Original
post-image
  • Reward
  • Comment
  • Repost
  • Share
#BTC It has reached the 61980 level, the first resistance we are tracking on the 4-hour chart. If it closes above this level, the market may start turning positive. On the upside, if it stays above the 67500 level, that would signal that the upward movement will continue.
If the weekly close is above 82885, that would be a strong signal that the upward movement will continue. But if it reaches the 102-107k region, that is an important resistance. A new decline could occur.
If the weekly close falls below 60k again, the decline may continue towards the 49-50k supports.
BTC-1.24%
View Original
  • Reward
  • Comment
  • Repost
  • Share
  • Pinned