#DailyPolymarketHotspot
#Polymarket每日热点
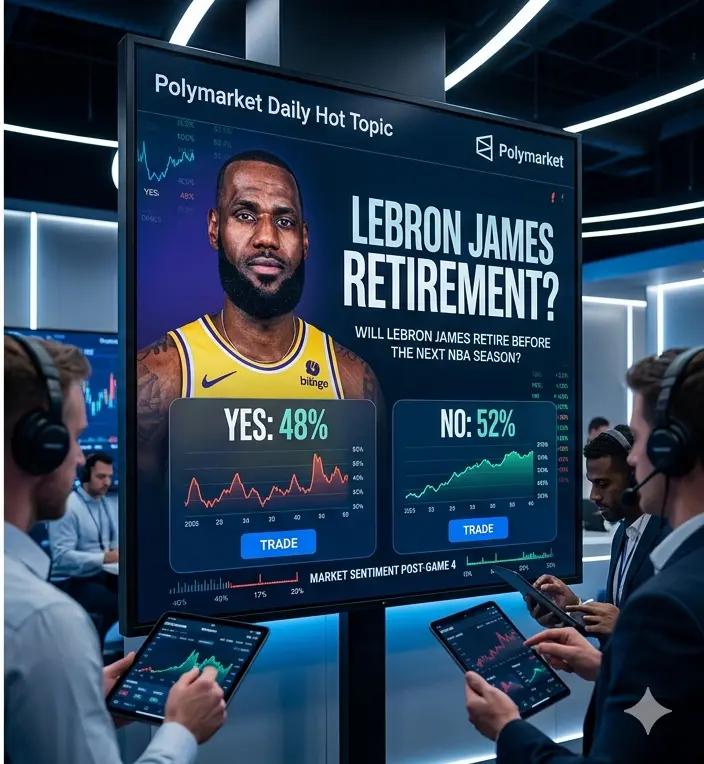
WILL LEBRON JAMES RETIRE BEFORE THE NEXT NBA SEASON?
A DEEP ANALYSIS OF LEGACY, PRESSURE, PLAYOFF EMOTIONS, AND THE FINAL CHAPTER OF A BASKETBALL EMPIRE
The basketball world is once again standing at a historic crossroads. As the 2026 NBA Playoffs intensify and the Los Angeles Lakers struggle under immense postseason pressure against the Oklahoma City Thunder, one question has completely taken over sports discussions, prediction markets, and social media conversations across the world.
Will LeBron James retire before the next NBA season?
This is no longer just a simple sports debate. It has become an emotional global conversation about greatness, longevity, leadership, pressure, legacy, and the psychology of elite athletes. Every interview, every playoff game, every body language moment, and every postgame reaction is now being analyzed by fans and traders searching for clues about the future of one of the greatest athletes in sports history.
For prediction market participants, this is not only a basketball question. It is a high emotion event driven by narrative momentum, media psychology, public sentiment, and long term career strategy.
THE CURRENT PLAYOFF SITUATION
The Lakers entering a difficult playoff position has dramatically increased retirement speculation. Historically, when legendary athletes face postseason disappointment, retirement rumors immediately begin to rise. Fans naturally start wondering whether they are witnessing the final games of an era.
But the current situation surrounding LeBron feels larger than a normal playoff discussion.
Why?
Because LeBron is not just another superstar. He represents an entire basketball generation. For more than two decades, he has dominated conversations around leadership, championships, consistency, durability, and global influence. Millions of fans grew up watching his evolution from teenage prodigy to worldwide icon.
Now the basketball world is emotionally preparing for a possibility many people never truly believed would arrive.
THE ARGUMENT FOR RETIREMENT
There are several powerful reasons why retirement speculation has become stronger than ever before.
First is the emotional factor.
Elite athletes often begin evaluating life differently after difficult playoff losses. The physical demands of an NBA season are enormous. Recovery becomes more challenging with age, and maintaining elite performance requires incredible discipline, sacrifice, and mental focus.
LeBron has already achieved nearly every milestone imaginable.
Championships.
MVP awards.
Olympic success.
All time scoring records.
Global business expansion.
Historic longevity.
At this point, there is very little left for him to prove.
Some analysts believe that athletes at this level eventually begin prioritizing family life, health, personal freedom, and business opportunities over the nonstop pressure of professional competition. LeBron’s influence outside basketball has already become massive through entertainment, investments, media projects, and international branding.
Retirement could allow him to fully transition into the next phase of global leadership and business influence while preserving his legacy at an elite level.
Another important factor is narrative timing.
Sports history often celebrates legendary exits. Some fans believe that walking away while still performing at a high level creates a stronger legacy than continuing through multiple declining seasons. If LeBron feels his championship window is closing, he may decide this is the correct moment to end his career with dignity and historical respect.
THE ARGUMENT FOR RETURNING NEXT SEASON
Despite the retirement discussion, there are also extremely strong reasons why LeBron may continue playing.
The biggest reason is simple.
He still performs like a superstar.
This is what makes the situation unique. Most retirement discussions happen when athletes are no longer capable of competing at the highest level. But LeBron continues to impact games with elite basketball intelligence, scoring efficiency, leadership, physical strength, and playoff experience.
His conditioning remains extraordinary.
His understanding of the game remains unmatched.
His influence on teammates remains powerful.
Many athletes struggle to leave competition while still performing at an elite level because the internal competitive fire never truly disappears. History repeatedly shows that legendary competitors often continue longer than the public expects because their mindset is fundamentally different from ordinary athletes.
Another major factor is unfinished business.
There is still a possibility that the Lakers restructure the roster during the offseason. If management adds stronger defensive support, younger athletic talent, or another star level contributor, LeBron could realistically believe another championship run is possible.
And for competitors at his level, even one more realistic championship opportunity can completely change retirement plans.
There is also the emotional connection with fans.
Every arena still reacts to LeBron like a global event. Merchandise demand remains massive. Television ratings remain strong. Media attention surrounding his games remains among the highest in professional sports.
From a business and marketing perspective, his continued presence remains enormously valuable for the NBA ecosystem itself.
THE PREDICTION MARKET PSYCHOLOGY
This event is especially fascinating because it combines sports analysis with emotional market behavior.
Prediction markets are often heavily influenced by public emotion rather than pure probability. After playoff losses, retirement odds may rise sharply due to emotional reactions from fans and media narratives. However, those same odds can reverse quickly after a positive interview, offseason trade rumor, or motivational statement.
This creates extreme volatility.
Smart traders understand that emotional markets often overreact in the short term.
That means timing becomes critical.
Aggressive reactions immediately after playoff elimination may create unstable pricing environments. Patient analysis usually performs better than emotional decision making.
KEY FACTORS TRADERS SHOULD WATCH
Several major signals may determine the direction of this prediction market.
1. POSTGAME INTERVIEWS
LeBron’s tone, energy, and wording after playoff games could significantly influence sentiment.
2. OFFSEASON ROSTER MOVES
If the Lakers aggressively improve the roster, retirement probability could fall quickly.
3. FAMILY AND PERSONAL PRIORITIES
LeBron has increasingly discussed long term family goals and life beyond basketball.
4. HEALTH AND RECOVERY
Physical condition always matters for veteran athletes competing at elite intensity.
5. CHAMPIONSHIP BELIEF
The strongest factor may simply be whether LeBron still believes another title is realistically possible.
THE LEGACY FACTOR
Regardless of the final decision, one truth is already permanent.
LeBron’s legacy is untouchable.
He transformed modern basketball culture in multiple ways.
He redefined athlete longevity.
He expanded player empowerment.
He elevated athlete business influence.
He inspired a generation of players globally.
He became one of the most recognized sports figures in modern history.
Very few athletes in any sport maintain championship level relevance across multiple generations. LeBron achieved exactly that.
This is why retirement discussions around him feel emotionally larger than ordinary sports news. Fans are not simply debating a roster change. They are discussing the possible ending of an era that shaped global basketball culture for more than twenty years.
FINAL PREDICTION
After analyzing playoff pressure, performance level, psychology, legacy timing, and market behavior, the probability currently appears slightly stronger for LeBron returning next season rather than retiring immediately.
Why?
Because elite competitors rarely walk away while still capable of dominating at a high level.
And LeBron still looks capable of competing against the best players in the world.
However, this situation remains extremely sensitive to playoff emotions and offseason developments. One major roster decision or one emotional public statement could instantly shift market sentiment.
PREDICTION OUTLOOK
RETIRE BEFORE NEXT SEASON
Probability Moderate
RETURN FOR ANOTHER SEASON
Probability Slightly Higher
EVENT CARD
Will LeBron James retire before the next NBA season?
YES
The emotional playoff pressure and completed legacy could lead to a historic farewell.
NO
Another championship pursuit and competitive motivation may keep the journey alive for one more season.
#Polymarket每日热点
WILL LEBRON JAMES RETIRE BEFORE THE NEXT NBA SEASON?
A DEEP ANALYSIS OF LEGACY, PRESSURE, PLAYOFF EMOTIONS, AND THE FINAL CHAPTER OF A BASKETBALL EMPIRE
The basketball world is once again standing at a historic crossroads. As the 2026 NBA Playoffs intensify and the Los Angeles Lakers struggle under immense postseason pressure against the Oklahoma City Thunder, one question has completely taken over sports discussions, prediction markets, and social media conversations across the world.
Will LeBron James retire before the next NBA season?
This is no longer just a simple sports debate. It has become an emotional global conversation about greatness, longevity, leadership, pressure, legacy, and the psychology of elite athletes. Every interview, every playoff game, every body language moment, and every postgame reaction is now being analyzed by fans and traders searching for clues about the future of one of the greatest athletes in sports history.
For prediction market participants, this is not only a basketball question. It is a high emotion event driven by narrative momentum, media psychology, public sentiment, and long term career strategy.
THE CURRENT PLAYOFF SITUATION
The Lakers entering a difficult playoff position has dramatically increased retirement speculation. Historically, when legendary athletes face postseason disappointment, retirement rumors immediately begin to rise. Fans naturally start wondering whether they are witnessing the final games of an era.
But the current situation surrounding LeBron feels larger than a normal playoff discussion.
Why?
Because LeBron is not just another superstar. He represents an entire basketball generation. For more than two decades, he has dominated conversations around leadership, championships, consistency, durability, and global influence. Millions of fans grew up watching his evolution from teenage prodigy to worldwide icon.
Now the basketball world is emotionally preparing for a possibility many people never truly believed would arrive.
THE ARGUMENT FOR RETIREMENT
There are several powerful reasons why retirement speculation has become stronger than ever before.
First is the emotional factor.
Elite athletes often begin evaluating life differently after difficult playoff losses. The physical demands of an NBA season are enormous. Recovery becomes more challenging with age, and maintaining elite performance requires incredible discipline, sacrifice, and mental focus.
LeBron has already achieved nearly every milestone imaginable.
Championships.
MVP awards.
Olympic success.
All time scoring records.
Global business expansion.
Historic longevity.
At this point, there is very little left for him to prove.
Some analysts believe that athletes at this level eventually begin prioritizing family life, health, personal freedom, and business opportunities over the nonstop pressure of professional competition. LeBron’s influence outside basketball has already become massive through entertainment, investments, media projects, and international branding.
Retirement could allow him to fully transition into the next phase of global leadership and business influence while preserving his legacy at an elite level.
Another important factor is narrative timing.
Sports history often celebrates legendary exits. Some fans believe that walking away while still performing at a high level creates a stronger legacy than continuing through multiple declining seasons. If LeBron feels his championship window is closing, he may decide this is the correct moment to end his career with dignity and historical respect.
THE ARGUMENT FOR RETURNING NEXT SEASON
Despite the retirement discussion, there are also extremely strong reasons why LeBron may continue playing.
The biggest reason is simple.
He still performs like a superstar.
This is what makes the situation unique. Most retirement discussions happen when athletes are no longer capable of competing at the highest level. But LeBron continues to impact games with elite basketball intelligence, scoring efficiency, leadership, physical strength, and playoff experience.
His conditioning remains extraordinary.
His understanding of the game remains unmatched.
His influence on teammates remains powerful.
Many athletes struggle to leave competition while still performing at an elite level because the internal competitive fire never truly disappears. History repeatedly shows that legendary competitors often continue longer than the public expects because their mindset is fundamentally different from ordinary athletes.
Another major factor is unfinished business.
There is still a possibility that the Lakers restructure the roster during the offseason. If management adds stronger defensive support, younger athletic talent, or another star level contributor, LeBron could realistically believe another championship run is possible.
And for competitors at his level, even one more realistic championship opportunity can completely change retirement plans.
There is also the emotional connection with fans.
Every arena still reacts to LeBron like a global event. Merchandise demand remains massive. Television ratings remain strong. Media attention surrounding his games remains among the highest in professional sports.
From a business and marketing perspective, his continued presence remains enormously valuable for the NBA ecosystem itself.
THE PREDICTION MARKET PSYCHOLOGY
This event is especially fascinating because it combines sports analysis with emotional market behavior.
Prediction markets are often heavily influenced by public emotion rather than pure probability. After playoff losses, retirement odds may rise sharply due to emotional reactions from fans and media narratives. However, those same odds can reverse quickly after a positive interview, offseason trade rumor, or motivational statement.
This creates extreme volatility.
Smart traders understand that emotional markets often overreact in the short term.
That means timing becomes critical.
Aggressive reactions immediately after playoff elimination may create unstable pricing environments. Patient analysis usually performs better than emotional decision making.
KEY FACTORS TRADERS SHOULD WATCH
Several major signals may determine the direction of this prediction market.
1. POSTGAME INTERVIEWS
LeBron’s tone, energy, and wording after playoff games could significantly influence sentiment.
2. OFFSEASON ROSTER MOVES
If the Lakers aggressively improve the roster, retirement probability could fall quickly.
3. FAMILY AND PERSONAL PRIORITIES
LeBron has increasingly discussed long term family goals and life beyond basketball.
4. HEALTH AND RECOVERY
Physical condition always matters for veteran athletes competing at elite intensity.
5. CHAMPIONSHIP BELIEF
The strongest factor may simply be whether LeBron still believes another title is realistically possible.
THE LEGACY FACTOR
Regardless of the final decision, one truth is already permanent.
LeBron’s legacy is untouchable.
He transformed modern basketball culture in multiple ways.
He redefined athlete longevity.
He expanded player empowerment.
He elevated athlete business influence.
He inspired a generation of players globally.
He became one of the most recognized sports figures in modern history.
Very few athletes in any sport maintain championship level relevance across multiple generations. LeBron achieved exactly that.
This is why retirement discussions around him feel emotionally larger than ordinary sports news. Fans are not simply debating a roster change. They are discussing the possible ending of an era that shaped global basketball culture for more than twenty years.
FINAL PREDICTION
After analyzing playoff pressure, performance level, psychology, legacy timing, and market behavior, the probability currently appears slightly stronger for LeBron returning next season rather than retiring immediately.
Why?
Because elite competitors rarely walk away while still capable of dominating at a high level.
And LeBron still looks capable of competing against the best players in the world.
However, this situation remains extremely sensitive to playoff emotions and offseason developments. One major roster decision or one emotional public statement could instantly shift market sentiment.
PREDICTION OUTLOOK
RETIRE BEFORE NEXT SEASON
Probability Moderate
RETURN FOR ANOTHER SEASON
Probability Slightly Higher
EVENT CARD
Will LeBron James retire before the next NBA season?
YES
The emotional playoff pressure and completed legacy could lead to a historic farewell.
NO
Another championship pursuit and competitive motivation may keep the journey alive for one more season.