juttmunda

vip
Age 0.8 Year
Peak Tier 0
No content yet
#MyGateTradeStory
Every trader has a story. Some chapters are filled with excitement, some with disappointment, and some with lessons that become more valuable than any profit. My journey on Gate has been exactly that—a combination of wins, losses, growth, patience, and continuous learning.
When I first entered the world of trading, I was attracted by the opportunities that financial markets offered. Like many beginners, I thought success would come quickly. I believed that finding the right trade was all that mattered.
What I did not realize at the time was that trading is not just about en
HighAmbition
#MyGateTradeStory
Every trader has a story. Some chapters are filled with excitement, some with disappointment, and some with lessons that become more valuable than any profit. My journey on Gate has been exactly that—a combination of wins, losses, growth, patience, and continuous learning.
When I first entered the world of trading, I was attracted by the opportunities that financial markets offered. Like many beginners, I thought success would come quickly. I believed that finding the right trade was all that mattered.
What I did not realize at the time was that trading is not just about entries and exits. It is about discipline, risk management, psychology, patience, and the ability to keep learning every single day.
My journey with Gate started during a period when I was eager to understand the markets better. At first, I focused on observing price movements, studying market trends, and learning how different assets reacted to news, liquidity, and investor sentiment. Every chart seemed complicated, every market move felt unpredictable, and every successful trader appeared to possess a secret formula that I did not know.
Very quickly, I discovered that there is no secret formula.
The market rewards preparation, consistency, and discipline.
Like many traders, I experienced my first losses early. Those losses were frustrating because I thought I had made the perfect analysis.
Sometimes I entered trades too early.
Sometimes I held positions for too long.
Sometimes emotions influenced my decisions more than logic did. Looking back today, I realize those losses were not failures. They were tuition fees paid to the market.
Each losing trade taught me something valuable.
One loss taught me not to chase price movements.
Another taught me the importance of stop-loss management.
A different loss showed me why risk management matters more than confidence.
Instead of quitting, I decided to learn from every mistake.
That decision changed everything.
Gate became more than just a trading platform for me. It became an environment where I could continue improving my knowledge and skills.
Through market analysis, trading events, educational content, community discussions, and daily market participation, I gradually developed a deeper understanding of how markets function.
As time passed, I began to notice improvements in my trading approach.
I became more patient.
I stopped trying to catch every opportunity.
I learned that missing a trade is often better than forcing a bad trade.
I learned that preserving capital is just as important as growing capital.
Most importantly, I learned that successful trading is a marathon, not a sprint.
One of the most memorable parts of my journey was participating in community events and trading competitions. I still remember the excitement of seeing my name climb rankings after months of consistent effort. There were periods when results did not go my way, but I kept participating, learning, and improving.
Persistence eventually produced results.
There were moments when my hard work was recognized. There were events where I managed to secure rewards and achieve rankings that once seemed impossible. Those achievements were not important because of the prizes themselves. They were important because they represented progress.
They proved that consistent effort eventually creates opportunities.
What made those moments special was knowing how much work happened behind the scenes. The hours spent studying charts. The time invested in understanding market structures. The mistakes corrected after difficult trades. The patience required to stay focused during challenging periods.
Every reward carried a lesson behind it.
Every achievement represented growth.
At the same time, the journey was never perfect.
There were days when markets moved against expectations.
There were weeks when opportunities seemed limited.
There were periods when I questioned my strategies.
There were trades that looked promising but failed.
There were moments when confidence was tested.
However, those difficult periods often became the most valuable learning experiences.
Markets have a unique way of teaching humility.
Whenever I became overconfident, the market reminded me to remain disciplined.
Whenever I became impatient, the market reminded me to wait for quality setups.
Whenever I focused too much on short-term outcomes, the market reminded me to think long term.
These lessons helped shape my mindset far beyond trading itself.
Another thing I appreciate about Gate is the variety of opportunities available to users.
Whether it is spot trading, futures trading, market analysis, community engagement, campaigns, educational resources, or global events, there is always something new to explore and learn from.
This diversity helped me understand that financial markets are larger than a single asset or strategy.
The more I learned, the more I realized how much there is still to learn.
That mindset continues to motivate me today.
One of the biggest misconceptions many new traders have is believing that successful traders never lose. My experience taught me the opposite.
Losses are part of trading.
Every professional trader experiences losses.
What matters is how you respond to them.
Do you allow losses to discourage you?
Or do you use them as opportunities to improve?
I chose the second path.
Every losing trade became a lesson.
Every mistake became a learning opportunity.
Every challenge became motivation to become better.
Over time, this approach helped me develop a stronger and more disciplined trading mindset.
The most valuable thing I have gained from Gate is not a reward, a ranking, or a profitable trade.
It is knowledge.
Knowledge compounds over time.
A reward may be spent.
A profitable trade may eventually be forgotten.
But knowledge stays with you and continues creating value long into the future.
The second most valuable thing I gained is confidence.
Not the confidence that comes from winning.
The confidence that comes from experience.
The confidence that comes from understanding risk.
The confidence that comes from surviving difficult market conditions and continuing to move forward.
The confidence that comes from knowing that growth is a continuous process.
Today, I still consider myself a student of the markets.
I continue learning.
I continue analyzing.
I continue improving.
Every trading session provides new information.
Every market cycle offers new lessons.
Every challenge creates new opportunities for growth.
My journey with Gate is still ongoing, and I believe the best chapters are yet to be written.
If there is one message I would share with every new trader, it is this:
Do not measure success only by profits.
Measure success by how much you learn.
Profits can fluctuate.
Markets can change.
Opportunities can come and go.
But the lessons you gain through experience remain with you forever.
I have won some trades.
I have lost some trades.
I have achieved results that made me proud.
I have made mistakes that taught me valuable lessons.
Through all of it, one thing has remained constant: continuous learning.
That is what makes this journey meaningful.
Thank you, Gate, for providing opportunities to learn, grow, participate, compete, and connect with a global community of traders and investors.
The journey continues, the learning never stops, and the next chapter is waiting to be written.
#MyGateTradingMoment @Gate_Square
repost-content-media
  • Reward
  • Comment
  • Repost
  • Share
#MyGateTradeStory
Every trader remembers their first big lesson.
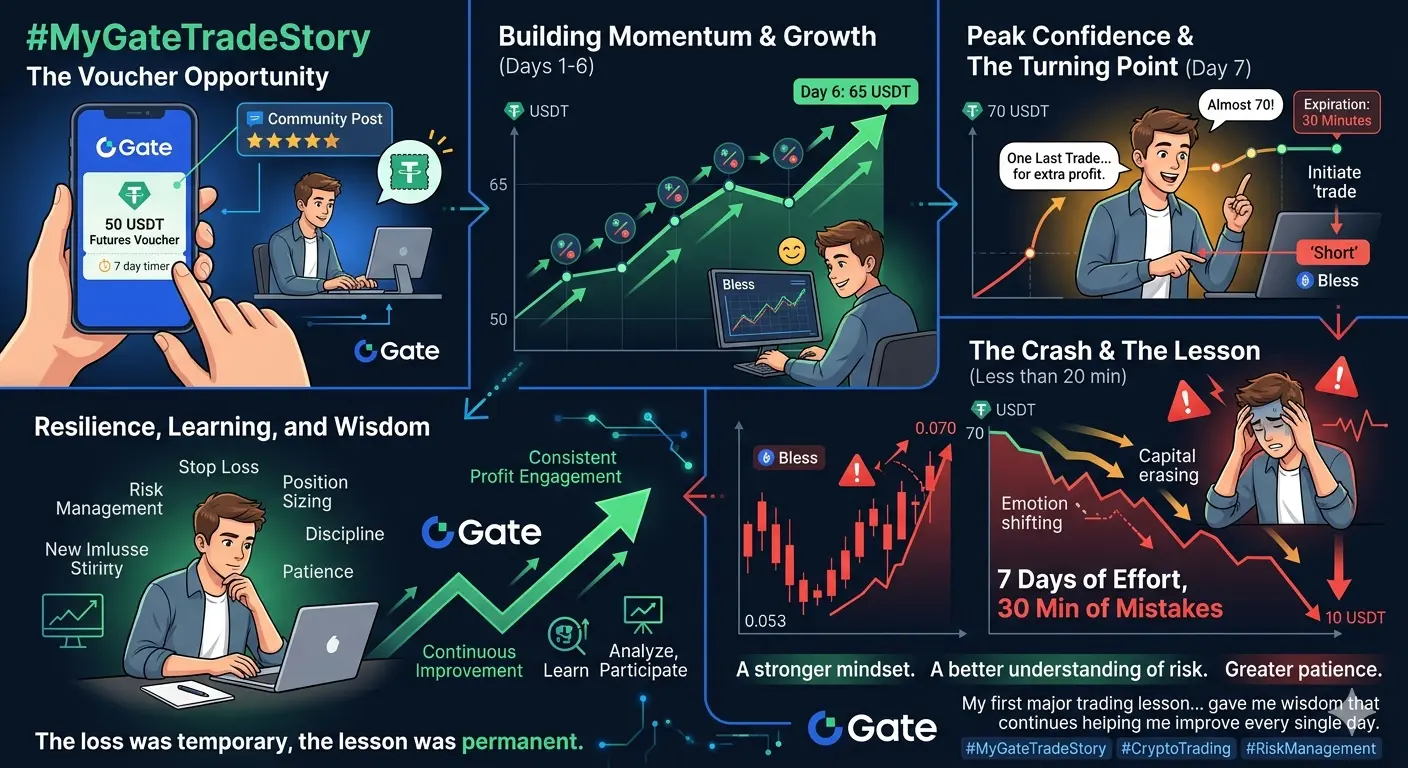
Some lessons come through success. Others come through mistakes. In my case, one of the most important lessons of my trading journey came from a single trade that changed the way I look at the market forever.
My journey on Gate started when the platform regularly rewarded selected community posts with Futures Vouchers. At that time, if your content was selected, you could receive a voucher worth 50 USDT that could be used for futures trading. As a content creator and active community member, I worked hard to create quality posts
BLESS2.13%
HighAmbition
#MyGateTradeStory
Every trader remembers their first big lesson.
Some lessons come through success. Others come through mistakes. In my case, one of the most important lessons of my trading journey came from a single trade that changed the way I look at the market forever.
My journey on Gate started when the platform regularly rewarded selected community posts with Futures Vouchers. At that time, if your content was selected, you could receive a voucher worth 50 USDT that could be used for futures trading. As a content creator and active community member, I worked hard to create quality posts and engage with the community.
One day, my effort paid off.
My post was selected, and I received a 50 USDT Futures Voucher.
I was extremely excited.
For many experienced traders, 50 USDT might not seem like a large amount, but for me, it represented an opportunity. More importantly, it was proof that my contributions to the community had been recognized.
I decided to use that voucher carefully and begin my futures trading journey.
At that time, I was paying close attention to a project called Bless. Most of my focus was on this coin because I believed it had strong momentum and offered trading opportunities.
The voucher had a limited lifespan of seven days before expiration, so I knew I had to use it wisely.
During the first few days, everything seemed to be going perfectly.
I studied the market, opened positions, managed trades, and gradually started growing the voucher balance. Every successful trade increased my confidence. Every profitable move made me believe I was beginning to understand the market.
Day after day, the balance continued growing.
By the sixth day, through consistent trading on Bless, I had managed to increase the voucher value from 50 USDT to approximately 65 USDT.
I was thrilled.
Seeing the account grow felt incredible.
I remember checking the balance repeatedly because I could hardly believe the progress. For someone still relatively new to futures trading, it felt like a major achievement.
Then came the seventh day.
I still had one final day before the voucher expired.
My confidence was high because the previous days had gone well. I continued focusing on Bless and kept trading. During that final day, I managed to generate another 5 USDT in gains, bringing the voucher value close to 70 USDT.
At that moment, I felt unstoppable.
I was already imagining how much more I might earn before the voucher expired.
That confidence would soon become my biggest mistake.
I clearly remember looking at the timer and noticing that only around 30 minutes remained before the voucher expiration.
Instead of protecting the gains I had already built, I decided to take one more trade.
I thought it would be a quick opportunity.
I believed I could earn a little extra profit before time ran out.
The market had other plans.
Bless was trading around 0.053.
Based on my analysis at the time, I opened a short position.
I expected the price to move lower.
Instead, the exact opposite happened.
Within minutes, the market started moving against me.
At first, I was not worried.
I thought it was just a temporary fluctuation.
I expected the price to reverse.
But it did not.
The upward movement became stronger.
Every minute that passed increased the pressure.
Instead of falling, Bless continued climbing aggressively.
What happened next remains one of the most unforgettable moments of my trading journey.
In less than twenty minutes, Bless surged from approximately 0.053 to nearly 0.07.
The market was moving fast.
Much faster than I expected.
I watched the unrealized loss grow larger and larger.
The numbers on the screen kept getting worse.
As a beginner trader, I did not fully understand risk management.
I did not understand position sizing.
I did not understand the importance of protecting profits.
Most importantly, I did not understand when to accept a loss and exit.
I simply watched.
And the market continued moving against me.
The balance that had taken seven days of effort to build started disappearing rapidly.
The 70 USDT value I had worked so hard to reach was being erased in real time.
Every second felt painful.
The excitement I had felt earlier turned into stress.
The confidence I had built over the week began fading.
By the time the voucher was close to expiration, almost everything was gone.
After seven days of trading, learning, analyzing, and growing the balance, only around 10 USDT remained.
Seven days of effort.
Thirty minutes of mistakes.
That was all it took
When the voucher finally expired, I sat there staring at the screen.
I felt disappointed.
I felt frustrated.
I felt upset with myself.
I kept replaying the trade in my mind.
What if I had closed earlier?
What if I had protected profits?
What if I had simply stopped trading when I reached 70 USDT?
But markets do not reward "what if."
Markets reward discipline.
That day became one of the most valuable lessons of my entire trading journey.
At the time, it felt like a painful experience.
Today, I see it differently.
The market taught me something that no book, video, or tutorial could have taught as effectively.
It taught me the true importance of risk management.
It taught me that protecting capital is just as important as generating profits.
It taught me that confidence without discipline can become dangerous.
It taught me that one emotional decision can erase days of hard work.
Most importantly, it taught me patience.
After that experience, I did not quit.
I did not blame the market.
I did not give up on trading.
Instead, I decided to learn.
I started studying more.
I spent more time understanding leverage.
I learned about stop-loss placement.
I learned about position management.
I learned that successful trading is not about being right all the time.
It is about managing risk when you are wrong.
Gradually, my experience grew.
My understanding improved.
My decision-making became more disciplined.
Every lesson from that trade became part of my trading foundation.
Looking back today, I am actually grateful for that experience.
Of course, losing most of the voucher was painful.
Of course, watching seven days of effort disappear was difficult.
But the knowledge gained from that mistake has stayed with me far longer than the voucher ever could.
The loss was temporary.
The lesson was permanent.
That experience transformed my mindset.
It showed me that trading is not a game of quick profits.
It is a journey of continuous improvement.
It is a process of building discipline, patience, emotional control, and experience.
Since then, Gate has remained an important part of my journey.
The platform has given me opportunities to learn, participate in events, engage with the community, explore markets, and continuously improve my skills.
The rewards were valuable.
The trading opportunities were valuable.
But the lessons were the most valuable of all.
Today, whenever I see new traders entering the market, I remember my own experience.
I remember the excitement of receiving that first voucher.
I remember growing it from 50 USDT to 70 USDT.
I remember the confidence.
I remember the mistake.
And I remember the lesson.
Because sometimes the most important victory is not making money.
Sometimes the most important victory is gaining experience.
My first major trading lesson cost me almost an entire week's worth of progress.
But it also gave me something far more valuable:
A stronger mindset.
A better understanding of risk.
Greater patience.
And a foundation that continues helping me improve every single day.
The market took away my profits that day.
But it gave me wisdom in return.
And that wisdom is still paying dividends today.
@Gate_Square #MyGateTradingMoment.
repost-content-media
  • Reward
  • Comment
  • Repost
  • Share
#MyGateTradeStory
My Gate Trading Moment: A Strategic BTC Trade
The cryptocurrency market never sleeps, and neither do the opportunities it presents. Today, I want to share my trading journey with Bitcoin on Gate, the best cryptocurrency exchange for both beginners and experienced traders.
Current Market Snapshot
Bitcoin is currently trading at $63,659.7 USDT, showing a positive movement of 2.09% with a price increase of $1,303.2 from the opening price of $62,356.4. The 24-hour high reached $63,919.9, while the low touched $62,339.4. The trading volume stands at 8,395.598 BTC, demonstrating s
BTC0.42%
HighAmbition
#MyGateTradeStory
My Gate Trading Moment: A Strategic BTC Trade
The cryptocurrency market never sleeps, and neither do the opportunities it presents. Today, I want to share my trading journey with Bitcoin on Gate, the best cryptocurrency exchange for both beginners and experienced traders.
Current Market Snapshot
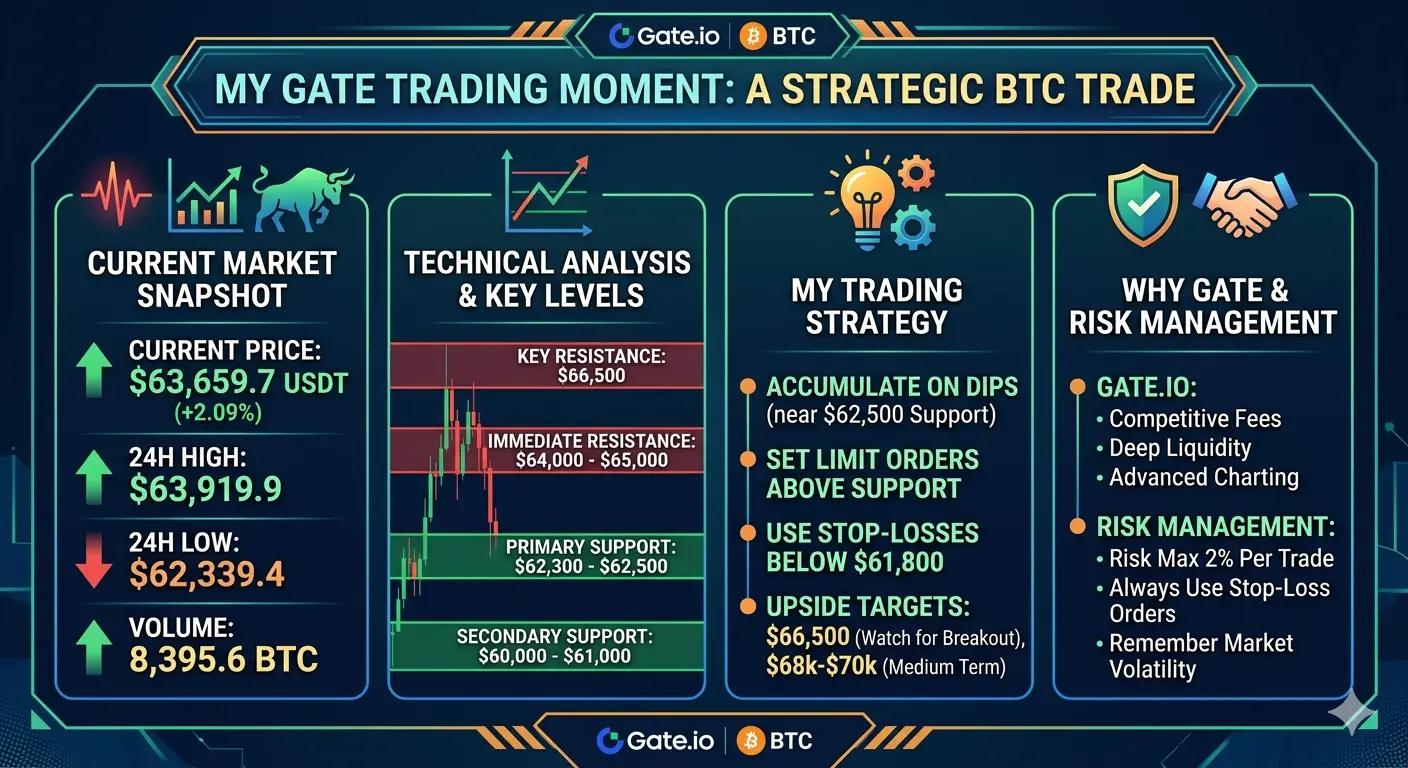
Bitcoin is currently trading at $63,659.7 USDT, showing a positive movement of 2.09% with a price increase of $1,303.2 from the opening price of $62,356.4. The 24-hour high reached $63,919.9, while the low touched $62,339.4. The trading volume stands at 8,395.598 BTC, demonstrating strong market participation.
Technical Analysis and Key Levels
Based on my analysis of the recent price action, here are the critical levels I am monitoring:
Support Levels:
Primary Support: $62,300 - $62,500 range. This zone has shown strong buying interest and has acted as a floor during recent pullbacks.
Secondary Support: $60,000 - $61,000. A psychological level that could trigger significant buying if tested.
Resistance Levels:
Immediate Resistance: $64,000 - $65,000. The recent high of $63,919.9 suggests this area will be challenging to break.
Key Resistance: $66,500. Breaking above this level could signal a continuation of the uptrend toward higher targets.
My Trading Strategy
My approach combines technical analysis with risk management principles. I am currently looking for opportunities to accumulate BTC on dips toward the $62,500 support level. The strategy involves setting limit orders slightly above support to catch potential bounces while maintaining stop-losses below $61,800 to protect capital.
For upside targets, I am watching the $66,500 resistance level closely. A breakout above this zone with strong volume would confirm bullish momentum, potentially opening the path toward $68,000 - $70,000 in the medium term.
Why Gate is My Preferred Exchange
Gate provides the perfect environment for executing this strategy. With competitive fees, deep liquidity, and advanced charting tools, I can implement my trading plan with confidence. The platform's security features give me peace of mind while holding positions overnight.
Risk Management
No trade is complete without proper risk management. I never risk more than 2% of my portfolio on a single trade and always use stop-loss orders. Remember, the cryptocurrency market is highly volatile, and past performance does not guarantee future results.
Final Thoughts
Bitcoin continues to show resilience despite market uncertainties. The current price action suggests accumulation by smart money at lower levels. By combining technical analysis with disciplined risk management on Gate, I believe we can navigate these markets successfully.
Join me on Gate and share your own trading stories. Let us learn and grow together in this exciting market.
@Gate_Square
repost-content-media
  • Reward
  • Comment
  • Repost
  • Share
#BTC
Bitcoin is currently trading at approximately $63,750, representing a critical juncture in the market as multiple macroeconomic and geopolitical factors converge. This analysis examines every major catalyst affecting BTC price action and provides detailed projections for the coming week.
Current Market Status
Bitcoin has experienced significant volatility over recent weeks, recovering from lows near $60,000 following the US-Iran peace deal announcement. The cryptocurrency has shown resilience, climbing back above $65,000 at its peak before settling around current levels. The Fear and Gre
HighAmbition
#BTC
Bitcoin is currently trading at approximately $63,750, representing a critical juncture in the market as multiple macroeconomic and geopolitical factors converge. This analysis examines every major catalyst affecting BTC price action and provides detailed projections for the coming week.
Current Market Status
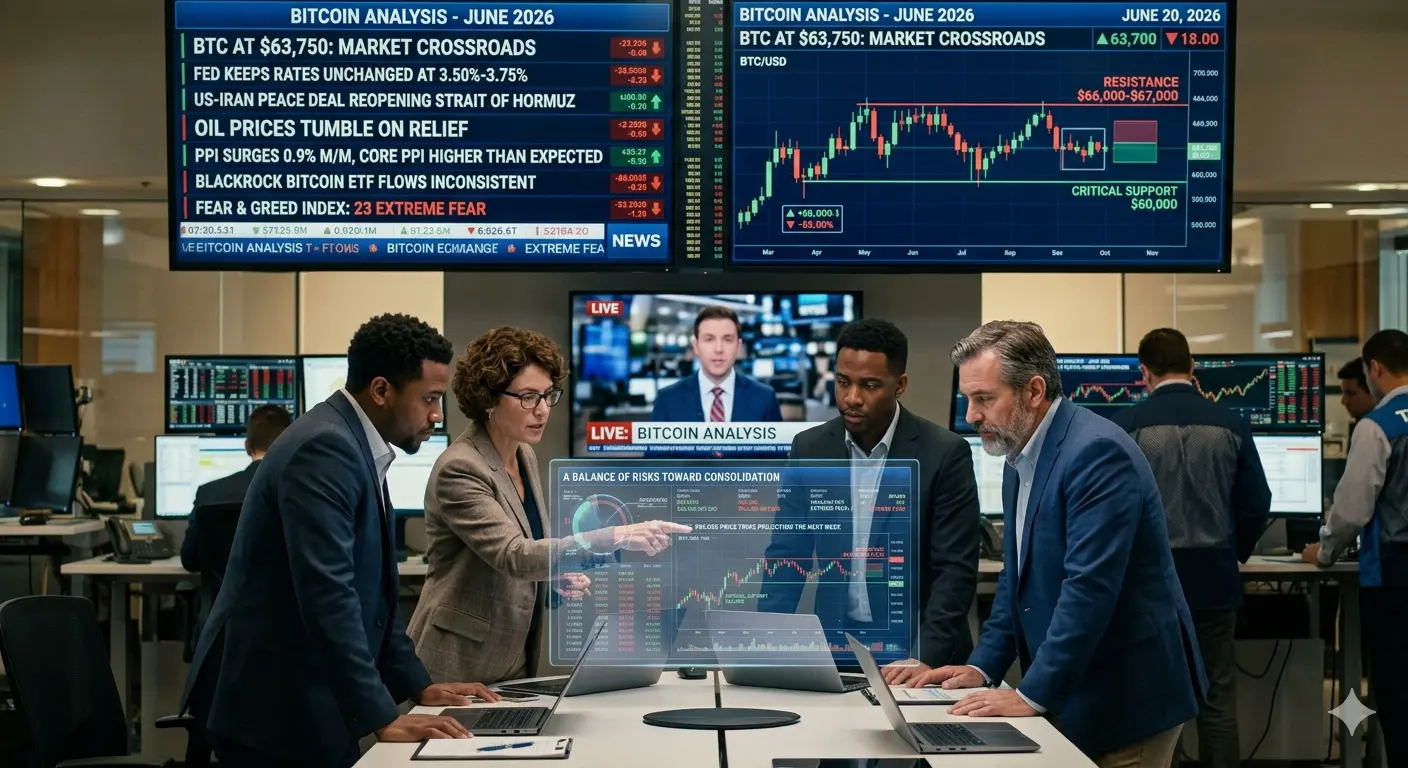
Bitcoin has experienced significant volatility over recent weeks, recovering from lows near $60,000 following the US-Iran peace deal announcement. The cryptocurrency has shown resilience, climbing back above $65,000 at its peak before settling around current levels. The Fear and Greed Index remains at a concerning 23, indicating Extreme Fear sentiment despite the recent bounce. This divergence between price recovery and market sentiment suggests the rally may be fragile and driven more by short-term factors than genuine conviction.
US-Iran Deal Impact Analysis
The preliminary peace agreement between the United States and Iran represents one of the most significant geopolitical developments affecting Bitcoin this month. The deal, mediated by Pakistan, includes reopening the Strait of Hormuz and lifting the US naval blockade of Iran. This development has had a mixed but generally positive impact on Bitcoin.
If the deal had failed or been postponed, Bitcoin would likely have faced severe downward pressure. Geopolitical tensions typically drive investors toward safe-haven assets like gold and the US dollar, while risk assets including Bitcoin suffer. The Strait of Hormuz closure would have disrupted approximately 20% of global oil supply, triggering energy price spikes and broader market instability. In such a scenario, Bitcoin could have retested the $60,000 support level or even broken below it toward $58,000-$59,000.
However, with the deal proceeding as planned and formal signing occurring in Switzerland, the geopolitical risk premium has been removed from markets. This has allowed Bitcoin to stabilize and attempt building a base. The reopening of the Strait of Hormuz has caused oil prices to tumble more than 4%, reducing inflationary pressures and providing breathing room for risk assets. Copper prices have surged on the deal news, indicating renewed risk appetite in commodity markets that often correlates with crypto sentiment.
Kevin Warsh Fed Meeting and Monetary Policy
Kevin Warsh has now chaired his first Federal Reserve meeting as the new Fed Chair, marking a significant shift in monetary policy communication. This meeting carried extraordinary importance for Bitcoin and broader crypto markets.
The Federal Reserve maintained interest rates unchanged at 3.50% to 3.75%, which was widely expected. However, the key developments came from updated economic projections and Warsh's communication style. The dot plot revealed that officials now expect the benchmark rate to reach 3.8% by year-end 2026, up from previous projections of 3.4%, signaling a more hawkish stance than markets anticipated.
Warsh has introduced significant changes to Fed communication, dropping forward guidance on future rate paths and establishing five task forces to overhaul central bank messaging. This creates uncertainty for markets, as investors can no longer rely on explicit Fed signals for future policy direction. The Fed has also signaled possible rate hikes later in 2026 if inflation persists, with markets now pricing in a 54% chance of a hike.
For Bitcoin, this hawkish shift presents headwinds. Higher interest rates reduce the attractiveness of non-yielding assets like Bitcoin, as investors can earn better returns in traditional fixed-income instruments. The removal of forward guidance increases market volatility, which typically pressures risk assets. However, if inflation data begins cooling, the Fed may still pivot toward easing, which would be bullish for Bitcoin.
CPI and PPI Data Impact
Inflation data remains crucial for Bitcoin price direction. Recent Producer Price Index readings have shown concerning trends, with July PPI surging 0.9% month-over-month against forecasts of 0.2%, and 3.3% year-over-year versus expected 2.5%. Core PPI also exceeded expectations at 0.9% monthly.
These elevated inflation readings reduce expectations for near-term Fed rate cuts, creating a challenging environment for Bitcoin. When CPI and PPI data exceed forecasts, it typically strengthens the US dollar and pressures Bitcoin lower as traders anticipate tighter monetary policy. Conversely, softer inflation data would support Bitcoin by increasing the probability of rate cuts.
The relationship between inflation data and Bitcoin has become increasingly pronounced in 2026 as institutional adoption has grown. Bitcoin now responds more sensitively to macroeconomic shifts, behaving increasingly like a risk asset rather than an inflation hedge. Traders should monitor upcoming CPI and PPI releases closely, as surprises in either direction can trigger significant Bitcoin volatility.
Technical Analysis and Market Structure
From a technical perspective, Bitcoin is showing mixed signals. The cryptocurrency is trading above its 100-day EMA at approximately $65,549, which provides some support. However, the MACD histogram and overall momentum indicators suggest caution.
Bitcoin's Sharpe ratio recently hit levels that have marked cycle lows since 2015, suggesting potential bottoming conditions. Long-term holders absorbed approximately 125,000 BTC in June, indicating strong conviction among seasoned investors. Strategy (formerly MicroStrategy) has continued accumulating Bitcoin, purchasing an additional 1,587 BTC for $100 million, bringing their total holdings above 800,000 coins.
However, bearish patterns persist. A bear flag formation remains intact on higher timeframes, with immediate TBO Support around $63,418. If this support fails, the technical target suggests a potential move toward $49,000 or even $38,555 in a worst-case breakdown scenario. Bitcoin dominance stands at 56.5%, with altcoins continuing to underperform, indicating that capital is not rotating aggressively into higher-risk crypto assets.
Open interest has been rising while funding rates remain negative, suggesting a short squeeze has been driving recent price appreciation. While this can fuel rallies, it also means the recovery lacks fundamental buying support and may be vulnerable to reversal.
Additional Market Factors
Several other factors merit consideration in this analysis. The Bank of Japan's rate decision carries significance for Bitcoin, as speculative short positions in the yen are at nine-year highs. If the BOJ signals more aggressive tightening, it could trigger a yen short squeeze and unwind carry trades that have supported risk assets, potentially impacting Bitcoin negatively.
SpaceX's historic IPO has created some distraction in markets, with the stock gaining nearly 40% in its first days of trading. Some analysts note that Cathie Wood sold Bitcoin-related positions to buy SpaceX shares, representing potential capital rotation away from crypto.
Bitcoin ETF flows remain critical to watch. BlackRock's Bitcoin ETF inflows have been inconsistent, and traders are hoping for a rebound in institutional demand to sustain price levels. The correlation between ETF inflows and Bitcoin price has strengthened considerably.
One-Week Price Projection
For the upcoming week, Bitcoin faces a challenging environment with multiple conflicting forces. The Iran deal provides a geopolitical relief tailwind, but Fed hawkishness and elevated inflation data create monetary headwinds.
The most likely scenario sees Bitcoin trading in a range between $62,000 and $67,000 over the next seven days. Support levels to watch include $63,418 (immediate TBO Support), $62,000 (psychological level), and $60,000 (critical support that marked the recent bottom). Resistance levels include $65,500 (recent highs), $66,000-$67,000 (congestion zone), and $68,000 (strong resistance).
If bearish technical patterns resolve to the downside, Bitcoin could test $60,000 again or potentially break lower toward $58,000. Conversely, if institutional buying resumes through ETFs and macro conditions stabilize, a move toward $68,000-$70,000 remains possible.
The balance of risks appears skewed toward further consolidation or mild downside rather than a strong breakout. Traders have been burned by collapsed ceasefires twice in recent months, creating skepticism about geopolitical-driven rallies. The Fed's hawkish pivot under Warsh removes a key bullish catalyst that had supported Bitcoin earlier in 2026.
Key Levels to Monitor
Critical support: $60,000 (must hold to maintain bullish structure)
Immediate support: $63,418
Resistance: $66,000-$67,000
Major resistance: $68,000-$70,000
Conclusion
Bitcoin at $63,750 represents a market at a crossroads. The Iran peace deal removes significant geopolitical risk, but monetary policy headwinds under the new Fed leadership create uncertainty. Technical indicators suggest caution, with bearish patterns still intact despite the recent bounce. For the coming week, expect continued volatility with a slight bearish bias as markets digest the Fed's new communication approach and await fresh inflation data. Long-term holders remain committed, but short-term price action will likely be driven by macroeconomic developments and institutional flow data.
#USIranTalksPostponed #TradFiCFDGoldMasters #STRC跌破面值11%創上市新低 #WarshDebutsAsFedHoldsRatesSteady
repost-content-media
  • Reward
  • Comment
  • Repost
  • Share
#MyGateTradeStory
XRP is currently trading at 1.1470, positioning itself in a critical consolidation zone. The cryptocurrency has been experiencing heightened volatility as institutional interest grows and regulatory clarity continues to evolve. Recent price action suggests a potential breakout scenario is developing, with traders closely monitoring key technical levels.
Technical Analysis Overview
Support Levels
The immediate support for XRP stands at 1.12, which has acted as a reliable floor during recent pullbacks. Below this, secondary support is located at 1.10, representing the previous
XRP-1.61%
HighAmbition
#MyGateTradeStory
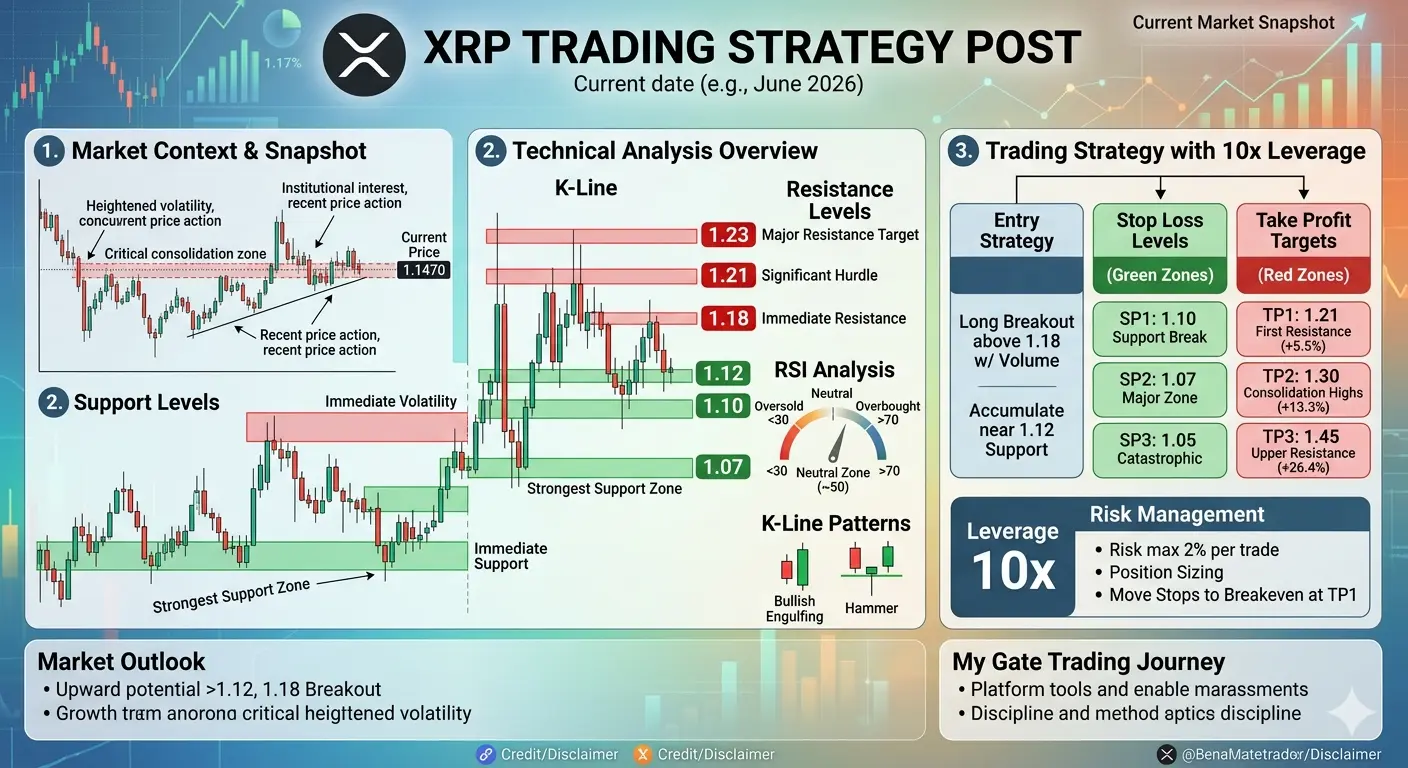
XRP is currently trading at 1.1470, positioning itself in a critical consolidation zone. The cryptocurrency has been experiencing heightened volatility as institutional interest grows and regulatory clarity continues to evolve. Recent price action suggests a potential breakout scenario is developing, with traders closely monitoring key technical levels.
Technical Analysis Overview
Support Levels
The immediate support for XRP stands at 1.12, which has acted as a reliable floor during recent pullbacks. Below this, secondary support is located at 1.10, representing the previous consolidation range low. The strongest support zone sits at 1.07, a level that has historically provided substantial buying interest and could serve as a safety net for long positions.
Resistance Levels
On the upside, XRP faces immediate resistance at 1.18, which aligns with the recent rejection zone. The next significant hurdle is 1.21, where previous selling pressure has been observed. The major resistance target is 1.23, a breakout above which could trigger a sustained rally toward higher price targets.
RSI Analysis
The Relative Strength Index is currently reading in the neutral zone, indicating that XRP is neither overbought nor oversold. This positioning provides room for movement in either direction. A reading below 30 would signal oversold conditions and potential buying opportunities, while readings above 70 would suggest overbought conditions and possible profit-taking scenarios.
K-Line Patterns
Recent candlestick formations show mixed signals with some indecision patterns emerging. The presence of higher lows on the daily timeframe suggests underlying bullish sentiment, though volume confirmation remains essential for validating any breakout attempts. Traders should watch for bullish engulfing patterns or hammer formations near support levels as potential entry signals.
Trading Strategy with 10x Leverage
Given the current price of 1.1470 and utilizing 10x leverage, here is a structured trading plan designed for optimal risk management.
Entry Strategy
Consider entering a long position if XRP breaks above 1.18 with volume confirmation. Alternatively, accumulate on dips toward the 1.12 support level with scaled entries. The position sizing should account for the 10x leverage multiplier, meaning a 10 percent move in price results in a 100 percent gain or loss on the leveraged position.
Stop Loss Levels
Protect your capital with strategic stop loss placement. Set SP1 at 1.10, representing a break below immediate support. Position SP2 at 1.07, the strongest support zone, as a secondary protection level. Maintain SP3 at 1.05 as a catastrophic stop to preserve account equity in case of unexpected market events.
Take Profit Targets
Plan your exits with disciplined profit-taking levels. Target TP1 at 1.21, capturing the first resistance zone for a 5.5 percent price move. Set TP2 at 1.30, representing a 13.3 percent gain and aligning with recent consolidation highs. Position TP3 at 1.45 for a 26.4 percent move, targeting the upper resistance zone and maximizing the risk-reward ratio.
Risk Management
With 10x leverage, risk management becomes paramount. Never risk more than 2 percent of your total trading capital on a single trade. Use position sizing calculations to determine appropriate entry amounts based on your stop loss distance. Monitor the trade actively and be prepared to adjust stops to breakeven once TP1 is achieved.
Market Outlook
XRP shows potential for upward movement if it can maintain support above 1.12 and break through the 1.18 resistance. The neutral RSI provides flexibility for both bullish and bearish scenarios. Institutional developments and broader market sentiment will likely dictate the next major directional move.
My Gate Trading Journey
Trading on Gate has provided access to advanced leverage options and comprehensive charting tools essential for executing this strategy. The platform's robust infrastructure supports precise entry and exit execution, which is critical when trading with leverage. Consistent application of technical analysis and disciplined risk management has been the foundation of successful trading outcomes.
Final Thoughts
This XRP trading setup offers a balanced approach with clear entry, exit, and risk management parameters. The 10x leverage amplifies both potential gains and losses, making strict adherence to stop losses essential. Monitor price action closely and adjust the strategy as market conditions evolve.
@Gate_Square
repost-content-media
  • Reward
  • Comment
  • Repost
  • Share
#WarshDebutsAsFedHoldsRatesSteady
Kevin Warsh stepped into the Fed on June 17, 2026, to chair his first FOMC meeting as the newly appointed chairman, inheriting an economy where inflation had been running above the 2% target for over five years and the labor market had just completed one of its weakest years in decades. Officials faced a dreaded two-sided battle: rescue jobs by cutting rates or fight inflation by hiking them. No central bank chair wants this scenario, and it set the stage for a debut nobody on Wall Street would forget.
The Iran Deal: BTC from 59k to 66k
Warsh arrived at the s
HighAmbition
#WarshDebutsAsFedHoldsRatesSteady
Kevin Warsh stepped into the Fed on June 17, 2026, to chair his first FOMC meeting as the newly appointed chairman, inheriting an economy where inflation had been running above the 2% target for over five years and the labor market had just completed one of its weakest years in decades. Officials faced a dreaded two-sided battle: rescue jobs by cutting rates or fight inflation by hiking them. No central bank chair wants this scenario, and it set the stage for a debut nobody on Wall Street would forget.
The Iran Deal: BTC from 59k to 66k
Warsh arrived at the same moment the 15-week US-Iran conflict was ending. Trump confirmed a peace deal, and the memorandum was signed on June 17, the exact day of Warsh's press conference. Iran would restart oil exports immediately, the US Treasury issued waivers for Iranian crude, and the Strait of Hormuz would reopen within 30 days with at least 300 billion dollars in rehabilitation financing. Bitcoin, stuck around 59k during the conflict, ripped past 66k on June 15 alongside Nasdaq futures jumping 1.5% and WTI crude collapsing 5%. Crypto sentiment was overwhelmingly positive for the first time in months. Bitcoin ETFs showed early recovery after 13 consecutive outflow sessions totaling 4.4 billion dollars.
The FOMC Decision: Rates Held, Hawkish Bomb Dropped
Then June 17 arrived and everything changed. The FOMC held rates at 3.5% to 3.75%, exactly as expected. But the decision was never the story. Warsh's first policy statement clocked in at only 132 words, dramatically shorter than previous ones. He noted it was "a bit shorter, a bit simpler, and dispenses with some older language." The most critical removal was any language signaling a bias toward future rate cuts. Gone was any suggestion the next move would be downward. The door to rate hikes was left wide open.
The dot plot showed nine of 19 policymakers penciling in at least one rate hike by end of 2026. Nearly half of officials said they could support a hike later this year. The prior outlook for a 2026 rate cut was removed entirely. Warsh himself abstained from the dot plot, refusing to submit his own rate-path projection. He has long criticized forward guidance, arguing it limits decision-making and creates market expectations the Fed feels pressured to fulfill even when conditions change.
Warsh's Statement: Price Stability a Dozen Times
In his press conference, Warsh made his hawkish posture unmistakable. He used the term "price stability" approximately a dozen times. He spoke of the committee's "unambiguous and unanimous" resolve to get inflation under control. He declared forward guidance is not "well suited" to the current moment and stated: "I can't give you any forward guidance about what we're going to do next." He announced five independent task forces to overhaul the Fed's communications, balance sheet, data sources, productivity and jobs, and inflation frameworks. He expressed interest in alternative inflation measures like trimmed-mean metrics rather than relying solely on core PCE, signaling a fundamental rethink of how the Fed measures and targets inflation.
The Market Reaction: Iran Euphoria Crushed
The timing created one of the most dramatic contrast moments in recent market history. As Warsh spoke, Bitcoin fell from above 66k toward 64k, then further to around 63k the next day, touching 62.8k. Over 400 million dollars in leveraged crypto positions were wiped out in 24 hours. The S&P 500 tumbled 1.2%, the worst Fed Day for a new chairman since 1994. Nasdaq slid 1.29%. Bond yields surged. The Iran deal removed the geopolitical risk premium, but Warsh immediately replaced it with a monetary policy risk premium. The net effect was Bitcoin ending around 62k to 63k, having traveled from 59k up to 66k and back down in under a week. DoubleLine Capital CEO Jeffrey Gundlach noted that Warsh will aim for price stability instead of being the "easy money Chairman" people thought.
Can the Fed Cut Rates Next?
CME FedWatch shows traders pricing a 50% chance of a September rate hike, up from 27% a day before. J.P. Morgan sees the Fed on hold through 2026 before hiking 0.25 in September 2027. Citigroup pushed back its rate-cut timeline by a month, now forecasting 0.25 cuts in October and December 2026 followed by another in January 2027. Nomura and Bank of America see growing risk of rate hikes this year. Without forward guidance, investors must rely on incoming data and Fed officials' speeches. If a cut happens, it requires significant labor deterioration or dramatic inflation decline. The May payrolls estimate was 85k with unemployment at 4.3%, but inflation remains well above 2%.
Under the most optimistic cut scenario, Citi's forecast of 0.5 percentage points by year-end could materialize. Under the hawkish scenario, a 0.25 hike as early as September takes the range to 3.75% to 4.0%. Under J.P. Morgan's baseline, rates stay unchanged through 2026.
What Happens Next
Hawkish path: inflation stays sticky, September delivers a 0.25 hike, pushing Bitcoin toward 55k to 58k. Hold-and-wait path: inflation moderates gradually, crypto continues basing in 60k to 65k for months. Surprise dovish pivot: payrolls fall below 50k and unemployment rises above 5%, potentially launching Bitcoin toward 80k. Political pressure: Trump intensifies demands for cuts; Warsh resists, strengthening his credibility or creating institutional instability.
Across all scenarios, Warsh's Fed will be less predictable than Powell's. Forward guidance removed, dot plot abstention, shorter statements, and five task forces point toward a central bank that intends to keep markets guessing. Crypto investors should expect continued volatility, potential extended basing between 60k and 68k, and the possibility that the bullish breakout at 66k may be delayed until the rate-cut narrative returns, which under the most optimistic forecasts means October at the earliest. Warsh has made his entrance. The rules have changed. Markets are still learning how to play by them.
@Gate_Square #MyGateTradeStory
repost-content-media
  • Reward
  • Comment
  • Repost
  • Share
#MyGateTradeStory
#ZHIPU
ZHIPU is currently trading at 274, showing resilience in the AI sector with strong institutional backing. The company has demonstrated impressive growth with revenue climbing 132% year-on-year to 724 million yuan in 2025.
Current Market Structure
Price: 274
ZHIPU has established itself as a leading Chinese AI model developer, competing with global players like OpenAI and domestic rival DeepSeek. The stock has gained significant momentum following strong earnings and institutional upgrades from JPMorgan and Bank of America.
Key Technical Levels
Support Zones:
- Immedi
ZHIPU-16.51%
HighAmbition
#MyGateTradeStory
#ZHIPU
ZHIPU is currently trading at 274, showing resilience in the AI sector with strong institutional backing. The company has demonstrated impressive growth with revenue climbing 132% year-on-year to 724 million yuan in 2025.
Current Market Structure
Price: 274
ZHIPU has established itself as a leading Chinese AI model developer, competing with global players like OpenAI and domestic rival DeepSeek. The stock has gained significant momentum following strong earnings and institutional upgrades from JPMorgan and Bank of America.
Key Technical Levels
Support Zones:
- Immediate Support: 260-265
- Strong Support: 250
- Critical Support: 240
Resistance Levels:
- First Resistance: 285-290
- Second Resistance: 300
- Major Resistance: 320
RSI Indicator
Current RSI readings suggest balanced momentum with room for upward expansion. The indicator is not in overbought territory, indicating potential for continued price appreciation.
K-Line Analysis
Recent price action shows consolidation above key support levels with increasing volume on up days. The chart pattern indicates accumulation by smart money ahead of potential breakout moves.
Trade Plan
Entry Zone: 270-275
This entry zone offers a favorable risk-reward setup with proximity to support and upside potential toward resistance targets.
Target 1: 290
Target 2: 310
Target 3: 330
Stop Loss: 258
Risk Management
The stop loss at 258 provides protection below the critical support zone while allowing normal price fluctuation. Consider scaling out 30% at Target 1, 40% at Target 2, and letting the remainder run toward Target 3 with trailing stops.
Market Catalysts
ZHIPU continues to benefit from strong AI adoption tailwinds in China, pricing power improvements with recent 8-17% price increases for its GLM-5.1 model, and favorable regulatory environment as US AI restrictions create opportunities for domestic alternatives.
@Gate_Square #MyGateTradingMoment
repost-content-media
  • Reward
  • Comment
  • Repost
  • Share
#MyGateTradeStory
Every trader has one unforgettable trade that stays with them forever. A trade that proves the value of patience discipline and confidence. For me that moment happened on Gate.io during a late evening trading session that started like any ordinary day but ended as one of the most exciting experiences of my crypto journey.
It was around 8 PM and I was sitting with a hot cup of tea while watching the markets. I often spend hours studying charts following market sentiment and searching for opportunities. That evening I had only 6 dollars available in my trading account. It was
HighAmbition
#MyGateTradeStory
Every trader has one unforgettable trade that stays with them forever. A trade that proves the value of patience discipline and confidence. For me that moment happened on Gate.io during a late evening trading session that started like any ordinary day but ended as one of the most exciting experiences of my crypto journey.
It was around 8 PM and I was sitting with a hot cup of tea while watching the markets. I often spend hours studying charts following market sentiment and searching for opportunities. That evening I had only 6 dollars available in my trading account. It was not a large amount of capital but I have always believed that successful trading is not determined by account size. It is determined by timing analysis and execution.
As I monitored the market I noticed something unusual happening with NEAR Protocol. The coin had been trading near 20 dollars but suddenly heavy selling pressure entered the market. The price started falling rapidly and panic was spreading among traders. While many people were trying to predict a recovery I focused on what the chart was actually showing.
What caught my attention even more was seeing NEAR appear in the trending section on Gate.io. Trading volume was increasing sharply and discussions about the crash were everywhere. Whenever a coin becomes one of the most talked about assets during a major move it often creates powerful opportunities for traders who can remain calm and objective.
Instead of rushing into a position I spent time analyzing the market structure. The trend remained strongly bearish and sellers continued dominating the order flow. The more I studied the chart the more convinced I became that the downside move was not finished.
Finally I made my decision.
Using my available 6 dollars I opened a short position on NEAR around the 14 dollar level. Once the trade was active my focus intensified. Every candle mattered. Every move on the chart became important. I continued sipping my tea while watching the market unfold in real time.
Between 8 PM and 11 PM the trade developed almost exactly as I had anticipated. Selling pressure remained aggressive and buyers struggled to regain control. The price continued moving lower and my position steadily moved deeper into profit.
The excitement was incredible.
Watching a trade work in your favor is always satisfying but it becomes even more memorable when your analysis aligns perfectly with market behavior. Every new drop in price increased my confidence but I constantly reminded myself not to become greedy.
One of the most important lessons in trading is understanding that unrealized profit is not actual profit. Many traders lose winning positions because they become obsessed with capturing every last dollar from a move. I did not want to fall into that trap.
Eventually NEAR dropped to around 6 dollars and I decided it was time to secure my gains. I closed my short position and locked in the profit.
At that moment my account had grown from approximately 6 dollars to around 36 dollars.
The feeling was unbelievable.
For some people 36 dollars may not seem like a life changing amount but for me it represented something much bigger. It was proof that discipline patience and proper market analysis can produce meaningful results regardless of starting capital.
I remember feeling incredibly happy. The satisfaction was not only about the money. It was about making the right decision at the right time and seeing that decision rewarded by the market.
What makes this story even more interesting is what happened afterward.
After I exited my position NEAR continued falling. The price eventually dropped close to 1.5 dollars. Many traders might look at that and think I exited too early. However I have never regretted my decision.
Why?
Because successful trading is not about catching the exact top or the exact bottom. It is about consistently taking profits and protecting capital. I entered according to my analysis and exited when I felt the reward was reasonable. That is what professional risk management looks like.
This trade taught me several lessons that I still carry with me today.
First it showed the importance of staying alert to trending market opportunities.
Second it reinforced the value of patience and waiting for confirmation before entering a trade.
Third it reminded me that taking profits is never a mistake.
Fourth it proved that even a small trading account can achieve impressive growth when combined with discipline and proper strategy.
Most importantly it gave me confidence in my ability to read market conditions and act decisively when opportunities appear.
Gate.io played a major role in this experience.
The platform helped me identify the trending move monitor real time market activity and execute my strategy efficiently. Without those tools I might never have recognized the opportunity that NEAR presented that evening.
Even today whenever I sit with a cup of tea and watch the charts I remember that night. I remember the excitement of seeing NEAR crash. I remember opening the short position around 14 dollars. I remember watching the price continue lower while my confidence grew.
And I remember the satisfaction of turning 6 dollars into 36 dollars in just a few hours.
Trading is not only about profits and losses. It is about experiences lessons and personal growth. Some trades are forgotten within days while others become memories that stay with you forever.
That night between 8 PM and 11 PM became one of those memories for me.
It was the night a simple cup of tea a 6 dollar account and a well timed short on NEAR created one of the most memorable moments of my trading journey.
@Gate_Square #MyGateTradingMoment
repost-content-media
  • Reward
  • Comment
  • Repost
  • Share
#MyGateTradeStory
My journey with Gate.io has now crossed more than 3 years and looking back I can honestly say that Gate.io has been one of the most important parts of my crypto experience. During these years I have learned valuable trading lessons discovered new opportunities and achieved milestones that once felt impossible. Every trade has taught me something but one recent Bitcoin trade stands out as one of my most memorable experiences.
The crypto market was going through an extremely tense period. Global uncertainty was rising due to the Iran conflict and fear was spreading across fina
BTC0.45%
HighAmbition
#MyGateTradeStory
My journey with Gate.io has now crossed more than 3 years and looking back I can honestly say that Gate.io has been one of the most important parts of my crypto experience. During these years I have learned valuable trading lessons discovered new opportunities and achieved milestones that once felt impossible. Every trade has taught me something but one recent Bitcoin trade stands out as one of my most memorable experiences.
The crypto market was going through an extremely tense period. Global uncertainty was rising due to the Iran conflict and fear was spreading across financial markets. Bitcoin was experiencing strong volatility and many traders were unsure about the next major move. News headlines were changing every hour and market sentiment could shift within minutes.
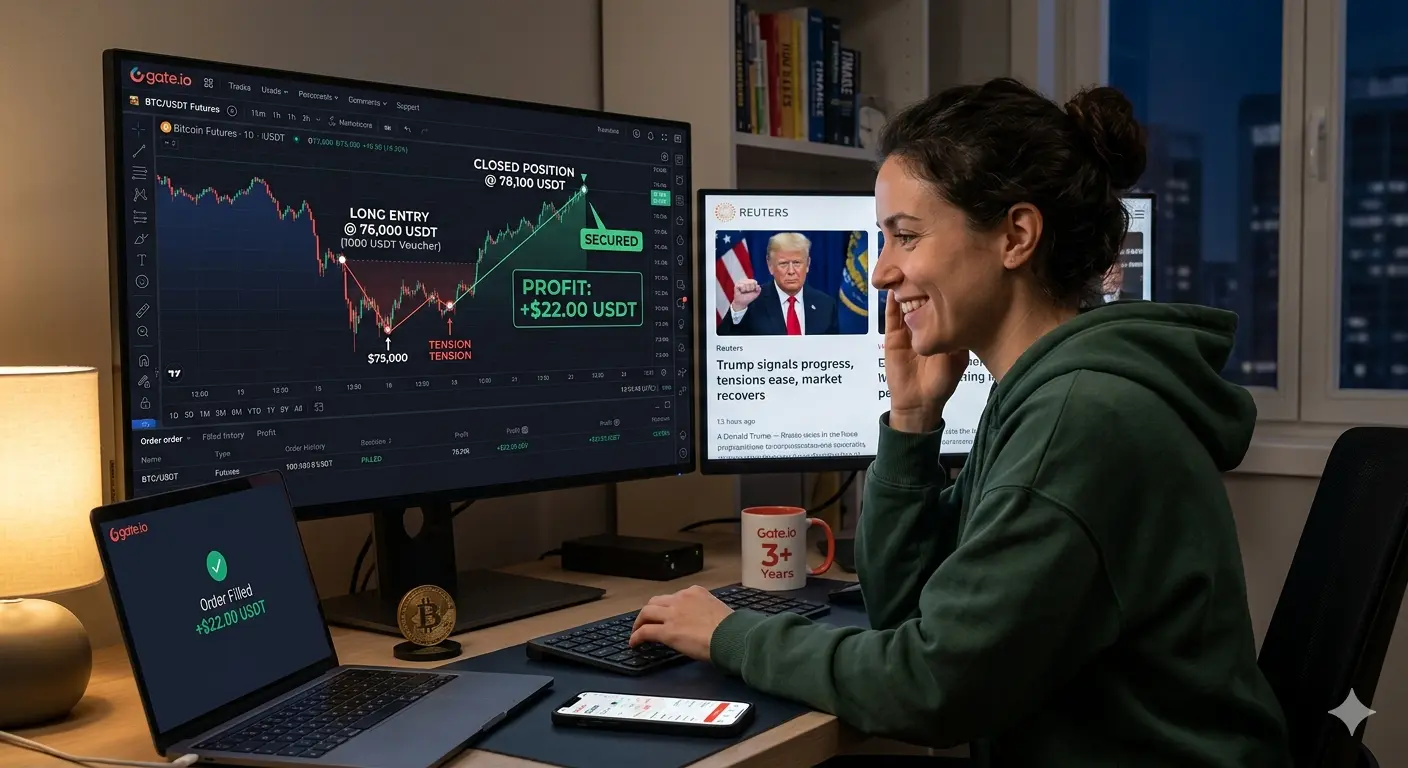
Around that time I received a 1000 USDT Position Voucher from Gate.io. I was excited because it provided me with an opportunity to participate in the market without risking additional personal capital. However I knew that receiving a voucher alone was not enough.
Success would still depend on making the right trading decision.
Bitcoin was trading around 76,000 dollars when I started analyzing the market. Despite the fear surrounding the geopolitical situation I believed that much of the panic had already been priced in. After studying the chart and market sentiment I decided to open a long position on BTC using the voucher.
At first the market did not move in my favor.
Shortly after entering the trade Bitcoin dropped further toward 75,000 dollars. Watching the market move against my position was not easy.
Like every trader I felt pressure and uncertainty.
Questions started appearing in my mind. Had I entered too early? Was the market going to continue falling? Should I close the trade and protect what remained?
But instead of reacting emotionally I stayed patient.
One full day passed and the market remained under pressure. The uncertainty surrounding the conflict continued and traders remained cautious. Even though the position was not performing as expected I trusted my analysis and decided to stay focused.
Then everything changed.
A major statement from Donald Trump suggested that discussions and agreements were progressing and that tensions could ease.
Almost immediately market sentiment began shifting. Fear started disappearing and optimism returned to the market.
Bitcoin responded exactly as I had hoped.
The price began climbing rapidly from around 75,000 dollars. Buyers returned with strength and momentum accelerated. Watching the market reverse after a difficult period was an incredible feeling. Every hour the trade looked stronger and stronger.
As Bitcoin continued rising the value of my position increased steadily. The market moved from approximately 75,000 dollars to 78,000 dollars and my profits kept growing. The patience that had felt difficult during the decline was now being rewarded.
By the time the third day was approaching completion I had earned approximately 22 dollars in profit from the position voucher trade.
At that moment I made an important decision.
Could Bitcoin continue higher?
Possibly.
Could I earn more by holding longer?
Maybe.
But I remembered one of the most valuable lessons I have learned during my three years on Gate.io:
Profit is profit.
I decided to close the position and secure my gains.
The feeling of closing that trade was amazing. It was not just about the 22 dollars. It was about seeing patience discipline and confidence rewarded. It was about trusting my analysis during a period when fear dominated the market. It was about staying calm when Bitcoin moved against me and avoiding emotional decisions.
That trade reminded me that successful trading is often less about predicting every market move and more about controlling your emotions. Many traders panic when prices fall.
Many traders become greedy when prices rise.
The real challenge is staying balanced between fear and greed.
Over the past three years Gate.io has helped me grow as a trader. I have learned how to analyze charts manage risk understand market psychology and most importantly remain patient during periods of uncertainty. Every experience whether profitable or not has contributed to my development.
This Bitcoin trade became special because it perfectly reflected everything I have learned throughout my journey. There was uncertainty.
There was pressure. There was patience. And finally there was success.
Whenever I think about my Gate.io experience I remember moments like this. Moments where preparation meets opportunity and confidence meets reward.
My journey is still continuing and there are many more trades ahead. But this BTC trade during a period of global uncertainty will always remain one of my favorite memories because it reminded me that patience often produces the best results.
Thank you Gate.io for the opportunities the lessons and the experiences over the past three years. The journey continues.
@Gate_Square #MyGateTradingMoment
repost-content-media
  • Reward
  • Comment
  • Repost
  • Share
#MyGateTradeStory
#BTC
Extended Bitcoin Technical Analysis and Trading Strategy for Next 3 Days
Current Market Situation
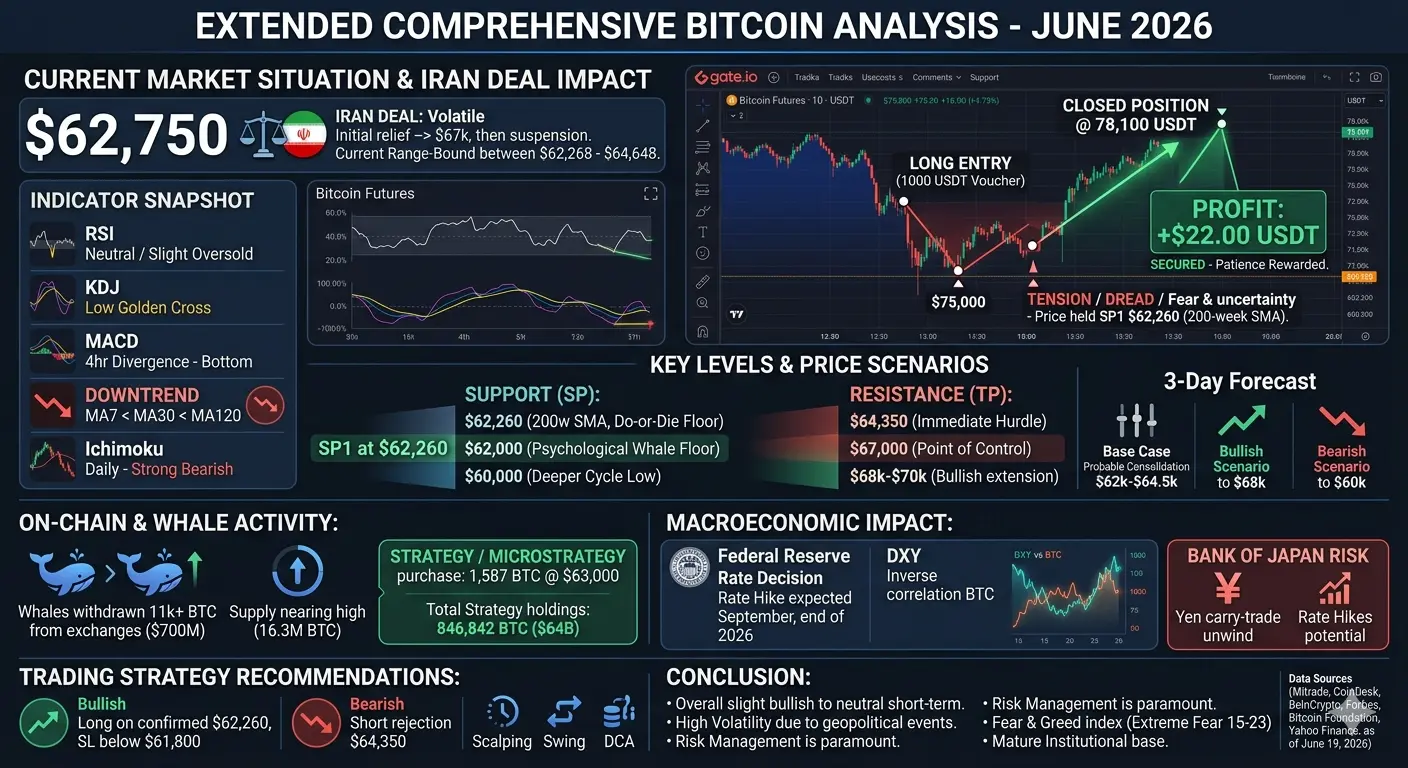
Bitcoin is currently trading at approximately $62,750, experiencing significant volatility following the recent US-Iran framework deal announcement. The price has been fluctuating between $62,268 and $64,648 over the past 24 hours with a daily decline of approximately 2 percent. The market is experiencing heightened uncertainty as traders remain cautious about the sustainability of the relief rally following geopolitical developments. Bitcoin ETF flows this week show $1.67
HighAmbition
#MyGateTradeStory
#BTC
Extended Bitcoin Technical Analysis and Trading Strategy for Next 3 Days
Current Market Situation
Bitcoin is currently trading at approximately $62,750, experiencing significant volatility following the recent US-Iran framework deal announcement. The price has been fluctuating between $62,268 and $64,648 over the past 24 hours with a daily decline of approximately 2 percent. The market is experiencing heightened uncertainty as traders remain cautious about the sustainability of the relief rally following geopolitical developments. Bitcoin ETF flows this week show $1.67 billion in weekly outflows, indicating institutional caution despite strategic accumulation by major holders.
Technical Analysis Overview
The daily chart reveals a downtrend structure with MA7 below MA30 below MA120, indicating bearish momentum persists. However, the 4-hour MACD shows bottom divergence suggesting potential for reversal, while KDJ has formed a golden cross at low levels signaling possible upward momentum. Volume analysis indicates panic selling during price drops, which often precedes stabilization phases. Bitcoin Sharpe ratio has hit a level that has marked every cycle low since 2015, though in each case it preceded months of basing rather than an immediate rebound.
Key Support and Resistance Levels
Critical Support Levels:
SP1: $62,260 - This represents the 200-week Simple Moving Average and recent holding level. Multiple analysts identify this as a do-or-die floor that must hold to prevent deeper declines.
SP2: $62,000 - Psychological support level that aligns with recent consolidation zones and whale-established floor.
SP3: $60,000 - Deeper cycle low and liquidity magnet if $62,000 fails to provide support. This level has been tested multiple times and represents strong historical support.
Key Resistance Levels:
TP1: $64,350 - Immediate resistance hurdle that was lost during recent Federal Reserve dot-plot reaction. Reclaiming this level opens the path for further upside movement.
TP2: $67,000 - Point of control and next major liquidity cluster where significant selling pressure may emerge.
TP3: $68,000 to $70,000 - Bullish extension target if geopolitical sentiment stabilizes and risk assets experience sustained rally.
RSI and K-Line Analysis
The Relative Strength Index is currently in neutral to slightly oversold territory on shorter timeframes, suggesting room for upward movement before reaching overbought conditions. K-line patterns show recent bottoming formations with bullish engulfing candles appearing on 4-hour charts, though confirmation requires sustained closes above resistance levels. The daily cloud analysis indicates Bitcoin has not yet closed inside the Ichimoku cloud, leaving the structure in strong bearish mode despite recent bounces.
Iran Deal Impact Assessment
The US-Iran framework agreement initially triggered a relief rally across risk assets including Bitcoin, pushing prices toward $67,000. However, subsequent reports of deal suspension and ongoing regional tensions have introduced fresh volatility. Historical patterns suggest traders have been burned by collapsed ceasefires in recent months, creating skepticism about sustained rallies. If the deal holds and de-escalation continues, Bitcoin could benefit from improved risk sentiment and capital rotation into digital assets. Conversely, any breakdown in negotiations would likely trigger risk-off flows pressuring BTC toward lower support levels.
Whale and Institutional Activity Analysis
On-chain data from mid-June highlights aggressive accumulation by large holders. Whales withdrew over 11,000 to 11,422 BTC worth approximately $700 million from exchanges to cold storage in early-to-mid June, signaling reduced selling pressure and confidence at lower prices. This followed a selling phase, with whales establishing a firm floor at $60,000 to $61,500. Whale addresses holding more than 100 BTC reached a 2026 record high of approximately 20,229 addresses.
Long-term holders with coins held 155 plus days added significantly, with supply nearing historical highs of approximately 16.3 million BTC and net accumulation of hundreds of thousands of BTC in recent months including approximately 316,000 in one 30-day period. These moves often coincided with retail panic selling during dips to approximately $59,000.
Strategy formerly MicroStrategy purchased 1,587 BTC worth approximately $100 million at around $63,000 average between June 8 to 14, bringing total holdings to 846,842 BTC worth approximately $64 billion. Spot Bitcoin ETFs saw inflows of positive $85.8 million on June 15, ending a short outflow streak, with broader institutional demand from 140 plus firms holding approximately 1.4 million BTC providing a support floor.
Federal Reserve and Macroeconomic Impact
The Federal Reserve held interest rates steady in June but reversed course saying to expect a quarter-point increase later this year. Short-term US interest-rate futures are now pricing in a bigger chance that the Federal Reserve will deliver a rate hike by September than opt to keep rates where they are. A near-majority of policymakers penciled a rate hike by the end of 2026 to combat higher inflation.
The Federal Reserve interest rate decisions have become one of the most important macroeconomic events for crypto markets. Crypto prices are highly sensitive to changes in capital flows, risk appetite, and US dollar strength, all of which are influenced by Fed policy. The US Dollar Index exhibits a strong inverse correlation with Bitcoin. During periods of global uncertainty, investors flock to the safety of the dollar pushing the DXY up and withdraw capital from speculative risk-on assets like Bitcoin, causing its price to drop.
Dollar weakness historically precedes Bitcoin rallies. Dollar down, yields down, Bitcoin up is the pattern that has preceded every major BTC rally of the past six years, and the current macro setup is starting to look like the early stages of something traders have seen before.
3-Day Price Forecast Scenarios
Base Case Scenario (Most Probable):
Bitcoin consolidates between $62,000 and $64,500 over the next 72 hours. Mixed signals regarding the Iran deal combined with Federal Reserve policy uncertainty will likely keep price action range-bound. Holding above $62,000 supports a modest relief bounce toward $64,000 resistance.
Bullish Scenario:
If Iran deal de-escalation receives positive follow-through and risk appetite improves, Bitcoin could reclaim $64,350 and quickly advance toward $67,000 to $68,000 by June 22. This scenario requires sustained positive geopolitical developments and supportive macro conditions.
Bearish Scenario:
Should the Iran deal collapse or broader risk-off sentiment emerge, a break and close below $62,000 would target $60,000 within 48 to 72 hours. Liquidity below this level remains thin until reaching the next major support zone.
Trading Strategy Recommendation
For bullish traders, consider entering long positions on confirmed holds above $62,260 with targets at $64,350, $67,000, and $68,000. Stop losses should be placed below $61,800 to protect against breakdown scenarios. Position sizing should remain conservative given elevated volatility.
For bearish traders, short opportunities emerge on rejections at $64,350 resistance with downside targets at $62,000 and $60,000. Risk management is crucial as short squeezes remain possible given elevated open interest and negative funding rates.
Alternative Trading Strategies
Scalping Strategy:
For active day traders, scalp longs on bounces from $62,000 support with quick 1 to 2 percent targets, using tight stops below $61,800. Scalp shorts on rejections at $64,300 with targets at $63,500.
Swing Trading Strategy:
Swing traders should wait for confirmed breakout above $64,350 or breakdown below $62,000 before establishing directional positions. Current range-bound conditions favor patience over aggressive positioning.
Dollar Cost Averaging:
Long-term investors may consider dollar cost averaging at current levels, given whale accumulation patterns and institutional buying supporting the $60,000 to $62,000 zone as a strong accumulation area.
Market Bias Conclusion
The overall bias remains slightly bullish to neutral short-term while $62,000 support holds, though high volatility is expected due to fluid Iran situation developments. Traders should monitor the $62,000 to $64,300 range closely over the weekend for directional clues. Institutional flows remain mixed with spot ETF outflows in May totaling $2.30 billion, though MicroStrategy continues accumulating positions suggesting long-term confidence persists.
Risk management remains paramount in current conditions with geopolitical headlines capable of generating rapid price movements in either direction. The Fear and Greed Index remains in Extreme Fear territory between 15 to 23, historically presenting contrarian buying opportunities for patient investors.
Bank of Japan Rate Decision Impact
Bitcoin traders are increasingly focused on Bank of Japan meetings where rate hikes could echo past shocks to crypto markets. A stronger yen and rapid carry-trade unwind could trigger broad market volatility, with bitcoin likely among the hardest-hit assets. A large build-up of speculative short positions in the yen raises the risk of a sharp short squeeze if the Bank of Japan signals more aggressive tightening, potentially unwinding yen-funded carry trades that support risk assets.
Long-term Outlook
Analysts note a classic mid-cycle correction pattern, with whales and institutions absorbing dips while retail remains cautious, pointing to potential upside if inflows persist and macro conditions stabilize. Bitcoin price predictions for 2026 range from conservative $80,000 targets to bullish $250,000 forecasts if institutional demand, ETF flows, and broader liquidity conditions strengthen.
The fair counter to current bearish sentiment is that Bitcoin institutional ownership base is still maturing, and that the ETF inflows from 2024 and 2025 have brought in investors who treat it as a growth or speculative allocation rather than a monetary hedge. As institutional infrastructure continues developing, Bitcoin may increasingly decouple from traditional risk assets.
Final Trading Recommendations
Monitor key levels closely: $62,260 for support confirmation, $64,350 for bullish breakout confirmation. Watch Federal Reserve communications and Iran deal developments for macro catalysts. Maintain conservative position sizing given elevated volatility. Consider both long and short setups based on confirmed breaks of key levels rather than anticipatory entries. Keep stop losses tight and take profits incrementally rather than holding for extended targets.
@Gate_Square #WarshDebutsAsFedHoldsRatesSteady #USIran14PointMemoLeaked #MyGateTradingMoment
repost-content-media
  • Reward
  • Comment
  • Repost
  • Share
#ETHMarketAnalysis
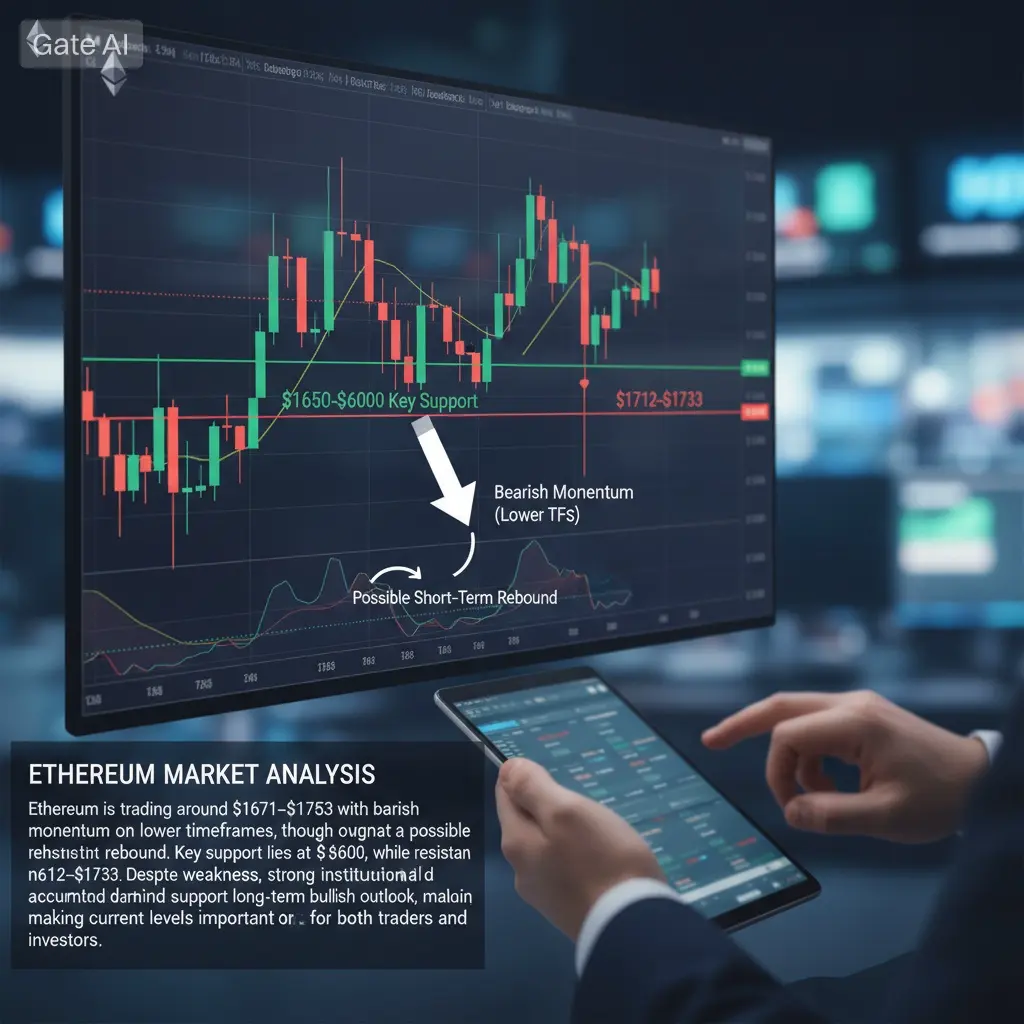
Ethereum is currently navigating through a challenging phase in mid-June 2026, trading in the range of approximately 1671 to 1753 dollars after experiencing a decline of around 3 percent over the past 24 hours. The market sentiment among traders remains predominantly cautious with a bearish bias dominating the lower timeframes. This analysis aims to provide investors with a detailed examination of the current market conditions, key technical levels, institutional developments, and strategic considerations for potential trading opportunities.
Current Market Structure and Pri
HighAmbition
#ETHMarketAnalysis
Ethereum is currently navigating through a challenging phase in mid-June 2026, trading in the range of approximately 1671 to 1753 dollars after experiencing a decline of around 3 percent over the past 24 hours. The market sentiment among traders remains predominantly cautious with a bearish bias dominating the lower timeframes. This analysis aims to provide investors with a detailed examination of the current market conditions, key technical levels, institutional developments, and strategic considerations for potential trading opportunities.
Current Market Structure and Price Action
The Ethereum market structure has shifted into a bearish alignment across multiple timeframes. On the 15-minute and daily charts, the moving averages are positioned in a descending order with MA7 below MA30 and MA30 below MA120, which signals sustained selling pressure. The price action has broken below several critical support zones that previously held firm, indicating that sellers are currently in control of the market momentum. Volume analysis reveals significantly increased trading activity during the recent decline, which is characteristic of panic selling behavior where long positions are being liquidated and weak hands are exiting the market.
Despite the bearish structure, technical indicators such as the Commodity Channel Index and Williams Percent Range are currently showing oversold conditions. This divergence between price action and momentum indicators suggests that the selling pressure may be reaching exhaustion levels. Furthermore, the 4-hour MACD is forming a bullish divergence pattern, which historically precedes short-term relief rallies or trend reversals. These oversold signals combined with divergence patterns indicate that a technical bounce could materialize in the near term, though the broader trend remains tilted to the downside until proven otherwise.
Key Support and Resistance Levels
Understanding critical price zones is essential for effective risk management and trade planning. The immediate support levels for Ethereum are clustered around 1697 dollars and 1671 dollars, with deeper support found at 1654 dollars and 1631 dollars. The most significant long-term support zone lies between 1650 and 1600 dollars, representing a critical demand area where institutional buyers have historically shown interest. A decisive break below this zone could open the path toward 1500 dollars or lower.
On the resistance side, the first major hurdle is located between 1712 and 1715 dollars, which coincides with a fair value gap from previous price action. The next resistance cluster spans from 1720 to 1733 dollars, representing recent equilibrium levels where supply has previously overwhelmed demand. Stronger resistance is found between 1753 and 1780 dollars, with the major rejection zone from recent highs situated at 1820 to 1850 dollars. For a genuine bullish reversal to occur, Ethereum would need to establish a decisive close above 1733 dollars with strong volume confirmation, which would shift the target range toward 1820 dollars and potentially higher.
Institutional Accumulation and Bitmine Developments
One of the most significant developments in the Ethereum ecosystem is the aggressive accumulation strategy being executed by Bitmine Immersion Technologies, a company led by renowned market strategist Tom Lee. Bitmine has emerged as the largest corporate Ethereum holder globally, now controlling approximately 5.62 million ETH tokens, which represents roughly 4.5 percent of Ethereum's total circulating supply. This positions Bitmine as the second-largest crypto treasury after Strategy's Bitcoin holdings.
Bitmine's accumulation strategy has been remarkably consistent throughout 2026, with the company purchasing over 1 million ETH since the beginning of the year. Their most recent major acquisition involved approximately 111,942 ETH valued at around 237 million dollars, representing their largest single purchase of 2026. The company has stated that their internal target is to reach 5 percent of Ethereum's total supply, a milestone they refer to as the "Alchemy of 5 percent." At current holdings, they are approximately 90 percent of the way toward achieving this ambitious goal.
What makes Bitmine's strategy particularly noteworthy is that over 4.7 million of their ETH holdings are currently staked, representing approximately 87 percent of their total position. This staking activity generates an estimated annualized revenue of 276 million dollars for the company, demonstrating a long-term conviction in Ethereum's utility as a yield-generating asset. Tom Lee has publicly described recent Ethereum pullbacks as "attractive opportunities" and maintains his thesis that Ethereum is currently in the "early stages of crypto spring." His outlook is driven by two primary catalysts: Wall Street tokenization and the integration of agentic artificial intelligence on the Ethereum network.
Factors Driving Ethereum Price Appreciation
Several fundamental catalysts are positioned to potentially drive Ethereum's price higher in the coming months. The Ethereum network continues to undergo significant structural improvements through its Layer 2 scaling solutions, which have substantially reduced transaction costs and increased network capacity. These upgrades are attracting institutional interest as they make Ethereum more viable for enterprise applications and large-scale financial operations.
The growth of stablecoins on Ethereum remains a critical demand driver, with the network serving as the primary settlement layer for the majority of dollar-denominated digital assets. As traditional finance continues to explore blockchain integration, Ethereum's position as the leading smart contract platform provides it with a significant competitive advantage. The ongoing development of real-world asset tokenization is expected to bring trillions of dollars of traditional assets onto blockchain networks, with Ethereum positioned to capture a substantial portion of this migration.
Exchange-traded fund flows represent another important variable for Ethereum's price trajectory. While recent weeks have seen some outflows from ETH ETFs, the broader trend of institutional adoption through regulated investment vehicles continues to expand. Major financial institutions including Bank of America have disclosed significant indirect exposure to Ethereum through ETF holdings and investments in crypto-related companies, signaling growing mainstream acceptance.
Trading Strategies and Risk Management
For traders considering Ethereum positions at current levels, several strategic approaches warrant consideration. The bearish bias on lower timeframes suggests that short-term traders should focus on resistance rejections and breakdowns for short entries. Potential short setups would involve waiting for price to retest the 1712 to 1739 dollar resistance zone with bearish reversal candlestick patterns such as rejection wicks or bearish engulfing formations. Downside targets would cascade toward 1697 dollars, then 1671 dollars, followed by 1654 dollars and 1631 dollars, with a potential extension toward 1603 dollars if momentum accelerates.
For those considering long positions, the oversold technical indicators present a potential mean reversion opportunity, though caution is warranted given the broader bearish structure. A more conservative long entry would require a decisive close above 1733 dollars with strong volume, which would shift the bias toward upside targets at 1820 to 1850 dollars. Risk management remains paramount, with stop losses recommended above recent swing highs for short positions and below key support levels for long positions.
Recommendation for Investors
For investors with a medium to long-term horizon, the current price levels present a potentially attractive accumulation opportunity, particularly in light of institutional buying activity from entities like Bitmine. The fundamental case for Ethereum remains robust, with network upgrades, institutional adoption, and the expanding ecosystem of decentralized applications providing underlying value support.
Investors considering dollar-cost averaging into Ethereum positions may find the current discount from all-time highs compelling. The price is currently trading approximately 55 percent below its August 2025 peak of nearly 4954 dollars, which may represent a favorable risk-reward profile for patient capital. However, it is essential to maintain proper position sizing and only allocate capital that can withstand potential further downside volatility.
The staking opportunity on Ethereum continues to offer attractive yields for holders willing to lock up their assets, with current annual percentage rates providing passive income alongside potential price appreciation. This yield component distinguishes Ethereum from many other digital assets and aligns with the strategies being employed by sophisticated institutional investors.
Conclusion
Ethereum finds itself at a critical juncture where technical weakness is meeting fundamental strength. The bearish price structure and oversold conditions suggest that near-term volatility is likely to persist, with the potential for both further downside and sharp relief rallies. Key support levels between 1650 and 1600 dollars will be critical to monitor, as a break below this zone could accelerate selling pressure. Conversely, a reclaim of 1733 dollars would signal a potential trend reversal.
The institutional accumulation by Bitmine and other corporate entities provides a compelling counter-narrative to the current price weakness. Their continued buying during pullbacks suggests that smart money views current levels as attractive entry points for long-term positioning. Combined with the ongoing network developments and expanding use cases, the foundation for Ethereum's next major move higher appears to be building, even if the timing remains uncertain.
Investors and traders should remain disciplined in their approach, utilizing the identified support and resistance levels for trade planning while maintaining appropriate risk management protocols. The market is likely to remain volatile in the near term, but the confluence of oversold technical conditions and strong institutional demand creates an environment where patient and prepared participants may find favorable opportunities.
@Gate_Square #MyGateTradeStory #STRC跌破面值11%創上市新低
repost-content-media
  • Reward
  • Comment
  • Repost
  • Share
#广场预测世界杯赢40000U
Paraguay vs Turkey - World Cup 2026 Group D Match Preview
Both Paraguay and Turkey enter this crucial Group D clash at Hard Rock Stadium in Miami with opening-day defeats, making this a must-win encounter for both sides to keep their Round of 32 hopes alive.
Key Facts
Turkey lost 0-2 to Australia in their opener despite creating chances, while Paraguay suffered a heavy 4-1 defeat to the United States, exposing defensive vulnerabilities. This match on June 20, 2026, at 11:00 UTC at San Francisco Bay Area (Santa Clara) represents a critical turning point for both teams.
Team Ana
HighAmbition
#广场预测世界杯赢40000U
Paraguay vs Turkey - World Cup 2026 Group D Match Preview
Both Paraguay and Turkey enter this crucial Group D clash at Hard Rock Stadium in Miami with opening-day defeats, making this a must-win encounter for both sides to keep their Round of 32 hopes alive.
Key Facts
Turkey lost 0-2 to Australia in their opener despite creating chances, while Paraguay suffered a heavy 4-1 defeat to the United States, exposing defensive vulnerabilities. This match on June 20, 2026, at 11:00 UTC at San Francisco Bay Area (Santa Clara) represents a critical turning point for both teams.
Team Analysis
Turkey brings technical quality and creativity under Vincenzo Montella, with key talents like Arda Guler from Real Madrid, Kenan Yildiz, Hakan Calhanoglu, and Ferdi Kadioglu. They will likely dominate possession and attack more aggressively following their Australia setback. Their European-based squad offers superior technical ability and set-piece threat.
Paraguay under Gustavo Alfaro relies on physicality, defensive organization, and the famous Garra Guarani fighting spirit. Captain Gustavo Gomez anchors the back line, while Julio Enciso and Miguel Almiron provide attacking outlets. Expect them to sit compact and look for counter-attacking opportunities.
Tactical Outlook
Turkey's European flair and wide play will clash with Paraguay's physical duels and transition game. Turkey should enjoy more possession and create better chances, but Paraguay's defensive discipline could frustrate them. The South American side's counter-attacking threat through Enciso and Almiron remains dangerous.
My Prediction
Turkey 2-1 Paraguay. Turkey's superior squad depth, technical quality, and urgency make them favorites in this must-win scenario. However, Paraguay's grit and defensive resilience keep this competitive. Turkey's need for victory should drive them forward, and their attacking talents are likely to find breakthroughs against a Paraguay defense that conceded four against the USA.
Market Sentiment
Prediction markets and analyst consensus favor Turkey in this European versus South American battle. Turkey's quality should ultimately edge it, but Paraguay's fighting spirit means this will not be straightforward.
@Gate_Square
repost-content-media
  • Reward
  • Comment
  • Repost
  • Share
#MyGateTradeStory
BEAT Token Trading Strategy Analysis
Current Market Status
- Current Price : $1.88
- Market Sentiment Bearish
- Fear & Greed Index 14 (Extreme Fear)
- 14-Day RSI 42.44 (Neutral - not overbought or oversold)
- Volatility. 89.03% (Extremely High)
- 50-Day SMA $1.83
- 200-Day SMA$0.9951
Key Support and Resistance Levels
Support Levels (SL Zones):
-
SL1$1.60 (Immediate support - 14.56% below current)
-
SL2 $1.45 (Strong support zone)
-
SL3 $1.34 (Previous consolidation area)
-
SL4 $1.25 (Critical support - 33% drawdown potential)
-
SL5. $1.14 (Major support - Jun
HighAmbition
#MyGateTradeStory
BEAT Token Trading Strategy Analysis
Current Market Status
- Current Price : $1.88
- Market Sentiment Bearish
- Fear & Greed Index 14 (Extreme Fear)
- 14-Day RSI 42.44 (Neutral - not overbought or oversold)
- Volatility. 89.03% (Extremely High)
- 50-Day SMA $1.83
- 200-Day SMA$0.9951
Key Support and Resistance Levels
Support Levels (SL Zones):
-
SL1$1.60 (Immediate support - 14.56% below current)
-
SL2 $1.45 (Strong support zone)
-
SL3 $1.34 (Previous consolidation area)
-
SL4 $1.25 (Critical support - 33% drawdown potential)
-
SL5. $1.14 (Major support - June 2026 low)
Resistance Levels (TP Zones):
-
TP1. $2.20 (First resistance - 17% upside)
-
TP2. $2.50 (Previous high area)
-
TP3. $3.00 (Psychological resistance)
-
TP4. $3.55 (Major resistance - 89% upside potential)
-
TP5. $4.25 (Long-term target - 126% upside by April 2027)
RSI Analysis
Current RSI at 42.44 indicates neutral momentum - neither overbought nor oversold. This suggests:
- Room for upward movement before hitting overbought territory (70+)
- No immediate reversal signal from RSI divergence
- Wait for RSI to move above 50 for bullish confirmation
Trading Strategy with 20x Leverage
For Long Positions
-
Entry. Current level $1.82-$1.88 or on dips to $1.60-$1.45
-
Stop Loss. Below $1.25 (SL4) to avoid major breakdown
-
Target. TP2 ($2.50) to TP3 ($3.00) for short-term
-
Risk Management. With 20x leverage, a 5% move = 100% gain/loss
For Short Positions
-
Entry. If price fails at $2.20 resistance
-
Stop Lose. Above $2.50 (TP2)
-
Target. Down to $1.45-$1.34 support zones
Price Forecast & Trader Sentiment
Short-term (Next 30 days)
- Bearish outlook with potential dip to $1.25-$1.34 range
- High volatility expected (89%)
- 57% of recent days were green (slight bullish bias in price action)
Medium-term (3-6 months)
- Recovery expected starting March 2027
- Price target: $2.31-$3.55 range
- Potential ROI: 89-126%
Long-term (2027-2030)
- 2027 average: $2.70
- 2030 target: $5.13-$5.48
- 2050 projection: $13.65
Risk Warning for 20x Leverage
With 20x leverage, your liquidation risk is extremely high:
- A 5% adverse move can wipe out your position
- Current volatility of 89% means large swings are common
- Only risk capital you can afford to lose completely
Recommended Action Plan
1. Wait for better entry. around $1.45-$1.60 support
2. Set multiple take profits. at TP1, TP2, TP3 levels
3. Use tight stop losses. due to high leverage
4. Monitor RSI. for momentum shifts above 50 or below 30
5. Watch for volume confirmation. on any breakout above $2.20
#MyGateTradingMoment @Gate_Square
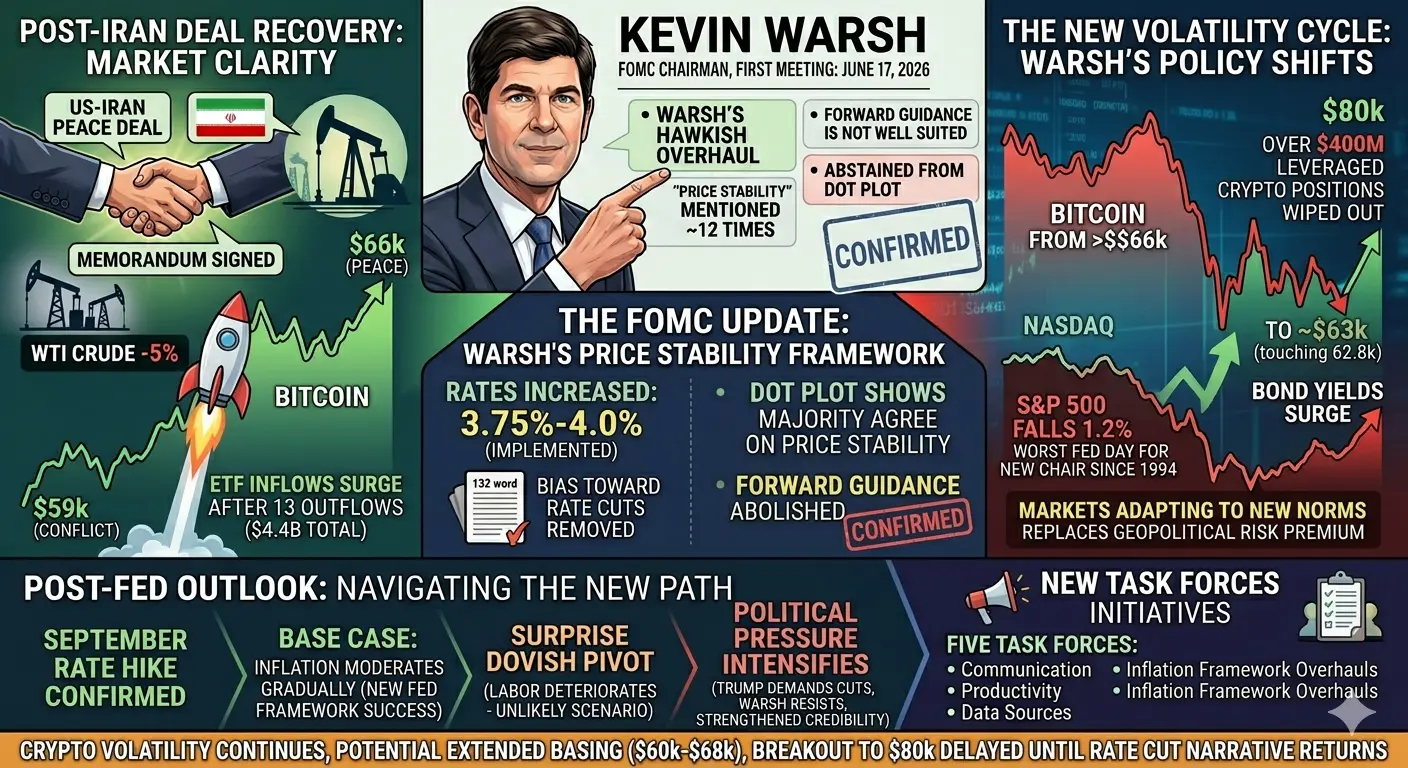
repost-content-media
  • Reward
  • Comment
  • Repost
  • Share
#MyGateTradeStory
--
Re Token Complete Trading Analysis & Strategy
Current Price: 0.79 | Market Cap: 76.1M | 24h Volume: 4.6M
RE (Re Protocol) is the capital layer connecting global on-chain capital to the 1 trillion reinsurance market. The token has shown significant volatility with strong fundamentals backing its utility. At current levels around 0.79, RE presents both opportunities and risks that traders must carefully evaluate before entering positions.
---
Key Support and Resistance Levels
Primary Resistance Levels:
- R1: 0.85 - Immediate resistance where selling pressure typically emerg
HighAmbition
#MyGateTradeStory
--
Re Token Complete Trading Analysis & Strategy
Current Price: 0.79 | Market Cap: 76.1M | 24h Volume: 4.6M
RE (Re Protocol) is the capital layer connecting global on-chain capital to the 1 trillion reinsurance market. The token has shown significant volatility with strong fundamentals backing its utility. At current levels around 0.79, RE presents both opportunities and risks that traders must carefully evaluate before entering positions.
---
Key Support and Resistance Levels
Primary Resistance Levels:
- R1: 0.85 - Immediate resistance where selling pressure typically emerges
- R2: 0.92 - Strong psychological resistance, breakout above this opens path to 1.00
- R3: 1.00 - Major psychological barrier and round number resistance
- R4: 1.15 - Extended target if bullish momentum sustains
Primary Support Levels:
- S1: 0.72 - First line of defense, minor support
- S2: 0.65 - Strong support zone where buying interest typically increases
- S3: 0.58 - Critical support, breakdown below signals deeper correction
- S4: 0.50 - Major psychological support and potential accumulation zone
Key Observation: The 0.70-0.75 range acts as a consolidation zone where price action tends to stabilize before making its next directional move.
---
RSI Analysis (Relative Strength Index)
Current RSI Interpretation:
The RSI is a momentum oscillator ranging from 0 to 100 that measures the speed and magnitude of price movements. For RE token:
- RSI Above 70: Asset is overbought, potential pullback likely
- RSI Below 30: Asset is oversold, potential bounce expected
- RSI 40-60: Neutral zone, wait for breakout confirmation
Trading Strategy Based on RSI:
- When RSI crosses above 70 and starts declining, consider taking profits or entering short positions
- When RSI drops below 30 and shows bullish divergence, look for buying opportunities
- In strong trending markets, RSI can remain overbought (above 70) or oversold (below 30) for extended periods
Pro Tip: Combine RSI with price action at key support/resistance levels for higher probability setups. RSI divergence (price making higher highs while RSI makes lower highs) often signals trend exhaustion.
---
K Line (Candlestick) Analysis
Key Candlestick Patterns to Watch:
1. Bullish Engulfing: Occurs at support - larger green candle completely engulfs previous red candle, signals potential reversal
2. Bearish Engulfing: Occurs at resistance - larger red candle engulfs previous green candle, signals potential downturn
3. Doji: Indicates indecision, often precedes significant moves when appearing at key levels
4. Hammer: Bullish reversal pattern at support with long lower wick
5. Shooting Star: Bearish reversal pattern at resistance with long upper wick
Volume Confirmation: Always confirm candlestick patterns with volume. Higher volume on breakout candles increases pattern reliability.
---
Trading Plans & Strategies
Strategy 1: Breakout Trading
- Entry: Above 0.85 with volume confirmation
- Target 1: 0.92 (8% gain)
- Target 2: 1.00 (18% gain)
- Stop Loss: 0.78 (below breakout level)
- Risk-Reward: 1:2.5
Strategy 2: Support Bounce
- Entry: At 0.65-0.72 support zone with bullish candlestick confirmation
- Target 1: 0.79 (current resistance)
- Target 2: 0.85 (next resistance)
- Stop Loss: 0.62 (below major support)
- Risk-Reward: 1:2
Strategy 3: Range Trading
- Buy Zone: 0.68-0.72
- Sell Zone: 0.82-0.85
- Stop Loss: Outside the range on either side
- Best For: Sideways market conditions
Strategy 4: Dollar Cost Averaging (DCA)
- Entry Method: Split capital into 3-4 tranches
- Entry 1: Current levels (0.79)
- Entry 2: 0.70 (if price drops)
- Entry 3: 0.60 (deeper correction)
- Entry 4: 0.50 (aggressive accumulation)
- Exit Strategy: Scale out at 0.95, 1.10, 1.25
---
Price Forecast & Upside Potential
Bullish Scenario (40% probability):
- If RE breaks above 0.85 with strong volume
- Next target: 0.95-1.00 (20-27% upside)
- Extended target: 1.15-1.25 (45-58% upside)
Neutral Scenario (35% probability):
- Price consolidates between 0.70-0.85
- Range-bound trading for next 2-4 weeks
- Wait for clear directional breakout
Bearish Scenario (25% probability):
- Break below 0.70 support
- Potential decline to 0.60-0.65 (15-25% downside)
- Major support at 0.50 if selling accelerates
Maximum Upside Potential: Based on technical analysis, RE could reach 1.15-1.25 in a strong bullish scenario, representing approximately 45-58% upside from current levels.
---
Risk Management Tips
1. Position Sizing: Never risk more than 2-5% of your total portfolio on a single trade
2. Stop Losses: Always set stop losses and stick to them
3. Take Profits: Scale out of positions rather than exiting all at once
4. Market Correlation: Monitor BTC and ETH as altcoins often follow their direction
5. News Events: Watch for protocol updates, partnerships, or exchange listings
6. Liquidity: RE has moderate volume (4.6M daily), avoid large market orders
---
Trader Psychology & Market Sentiment
What Smart Traders Are Thinking:
- Institutional Interest: RE connects on-chain capital to the 1 trillion reinsurance market, giving it real-world utility
- Volatility Awareness: Small-cap tokens like RE can swing 20-30% in a day - size positions accordingly
- Patience: Waiting for confirmation at key levels rather than anticipating moves
- Risk Control: Protecting capital is more important than maximizing gains
Common Mistakes to Avoid:
- FOMO buying at resistance
- Averaging down on losing positions without a plan
- Ignoring stop losses during emotional trading
- Over-leveraging on volatile altcoins
---
Final Recommendations
For Conservative Traders:
- Wait for a clear breakout above 0.85 or pullback to 0.70 support
- Use smaller position sizes given volatility
- Focus on risk-reward ratios of at least 1:2
For Aggressive Traders:
- Current levels offer opportunity with tight stops at 0.72
- Consider scaling in with partial positions
- Target 0.95-1.00 for first major profit-taking
For Long-Term Holders:
- RE has strong fundamentals in the insurance sector
- Accumulate on dips to 0.65, 0.55, and 0.50
- Hold through volatility for 3-6 month targets of 1.25+
#MyGateTradingMoment @Gate_Square
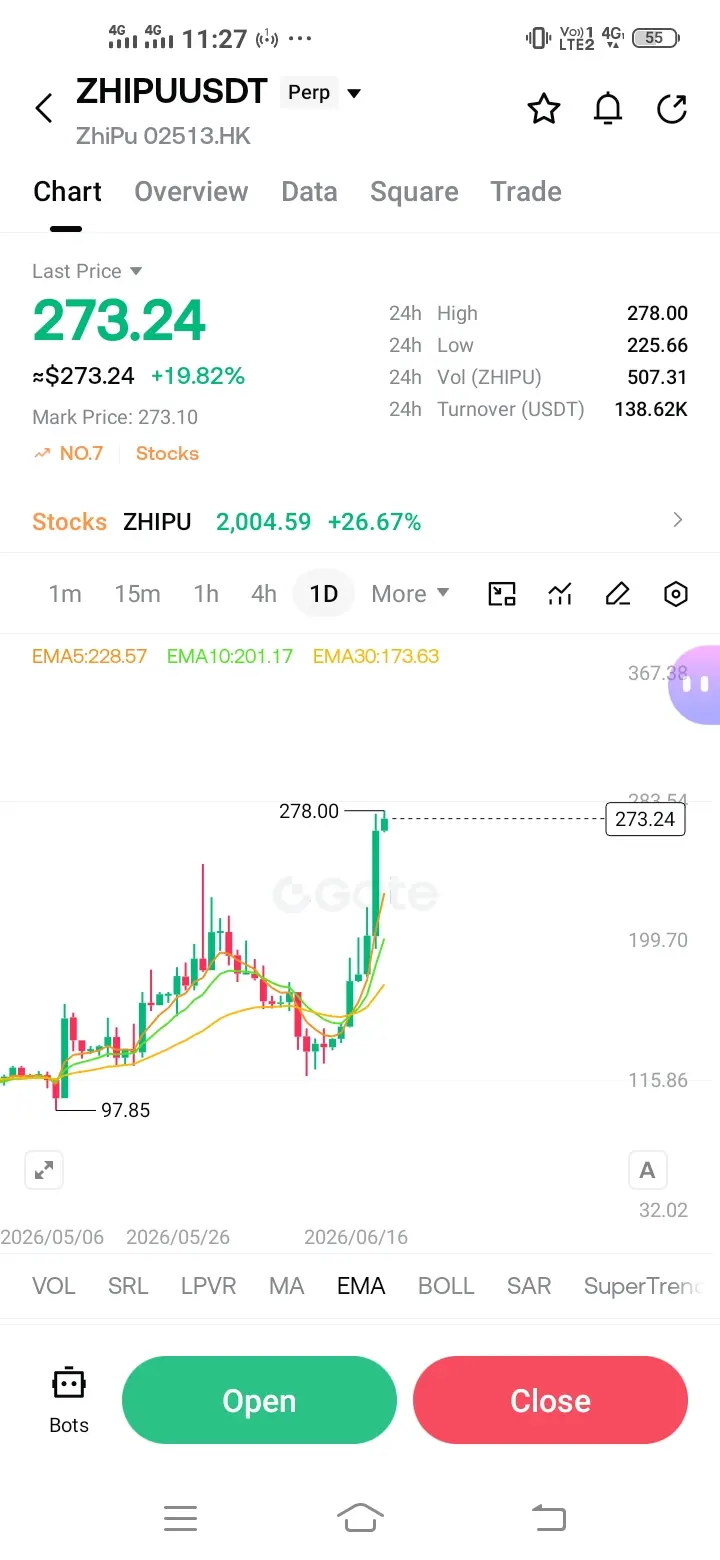
repost-content-media
  • Reward
  • Comment
  • Repost
  • Share
#MyGateTradingMoment
#MyGateTradeStory
When I first joined Gate as a content creator, I had no idea how much this journey would change my life
Like many people in crypto, I started with a simple goal. I wanted to learn more about the market, improve my analysis skills, and share my thoughts with other traders. At that time, I did not think about rankings, rewards, or recognition. I simply focused on creating valuable content every day
Then one day, Gate launched a content creator event
I was excited because it gave creators a chance to showcase their skills and compete with some of the most
HighAmbition
#MyGateTradingMoment
#MyGateTradeStory
When I first joined Gate as a content creator, I had no idea how much this journey would change my life
Like many people in crypto, I started with a simple goal. I wanted to learn more about the market, improve my analysis skills, and share my thoughts with other traders. At that time, I did not think about rankings, rewards, or recognition. I simply focused on creating valuable content every day
Then one day, Gate launched a content creator event
I was excited because it gave creators a chance to showcase their skills and compete with some of the most talented people in the community. I immediately decided to participate
The beginning was not easy
For the first few months, I worked extremely hard. Every day I spent hours researching market trends, reading news, studying charts, and creating original content. I wanted every post to provide value to readers
When the rankings were announced, I usually found myself around third, fourth, or fifth place
To be honest, seeing other creators above me was sometimes disappointing. I knew how much effort I was putting in, and naturally I wanted to see better results. There were moments when I wondered whether all the hard work would ever pay off
But I never gave up
Instead of focusing on the rankings, I focused on improvement
I started analyzing the market more deeply. I improved my writing style. I spent more time understanding what readers wanted. I learned how to make my content more informative, more detailed, and more useful for the community
Every day became another opportunity to improve
While others were watching the rankings, I was focused on becoming a better creator
Month after month, I continued working with patience and determination
Many people think success happens overnight, but my experience taught me something different
Success is usually built through hundreds of small efforts that nobody sees
The hours spent researching
The time spent checking facts
The effort required to create quality posts consistently
The discipline to continue even when results are not immediate
Then came the day that I will never forget
The event results were about to be announced
Like every other participant, I was waiting to see the final rankings
I opened the announcement and started looking through the list
At first, I could not believe what I was seeing
For a moment, I thought I had read it incorrectly
Then I looked again
And there it was
HighAmbition
Number One
I had finally reached the top position
After months of hard work, consistency, patience, and determination, I was standing in first place
The feeling was incredible
All the effort, all the late nights, all the research, and all the persistence had finally produced a result
That day I also won a 150 dollar reward from the event
Of course, the reward itself was wonderful, but what meant even more to me was the recognition
It was proof that hard work matters
It was proof that consistency matters
It was proof that if you continue improving and refuse to quit, eventually your efforts can be rewarded
That moment remains one of the happiest memories of my entire content creation journey.
What impressed me most was how Gate genuinely supports its community creators.
Many platforms talk about rewarding creators, but Gate actually creates opportunities where dedicated people can grow, compete, learn, and earn
The platform gave me motivation to continue developing my skills and sharing valuable market insights with others
Since then, I have continued my journey with even greater confidence
Every article, every market analysis, every prediction, and every educational post has become another step forward
Looking back today, I realize that the most important lesson was not the prize money or the ranking
The most important lesson was learning the value of persistence
If I had stopped after finishing third, fourth, or fifth, I would never have experienced the joy of reaching first place
If I had allowed temporary disappointment to control my decisions, I would have missed one of the best moments of my journey
That is why my message to every creator is simple:
Never underestimate the power of consistency.
Keep learning
Keep improving
Keep creating
Do not focus only on immediate results
Focus on becoming better every single day
Eventually, your hard work will speak for itself
My journey from repeatedly finishing outside the top position to finally becoming the Number One creator and winning the event is proof that patience and dedication can make a difference
Thank you, Gate, for creating opportunities for creators like me
And thank you to everyone who reads, supports, and engages with my content
This is only the beginning of my journey, and I am excited for everything that lies ahead
@Gate_Square
repost-content-media
  • Reward
  • Comment
  • Repost
  • Share
#MyGateTradeStory
#DOGE
Dogecoin is currently trading at approximately 0.08237 USD to 0.08661 USD range as of mid-June 2026. The cryptocurrency has shown resilience despite broader market volatility, with traders closely monitoring key technical levels for potential breakout or breakdown scenarios. The current price action indicates that DOGE is consolidating within a defined range, presenting both opportunities and risks for active traders.
CURRENT MARKET STATUS
The present price of Dogecoin hovers around 0.08462 USD with immediate fluctuations between 0.08200 USD and 0.08800 USD. Recent ma
Original content no longer visible
  • Reward
  • Comment
  • Repost
  • Share
#MyGateTradeStory
$ASTER LONG SETUP | 20x Leverage
$ASTER is showing impressive strength after a major tokenomics upgrade, holding firmly above its multi-month ascending trendline while building a clear base near current levels. The recent 198% buyback and burn activation has shifted sentiment strongly bullish, and as long as key support holds, the path of least resistance remains toward the upside.
Trade Plan
Entry Zone: 0.640 - 0.660
TP1: 0.720
TP2: 0.800
TP3: 0.820
Stop Loss: 0.628
Key Support Levels
Immediate Support: 0.644 (pivot demand zone)
Strong Support: 0.628 (structural floor and a
ASTER-1.07%
HighAmbition
#MyGateTradeStory
$ASTER LONG SETUP | 20x Leverage
$ASTER is showing impressive strength after a major tokenomics upgrade, holding firmly above its multi-month ascending trendline while building a clear base near current levels. The recent 198% buyback and burn activation has shifted sentiment strongly bullish, and as long as key support holds, the path of least resistance remains toward the upside.
Trade Plan
Entry Zone: 0.640 - 0.660
TP1: 0.720
TP2: 0.800
TP3: 0.820
Stop Loss: 0.628
Key Support Levels
Immediate Support: 0.644 (pivot demand zone)
Strong Support: 0.628 (structural floor and ascending trendline touch)
Critical Support: 0.600 (breakdown invalidation level)
Key Resistance Levels
First Resistance: 0.720 (short-term supply zone)
Second Resistance: 0.790 - 0.800 (the key breakout gate — clean close above this with volume opens the next leg)
Major Resistance: 0.820 and beyond toward 1.40 (historical liquidity zone and next major expansion target)
Why I am bullish on $ASTER
Multi-month ascending trendline support has been respected repeatedly, confirming a strong structural base for bulls. The new tokenomics model routes 99% of daily platform fees into automatic on-chain ASTER buybacks via TWAP algorithm, with matching burns from reserves targeting supply reduction from 8 billion to 3 billion tokens. This creates a structural supply squeeze that directly links platform usage to token demand. Buyers continue absorbing selling pressure near the 0.644 pivot zone, and consolidation below the 0.79 resistance is widely viewed as accumulation ahead of expansion. Momentum indicators are shifting after the tokenomics catalyst, and a sustained close above 0.79 - 0.80 with volume could open the path toward 1.40 or higher, representing over 115% upside from current levels.
Forecast and Upside Potential
In the short term, a confirmed breakout above 0.80 could rapidly push ASTER toward 1.00, as the supply reduction mechanism accelerates with increasing trading volume. Medium-term targets extend toward 1.40, the first major post-launch resistance, and potentially 2.42, the historical liquidity zone, if macro conditions and broader crypto sentiment improve. The combination of deflationary tokenomics, veASTER staking rewards from buybacks, and Layer-1 blockchain utility creates a compelling case for sustained upward pressure over coming weeks and months
Risk management remains critical. 20x leverage amplifies both gains and exposure to volatility. Overbought conditions on lower timeframes and fading momentum after the initial spike could trigger a pullback before the breakout. A clean hold above the 0.628 support region is essential for the bullish thesis to remain valid. If that support breaks, reassess immediately and exit without hesitation.
Not financial advice. Always manage risk and stick to your stop loss.
#MyGateTradeStory
#MyGateTradingMoment
@Gate_Square

repost-content-media
  • Reward
  • Comment
  • Repost
  • Share
#MyGateTradeStory
---
My Circle Internet Group Trade Analysis at 83.54
I have been watching Circle Internet Group closely and the current price level of 83.54 presents a challenging setup that requires careful analysis. This crypto stablecoin company has been under pressure and the technical picture reveals why traders need to exercise caution here.
Starting with support levels, the critical support zone sits at 77.84 which is formed by multiple trend lines across different time frames. This is the key level where bulls must defend to prevent further downside. Below that, the next support are
HighAmbition
#MyGateTradeStory
---
My Circle Internet Group Trade Analysis at 83.54
I have been watching Circle Internet Group closely and the current price level of 83.54 presents a challenging setup that requires careful analysis. This crypto stablecoin company has been under pressure and the technical picture reveals why traders need to exercise caution here.
Starting with support levels, the critical support zone sits at 77.84 which is formed by multiple trend lines across different time frames. This is the key level where bulls must defend to prevent further downside. Below that, the next support area would be around 77.06 which represents the lower end of the recent trading range. A break below 77.84 would be concerning and could trigger a move toward 70.00 or lower. The 52 week low is not far below current levels, making this a critical juncture for the stock.
On the resistance side, there are multiple hurdles to overcome. The immediate resistance sits at 83.38 which is formed by trend line confluence. Above that, the next major resistance comes in at 115.33 from a weekly trend line. Further up, resistance at 128.68 from a daily trend line and 132.84 from a horizontal line would cap any significant rally. The stock has been trading in a wide range of 77.61 to 118.85 over the past month and is currently near the lower end of this range.
The RSI reading at 39.72 is particularly noteworthy. This is in neutral territory but leaning toward oversold conditions below 30. The fact that RSI is below 50 confirms the bearish momentum. The weekly RSI at 44.27 is also in neutral territory, showing no clear directional bias on the longer time frame. The Stochastic reading at 9.29 is in oversold territory, which could suggest a potential bounce, but oversold can remain oversold for extended periods in strong downtrends.
Looking at moving averages, the picture is bearish across the board. The 20 day SMA sits at 97.16, the 50 day SMA at 102.1, and the 200 day SMA at 100.06. Price is trading below all these key moving averages, confirming a downtrend across short, medium, and long term time frames. The 20 day SMA at 97.16 would be the first major hurdle on any recovery attempt.
The MACD reading at negative 2.17 is below zero but rising, which shows some improvement in momentum. However, the weekly MACD at negative 1.82 is below zero and declining, indicating the longer term trend remains firmly bearish. The daily indicator consensus shows a strong sell signal with 5 sell signals against only 1 buy signal.
The ADX at 24.79 indicates a developing trend that is not yet strongly established. The ATR percentage at 8.83 percent shows elevated volatility, which is typical for a stock under distribution pressure. The technical rating of 0 out of 10 reflects the poor technical condition, and the setup rating of 3 out of 10 suggests there is no quality entry point at current levels.
My personal view is that Circle Internet Group is in a difficult technical position. The short term trend is down, the long term trend is down, and the stock is underperforming 96 percent of all stocks in the market. The company is also lagging behind 83 percent of stocks in the software industry. While the Stochastic oversold reading at 9.29 could suggest a bounce, the overall trend structure remains bearish.
For traders looking to enter long positions, waiting for a break above 97.16 with confirmation would be more prudent than trying to catch a falling knife. For those already in positions, a stop below 77.84 would be prudent risk management. The crypto stablecoin space remains volatile and regulatory concerns continue to weigh on sentiment.
This is my analysis based on current technical readings. Trade responsibly and manage your risk accordingly.@Gate_Square
repost-content-media
  • Reward
  • Comment
  • Repost
  • Share
#MyGateTradeStory
BTC is currently trading at 66430, positioned at a critical technical zone. From a technical perspective, BTC experienced a pullback in early June, with prices touching lows near 60000 before bouncing back. The current price action around 66430 is testing important resistance levels.
On the daily timeframe, BTC has formed a bearish pennant consolidation pattern. The key support level sits at the 60000 to 61000 range, which serves as a psychological floor that bulls must defend. If this support fails to hold, the next downside target would be the 57800 to 58000 area. Near-ter
BTC0.42%
HighAmbition
#MyGateTradeStory
BTC is currently trading at 66430, positioned at a critical technical zone. From a technical perspective, BTC experienced a pullback in early June, with prices touching lows near 60000 before bouncing back. The current price action around 66430 is testing important resistance levels.
On the daily timeframe, BTC has formed a bearish pennant consolidation pattern. The key support level sits at the 60000 to 61000 range, which serves as a psychological floor that bulls must defend. If this support fails to hold, the next downside target would be the 57800 to 58000 area. Near-term support is found around 63500 to 64000, which has been tested multiple times recently as a local bottom.
Regarding resistance levels, 66500 represents immediate overhead resistance that the current price is testing. A sustained break above 66500 would open the door for a move toward 68000 to 72700. Stronger resistance is located at 73500 to 78600, corresponding to May's highs. The critical macro resistance stands at 83000, and only a breakout above this level would signal the end of the current correction phase.
The RSI indicator on the daily chart currently sits in neutral territory after previously dipping below 25 into oversold conditions, suggesting some rebound momentum. However, both OBV and TBO indicators remain bearish, indicating the trend structure has not yet shown clear reversal signals.
For trading strategies, long-biased traders should consider entry zones around 60000 to 61000, with stop losses placed below 57000 to 58000. Target levels would be 65000, followed by 68000 and 70000 to 72000. Breakout traders might consider entering long positions after confirmation above 66500, targeting 68000 to 72000, with stops below 65000. Short-biased traders could consider light short positions in the 66500 to 67000 zone, with stops above 67300 and targets at 65000 and 63500 to 64200.
Looking ahead to the coming week, BTC will likely consolidate within the 60000 to 66500 range. If the 60000 support holds and price gradually breaks through 66500 resistance, we could see a rebound toward 70000 and above. However, a breakdown below 60000 could trigger a rapid decline toward the capitulation zone of 53000 to 58000.
Market sentiment has improved somewhat recently due to easing geopolitical tensions, driving a relief rally. However, analysts generally agree this has not changed the overall bearish technical structure. Traders should closely monitor the battle between 60000 support and 66500 resistance, as these levels will determine the short-term directional bias.
From a capital flow perspective, spot BTC ETFs have seen some outflows recently, creating pressure on price. Yet BTC has shown resilience at key support levels, indicating underlying demand remains intact. Traders should exercise caution, avoid excessive leverage, and wait for clear confirmation on the 1-hour or 4-hour timeframe before entering positions.
For newer traders, a range-bound strategy is recommended, buying dips and selling rallies within the 60000 to 66500 range with strict stop loss discipline. Experienced traders might wait for trend-following opportunities following a confirmed breakout above 66500 or breakdown below 63500.
Overall, the market is at a critical juncture between bulls and bears. The 66500 level serves as the key battleground for short-term direction. A breakout would signal bullish continuation toward 72000, while rejection could lead to a pullback testing 60000 support. Traders should remain flexible, adjusting strategies according to actual price action, maintaining strict risk management, and controlling position sizes appropriately.
@Gate_Square #BitcoinBouncesBack #USIranPeaceDealReachedStraitOfHormuzToOpen
repost-content-media
  • Reward
  • Comment
  • Repost
  • Share
#TradFiCFDGoldMasters
TradFi CFD Gold Masters: Your Gateway to Mastering Gold Trading on Gate
Point 1: Introduction to Gate Platform
Gate stands as one of the world's leading digital asset trading platforms, serving millions of users across more than 130 countries and regions. The platform operates with a vision to bridge the gap between traditional finance and the digital asset ecosystem. Since its establishment, Gate has built a strong reputation for security, innovation, and user-centric services. Through continuous technological upgrades and feature enhancements, the platform delivers a s
HighAmbition
#TradFiCFDGoldMasters
TradFi CFD Gold Masters: Your Gateway to Mastering Gold Trading on Gate
Point 1: Introduction to Gate Platform
Gate stands as one of the world's leading digital asset trading platforms, serving millions of users across more than 130 countries and regions. The platform operates with a vision to bridge the gap between traditional finance and the digital asset ecosystem. Since its establishment, Gate has built a strong reputation for security, innovation, and user-centric services. Through continuous technological upgrades and feature enhancements, the platform delivers a seamless trading experience. Key strengths of Gate include support for multiple languages, 24/7 customer support, and some of the most competitive fee structures in the industry. Whether you are a beginner taking your first steps into trading or an experienced professional managing substantial portfolios, Gate provides the necessary tools and infrastructure. The platform's TradFi feature now includes comprehensive CFD trading on traditional financial assets, making it a true multi-asset trading powerhouse.
Point 2: Understanding TradFi CFD Gold Trading
Traditional Finance, commonly known as TradFi, represents the conventional financial system that includes banks, stock exchanges, insurance companies, brokerage firms, and other financial institutions. When combined with CFD trading on gold, this opens up a powerful avenue for traders to profit from gold price movements without physically owning the precious metal. A Contract for Difference is essentially an agreement where traders speculate on the price movement of an underlying asset. In gold CFD trading, you do not need to purchase actual gold bars or coins. Instead, you simply predict whether the price of gold will rise or fall. If your prediction aligns with market movement, you earn a profit. If the market moves against your position, you incur a loss. This mechanism allows traders to benefit from both rising and falling markets through long (buy) and short (sell) positions. Gold has been humanity's most trusted store of value for thousands of years. In modern financial markets, it continues to serve as a safe-haven asset during times of economic uncertainty. When stock markets become volatile, when inflation rises, or when geopolitical tensions escalate, investors flock to gold as a protective measure for their wealth. This makes gold one of the most actively traded commodities in the world, with daily trading volumes reaching billions of dollars.
Point 3: How CFD Trading Works
The mechanism of CFD trading is simple yet powerful. When you trade gold CFDs, you do not actually own the gold. Instead, you enter into a contract with the broker that will settle the difference in gold's price. Suppose gold is priced at 3300 dollars and you believe it will reach 3400 dollars. You open a long position. If the price actually reaches 3400 dollars, you earn a profit of 100 dollars per unit. However, if the price drops to 3200 dollars, you incur a loss of 100 dollars. This can be further amplified through leverage. Gate offers leverage of up to 500x, which is quite high. This means you can control a 500 dollar position with just 1 dollar. However, remember that leverage amplifies both profits and losses. Therefore, risk management is crucial. Another advantage of CFD trading is that you can engage in short selling. If you believe gold prices will fall, you can take a short position and earn profits from the price decline. This flexibility is not available in traditional gold investment where you must first buy gold and only profit from price appreciation.
Point 4: Starting Gold CFD Trading on Gate
Starting gold CFD trading on Gate is straightforward and accessible. The process has been streamlined to ensure traders can begin their journey with minimal friction. First, open the Gate mobile application. Navigate to the bottom navigation bar and select the TradFi option, then choose CFD to access the CFD trading page. This dedicated section houses all traditional financial asset trading pairs available on the platform. Upon entering the CFD trading section, you will need to agree to the service protocol and open a CFD trading account. This step is essential for compliance and risk management purposes. Once your CFD account is activated, you can use the Transfer button at the top of the page to move funds from your main Gate account to your CFD trading account. After funding your account, you can select the specific trading pair you wish to trade. For gold trading, choose XAUUSD. The trading interface allows you to select your trading side, either Buy (Long) if you anticipate price increases or Sell (Short) if you expect prices to decline. Enter your desired trading amount and place your order to execute your trade. It is important to note that TradFi trading requires Gate App version 8.4.0 or above. Ensure your application is updated to guarantee access to all features and the smoothest trading experience.
Point 5: Gold Masters Philosophy and Expertise
Becoming a Gold Master through Gate's TradFi CFD platform is about more than just executing trades. It represents a commitment to understanding the intricate dynamics that drive gold prices and developing the skills necessary to navigate these markets effectively. Gold Masters are traders who have developed expertise in analyzing the factors that influence gold prices. These include macroeconomic indicators such as inflation rates, interest rate decisions by central banks, currency strength particularly of the US dollar, geopolitical events, and market sentiment. By mastering these elements, Gold Masters can make informed trading decisions that align with market conditions. The journey to becoming a Gold Master involves continuous learning and practice. Gate supports this journey by providing access to real-time market data, advanced charting tools, and educational resources. Traders can analyze historical price patterns, identify support and resistance levels, and apply technical indicators to enhance their trading strategies. Risk management is a cornerstone of the Gold Masters approach. Successful gold CFD traders understand that preserving capital is as important as generating profits. This involves setting appropriate stop-loss levels, managing position sizes relative to account balance, and avoiding over-leveraging that could lead to significant losses.
Point 6: Market Opportunities and Factors
The gold market presents continuous opportunities for CFD traders due to its inherent volatility and sensitivity to global events. When economic uncertainty rises, gold prices typically experience upward pressure as investors seek safe-haven assets. Conversely, when economic conditions stabilize and risk appetite returns, gold prices may face downward pressure. Interest rate decisions by major central banks, particularly the Federal Reserve, have profound impacts on gold prices. Higher interest rates tend to strengthen the US dollar and increase the opportunity cost of holding non-yielding assets like gold, potentially leading to price declines. Lower interest rates can have the opposite effect, supporting gold prices. Inflation is another critical factor. As inflation erodes the purchasing power of fiat currencies, gold's role as an inflation hedge becomes more prominent. Traders who can anticipate inflation trends and central bank responses can position themselves to benefit from resulting gold price movements. Geopolitical tensions and global conflicts also drive gold prices. During times of war, political instability, or international disputes, gold's status as a crisis commodity comes to the forefront. CFD traders can potentially profit from these movements by taking appropriate long positions when tensions escalate.
Point 7: Gate's Precious Metals Zone
In addition to CFD trading, Gate has launched a dedicated Precious Metals Zone, further expanding its offerings for gold and silver enthusiasts. This zone features XAU (gold) and XAG (silver) USDT-margined perpetual contracts, enabling 24/7 trading through crypto contract mechanisms. The Precious Metals Zone represents Gate's commitment to providing precious metal assets with efficient price discovery and risk management tools. The index prices for these perpetual contracts reference multiple comprehensive precious metals trading markets, enhancing pricing transparency and stability. This offering complements the TradFi CFD platform by providing additional ways for traders to gain exposure to gold price movements. While CFDs operate within traditional market hours and structures, perpetual contracts offer continuous trading opportunities that align with the always-on nature of cryptocurrency markets. This flexibility allows traders to trade according to their schedules without the restrictions of traditional market hours. The launch of the Precious Metals Zone is part of Gate's long-term strategy to connect traditional finance with crypto markets.
Point 8: Future Prospects and Conclusion
Gate's expansion into traditional finance through CFD trading represents a significant milestone in the platform's evolution. As the boundaries between cryptocurrency markets and traditional financial markets continue to blur, the demand for multi-asset and cross-market trading is expected to grow substantially. Gate is positioned at the forefront of this convergence, offering traders a unified platform where they can access both digital assets and traditional financial instruments. This integrated approach simplifies portfolio management, reduces operational complexity, and provides traders with comprehensive market exposure. The platform's roadmap includes continued expansion of TradFi offerings, with new asset classes and enhanced features planned for future releases. Traders who establish themselves as Gold Masters today will be well-positioned to take advantage of these developments as they unfold. TradFi CFD Gold Masters represents the intersection of traditional financial expertise and modern trading technology. Through Gate's comprehensive platform, traders can access global gold markets, apply sophisticated trading strategies, and develop the skills necessary to navigate these dynamic markets successfully. Whether you are drawn to gold trading for its safe-haven properties, its potential for profit during volatile periods, or simply as a diversification tool for your investment portfolio, Gate provides the infrastructure and support needed to pursue your trading goals. The journey to becoming a Gold Master begins with a single trade, and Gate invites you to take that first step today. By combining the timeless value of gold with the innovative capabilities of CFD trading, Gate has created a powerful platform for traders seeking to master the art of gold trading. The opportunities are vast, the tools are accessible, and the potential for growth is limited only by your commitment to learning and developing your trading skills.@Gate_Square
repost-content-media
  • Reward
  • Comment
  • Repost
  • Share
  • Pinned