Bitcoin traded at $70,795 on March 14, 2026, with a market capitalization of $1.41 trillion and 24-hour trading volume of $49.48 billion. The cryptocurrency moved within an intraday range between $70,416 and $73,838 while technical indicators across major timeframes reflected a neutral market structure.
Bitcoin Chart Outlook
On the daily chart, bitcoin continues to trade inside a consolidation range following a rejection near the $74,000 resistance zone. Current price levels around $70,467 on Bitstamp place the asset in the middle of a broader visible trading band between approximately $63,000 and $77,500.
Market structure reflects sideways movement with declining volatility after the rejection near recent highs. Key resistance remains between $73,800 and $74,000, while mid-range resistance sits near $71,200. Support is identified around $69,500, with stronger structural support near $66,000. As long as the price remains above the $69,500 level, the broader bias remains neutral to slightly upward within the existing range.
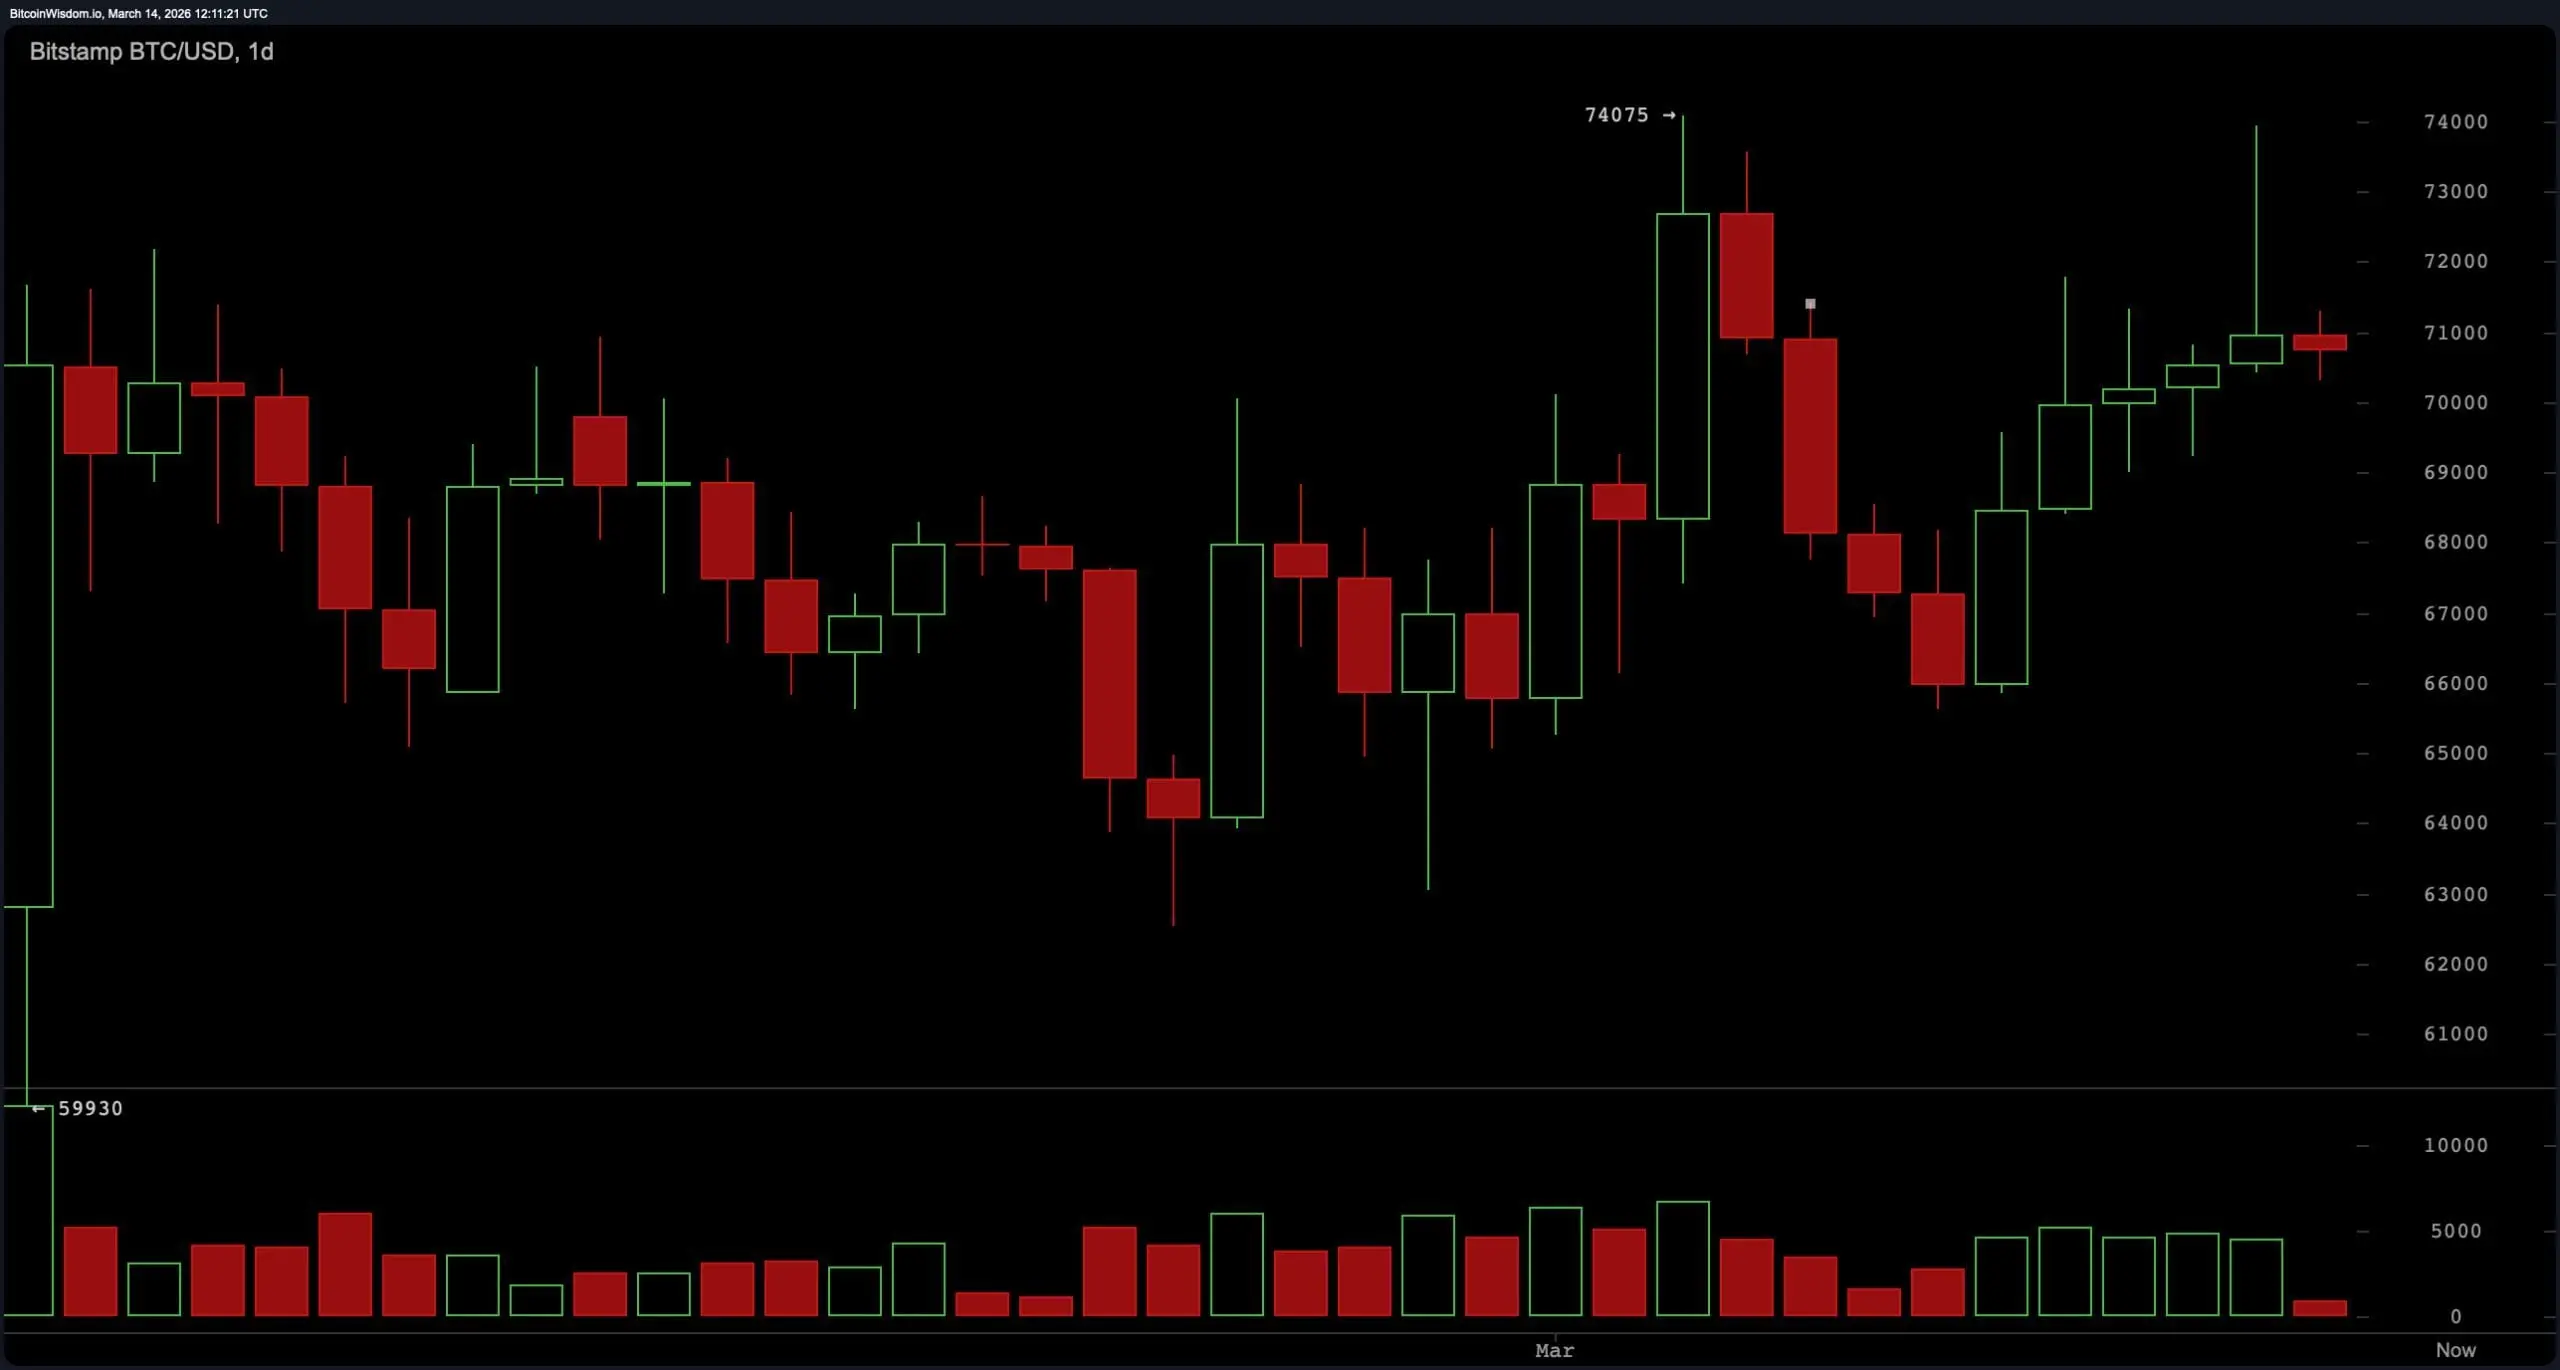 BTC/USD 1-day chart via Bitstamp on March 14, 2026.
The four-hour bitcoin chart shows continued sideways consolidation supported by a sequence of higher lows. Previous swing levels progressed from approximately $65,600 to $69,000 and then to near $70,000, suggesting gradual upward pressure beneath resistance. Price has repeatedly encountered resistance between $71,500 and $72,000, creating a compression pattern as volatility narrows. This type of price structure often precedes expansion once resistance or support is decisively breached. The current compression below resistance indicates that a move beyond this zone could determine the next directional move of roughly $3,000 to $5,000.
BTC/USD 1-day chart via Bitstamp on March 14, 2026.
The four-hour bitcoin chart shows continued sideways consolidation supported by a sequence of higher lows. Previous swing levels progressed from approximately $65,600 to $69,000 and then to near $70,000, suggesting gradual upward pressure beneath resistance. Price has repeatedly encountered resistance between $71,500 and $72,000, creating a compression pattern as volatility narrows. This type of price structure often precedes expansion once resistance or support is decisively breached. The current compression below resistance indicates that a move beyond this zone could determine the next directional move of roughly $3,000 to $5,000.
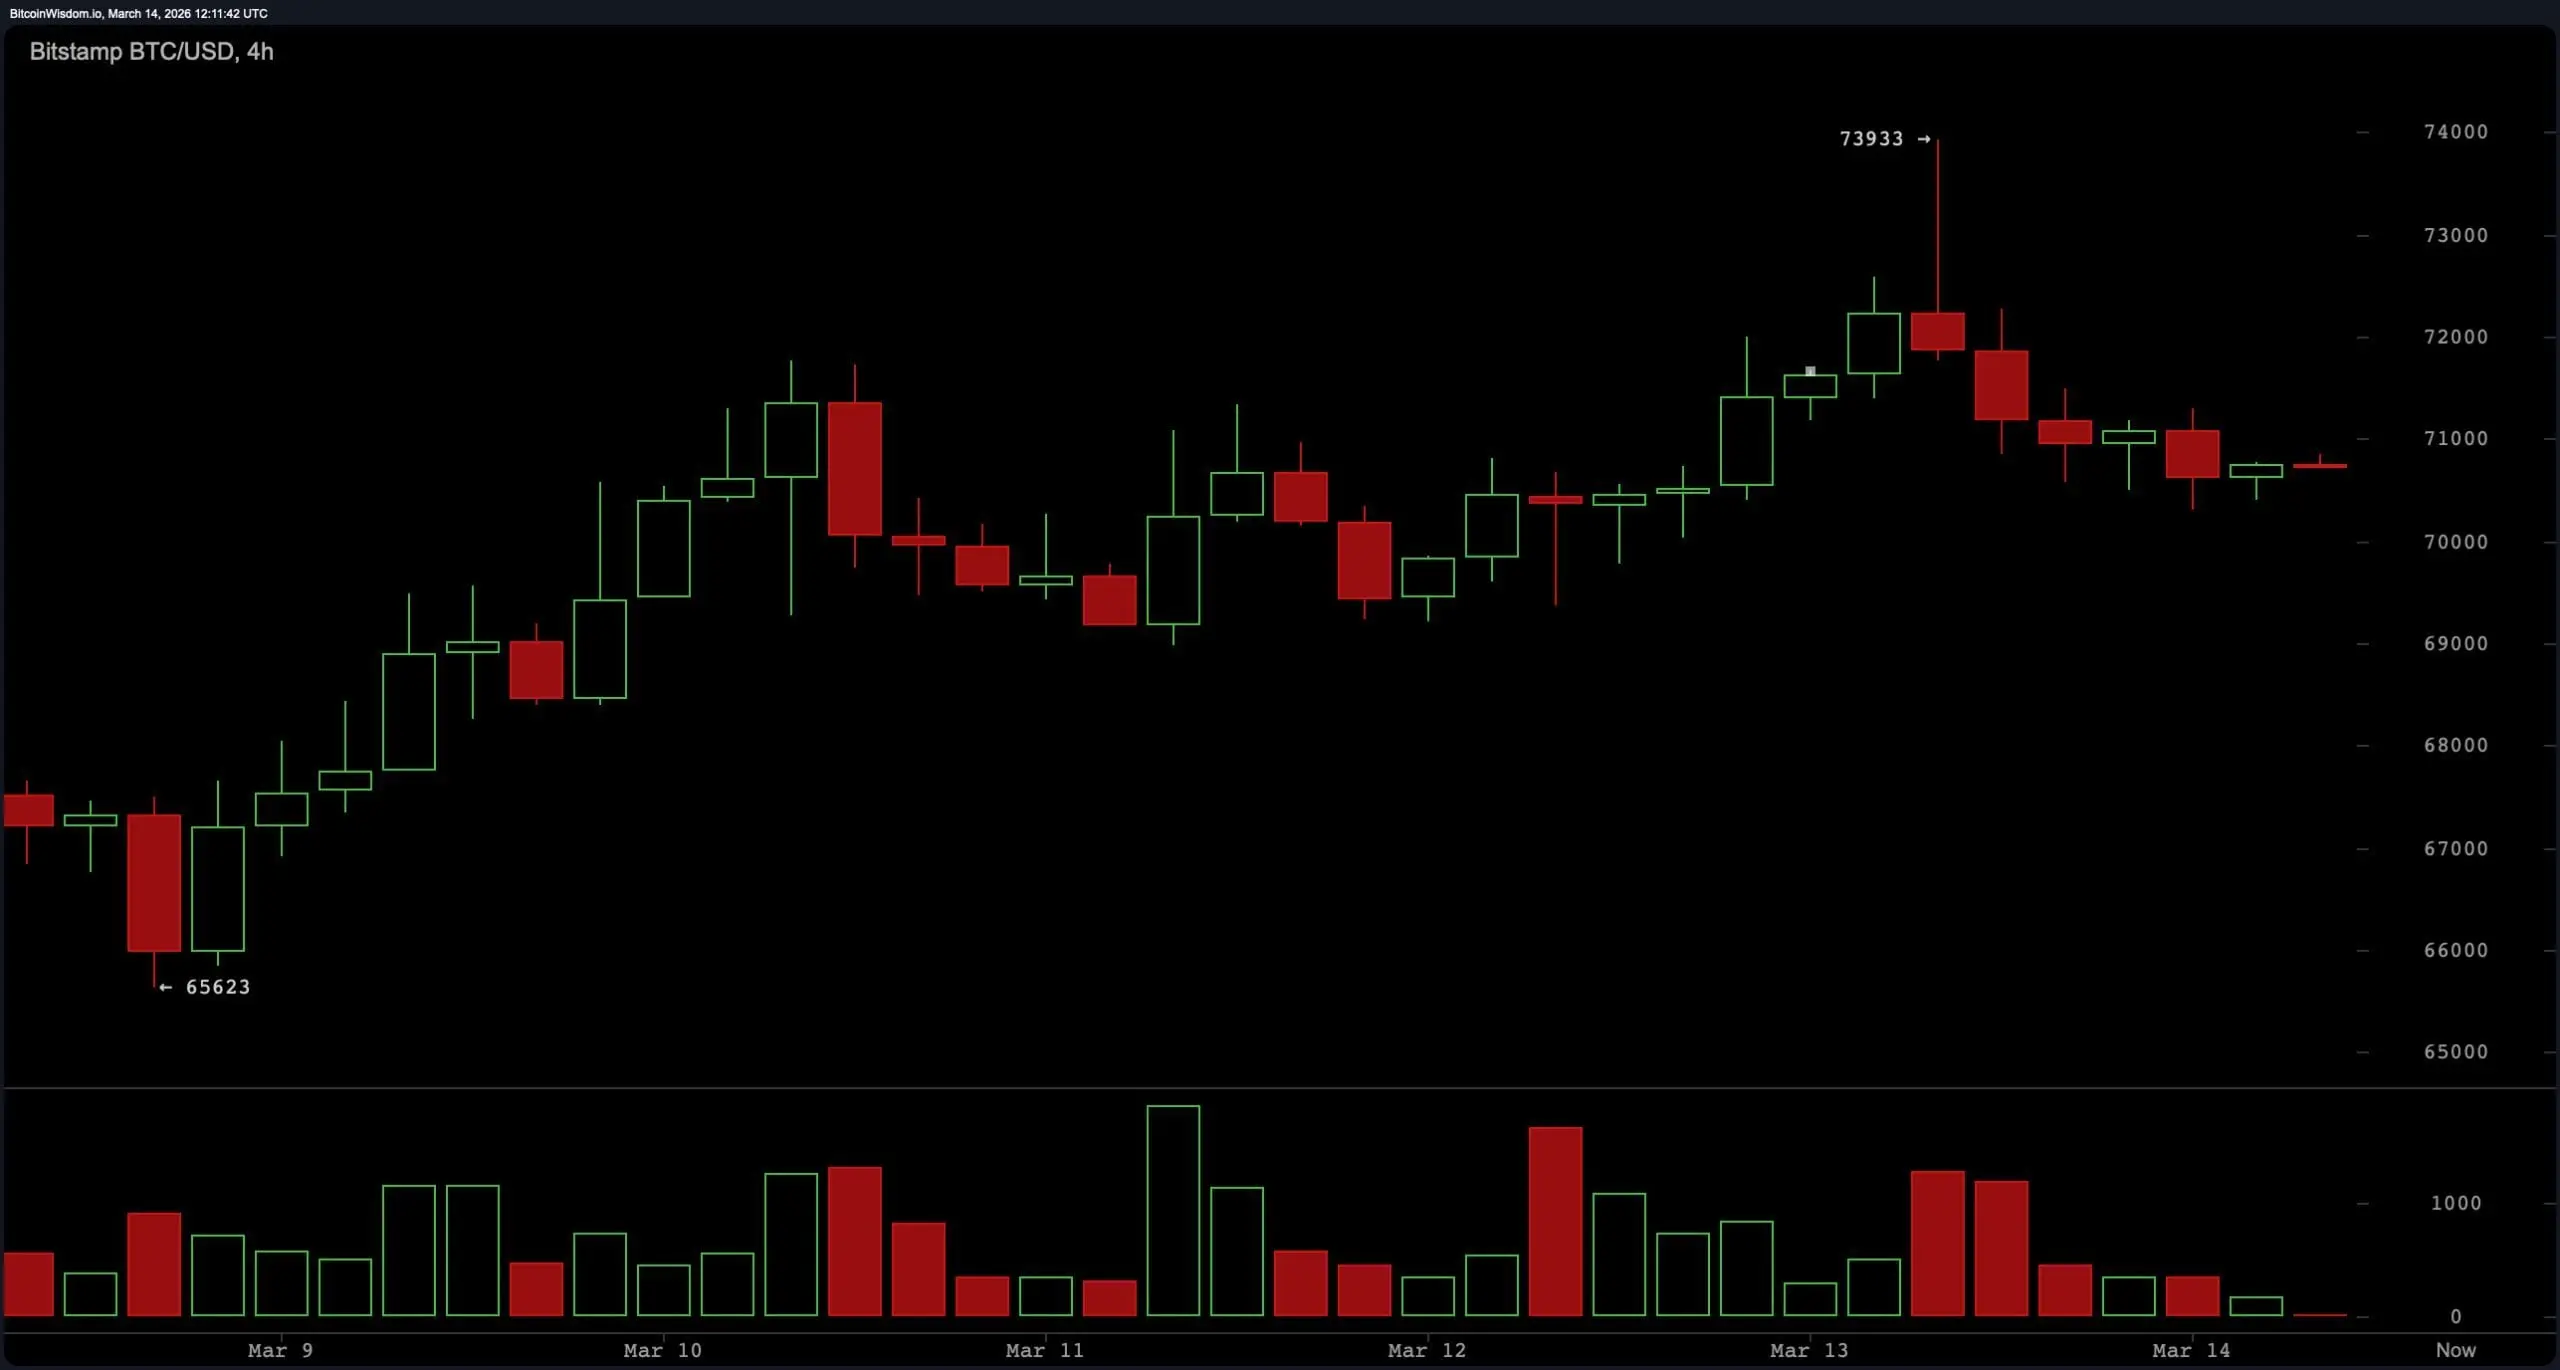 BTC/USD 4-hour chart via Bitstamp on March 14, 2026.
On the one-hour chart, bitcoin is trading within a tight intraday range between $70,300 support and approximately $71,100 resistance. Price movement has remained contained inside this narrow band while trading volume gradually declines, reflecting short-term equilibrium between buyers and sellers. Intraday consolidation within this range suggests the market is awaiting a catalyst for a breakout. Sustained movement above the $71,200 level would place the price near the upper resistance band around $72,800 and $74,000, while a breakdown below $69,500 would expose lower support areas near $67,800 and $66,000.
BTC/USD 4-hour chart via Bitstamp on March 14, 2026.
On the one-hour chart, bitcoin is trading within a tight intraday range between $70,300 support and approximately $71,100 resistance. Price movement has remained contained inside this narrow band while trading volume gradually declines, reflecting short-term equilibrium between buyers and sellers. Intraday consolidation within this range suggests the market is awaiting a catalyst for a breakout. Sustained movement above the $71,200 level would place the price near the upper resistance band around $72,800 and $74,000, while a breakdown below $69,500 would expose lower support areas near $67,800 and $66,000.
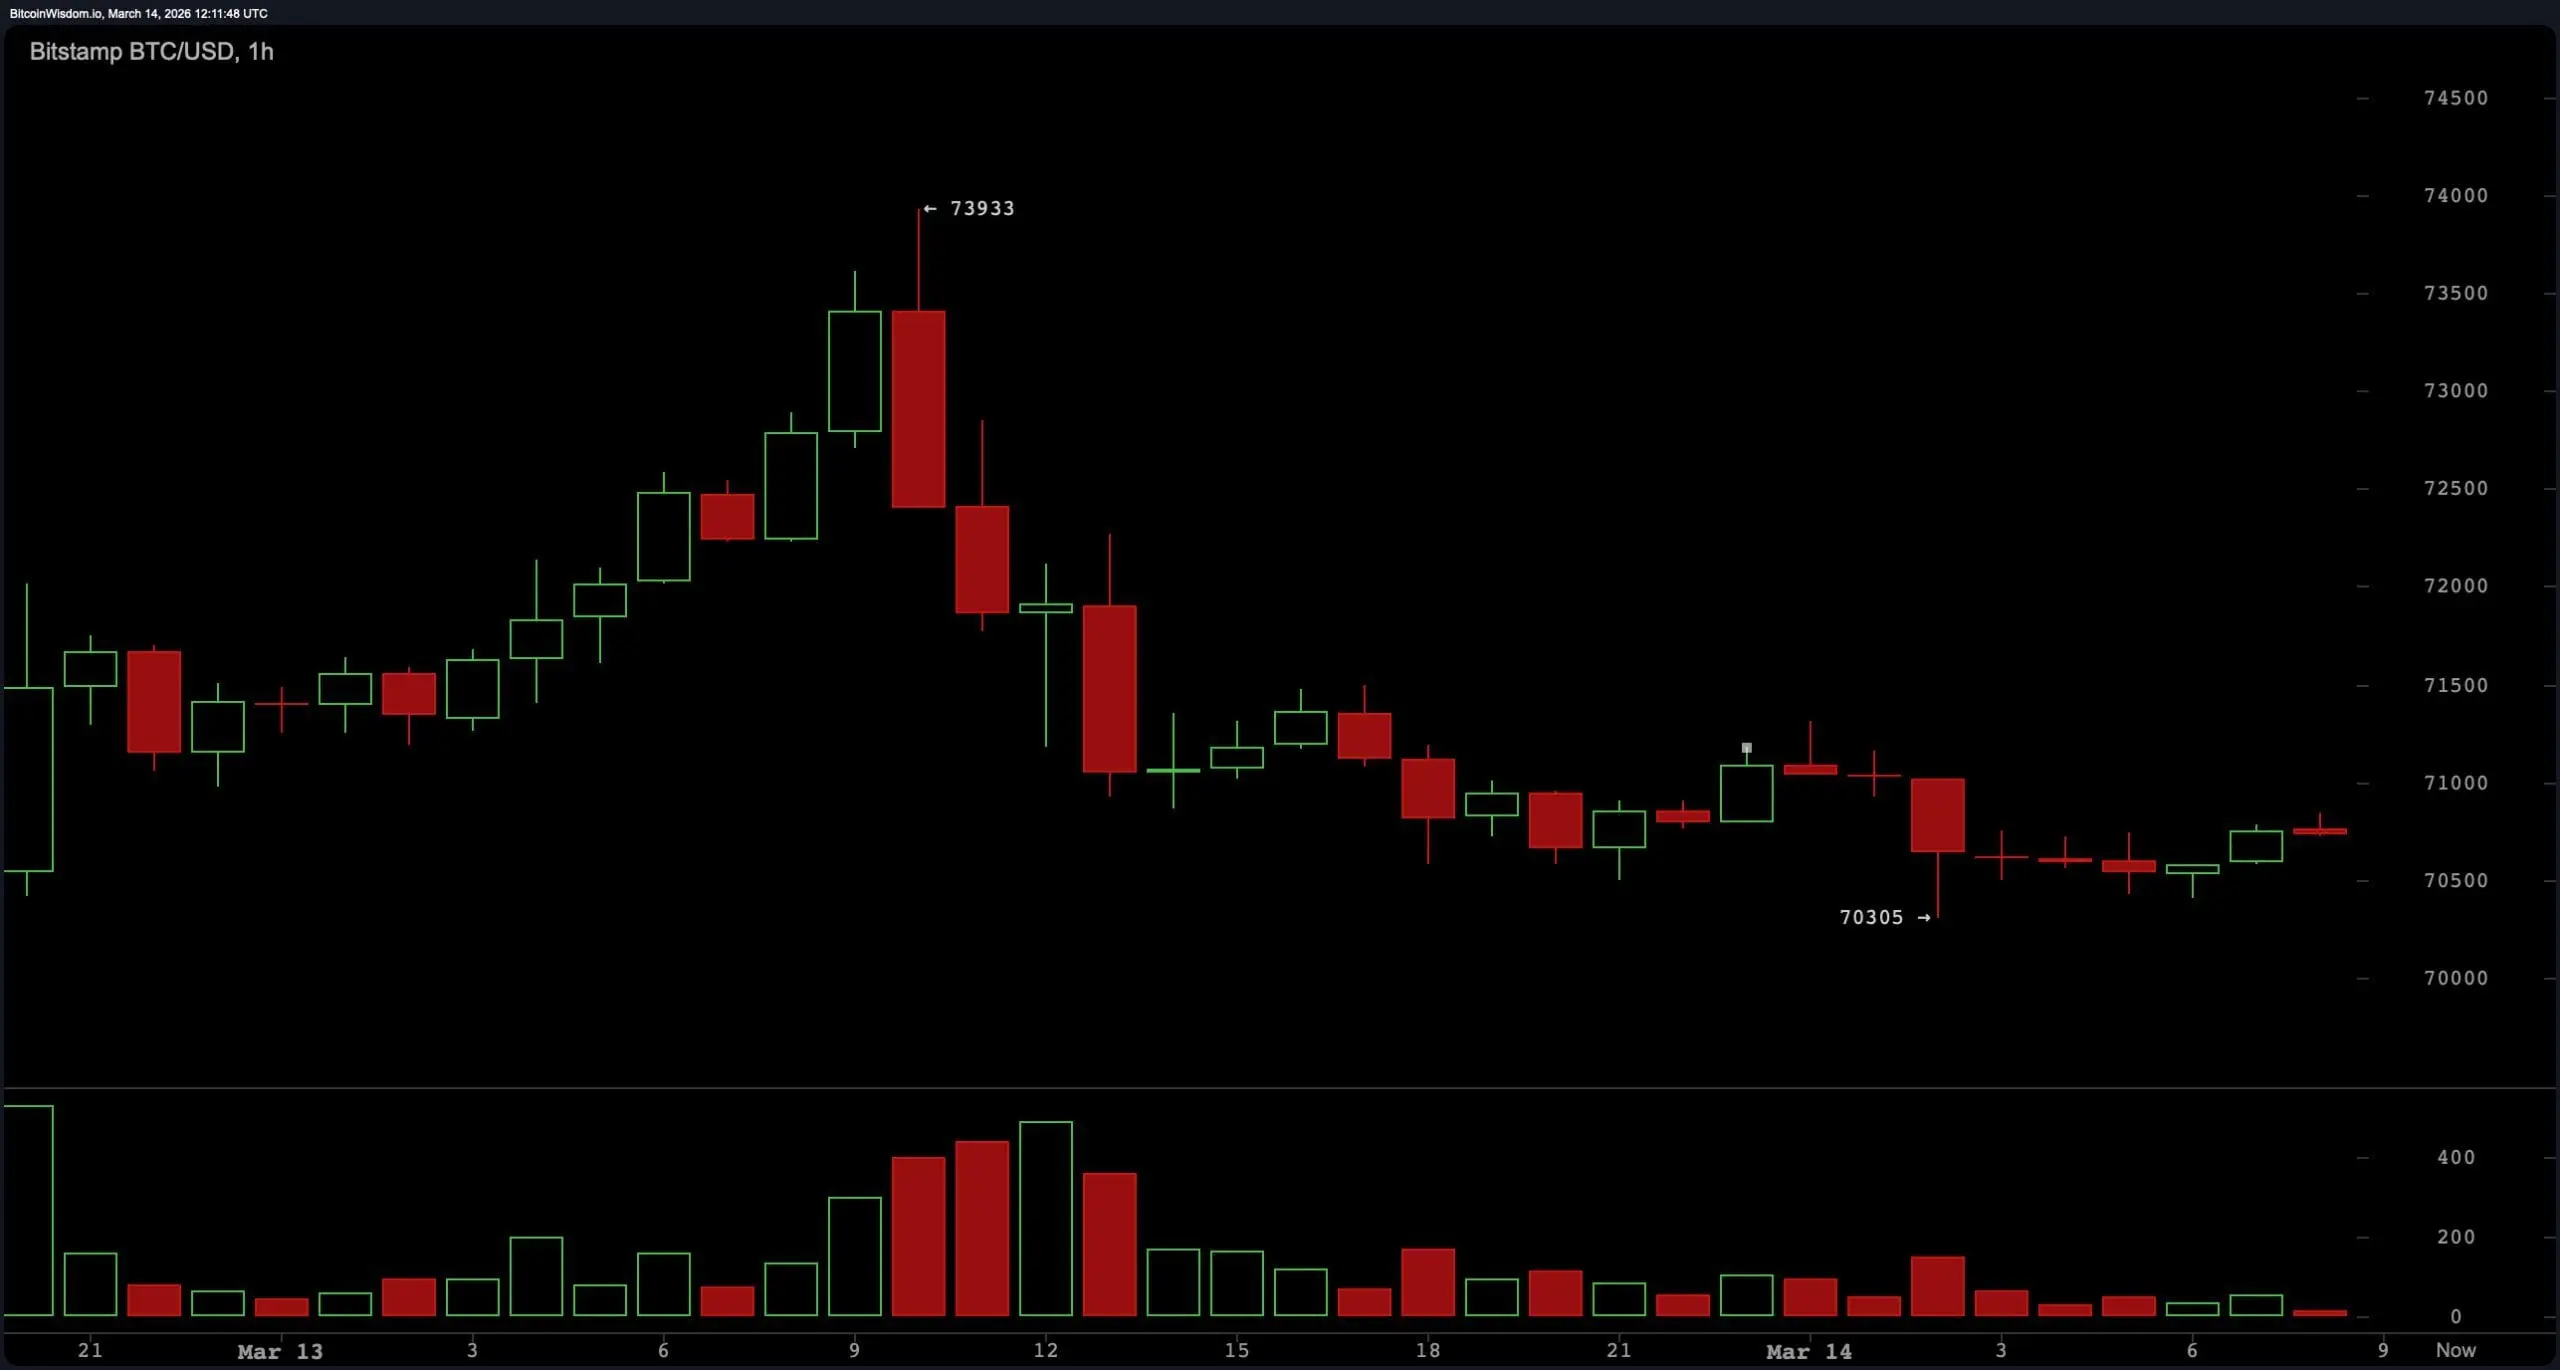 BTC/USD 1-hour chart via Bitstamp on March 14, 2026.
Oscillator readings reflect a neutral technical environment. The relative strength index ( RSI) is positioned at 53, indicating balanced momentum conditions. Stochastic reads 68, while the commodity channel index (CCI) is measured at 89, both also categorized as neutral signals.
BTC/USD 1-hour chart via Bitstamp on March 14, 2026.
Oscillator readings reflect a neutral technical environment. The relative strength index ( RSI) is positioned at 53, indicating balanced momentum conditions. Stochastic reads 68, while the commodity channel index (CCI) is measured at 89, both also categorized as neutral signals.
The average directional index (ADX) stands at 25, showing limited trend strength across the market. The Awesome oscillator records 2,432 and remains neutral. Momentum shows −1,891, signaling short-term downward pressure, while the moving average convergence divergence ( MACD) level registers −186 and signals upward momentum in the indicator summary.
Moving averages (MAs) present a split structure between short-term support and longer-term resistance levels. The exponential moving average (EMA) 10 sits at $69,648 and the simple moving average (SMA) 10 at $69,310, both signaling upward momentum relative to the current price. The EMA 20 at $69,305 and SMA 20 at $68,287 also remain supportive of the current range, along with the EMA 30 at $70,053 and SMA 30 at $68,215.
Longer-term averages reflect downward pressure, with the EMA 50 at $72,764 and the SMA 50 at $71,703 positioned above the price. Higher-period averages remain significantly elevated, including the EMA 100 at $79,665, SMA 100 at $80,935, EMA 200 at $87,978, and SMA 200 at $94,125. This distribution results in an overall neutral technical summary as short-term averages support current levels while longer-term averages remain above the market.
Bull Verdict:
If bitcoin maintains support above $69,500 and breaks decisively above the $71,200 resistance level, the current compression pattern could resolve to the upside. A sustained move through this level would clear short-term resistance and open the path toward $72,800 and a potential retest of the $73,800–$74,000 resistance zone seen on the daily chart. The sequence of higher lows on the four-hour timeframe and supportive short-term moving averages suggests underlying strength remains intact as long as price holds above the mid-range support area.
Bear Verdict:
A breakdown below the $69,500 support level would weaken the current consolidation structure and shift short-term momentum downward. Losing this level would place bitcoin below key range support and expose lower targets around $67,800, with a deeper support zone near $66,000 visible on the daily timeframe. Longer-term moving averages remaining above current price levels continue to signal overhead resistance, meaning sustained weakness below support could accelerate downside pressure if bearish momentum increases.
FAQ 🧭
- What is the bitcoin price on March 14, 2026?
Bitcoin is trading around $70,795, consolidating near the $70,000 level after rejecting resistance near $74,000.
- What are the key bitcoin resistance levels right now?
The main resistance levels for bitcoin are $71,200 in the short term and the major resistance zone between $73,800 and $74,000.
- What are the key bitcoin support levels to watch?
Key bitcoin support sits near $70,300 intraday, with stronger structural support at $69,500 and major support near $66,000.
- Is bitcoin trending up or down right now?
Bitcoin’s current technical trend is neutral as indicators and moving averages show consolidation between roughly $69,500 and $72,000.
Related Articles
A MicroStrategy comprou 34.164 BTC em uma semana, gastando US$ 2,54 bilhões: a terceira maior compra da história, com suas reservas totais chegando a 815 mil unidades, superando a BlackRock
A MicroStrategy comprou 341,64 bitcoins por US$ 254 milhões na semana passada, com a carteira total chegando a 815 mil unidades, tornando-se a maior instituição detentora de Bitcoin do mundo. A fonte de recursos foi principalmente por meio de captação via ações preferenciais e ações ordinárias pela STRC, refletindo um sinal de que a instituição está comprando na contramão. Embora o preço das ações da MSTR tenha sofrido pressão no curto prazo, no longo prazo ele ainda mostra uma tendência forte de alocação de capital, oferecendo aos investidores de Taiwan diversas formas de participação.
ChainNewsAbmedia14m atrás
Tether mantém participação de 8,2% em empresa de finanças de mineração de Bitcoin Antalpha após IPO de US$ 49,3M
A Tether e o CEO Giancarlo Devasini possuem 1,95 milhão de ações (8,2%) na empresa de finanças de mineração de Bitcoin Antalpha, que levantou US$ 49,3 milhões em seu IPO. A Antalpha oferece empréstimos garantidos por Bitcoin e tem uma carteira de empréstimos de US$ 1,6 bilhão.
GateNews18m atrás
ETPs de Cripto Registram US$ 1,4B em Entradas Semanais com a Alta do Bitcoin Sustentando o Otimismo
Os ETPs de criptomoedas registraram US$ 1,4 bilhão em entradas na última semana, marcando o maior nível desde janeiro, impulsionados principalmente pelo Bitcoin. As entradas no acumulado do ano atingiram US$ 3,8 bilhões, impulsionadas por um sentimento geopolítico positivo e pelo aumento do preço do Bitcoin.
GateNews58m atrás
Empery Digital reduz suas participações em bitcoin em 20 BTC; posição total cai para 2.914
A Empery Digital vendeu 20 BTC por cerca de US$ 1,5 milhão, elevando suas participações totais para 2.914 BTC. A empresa planeja continuar vendendo bitcoin para financiar recompras de ações e administrar dívidas.
GateNews1h atrás
A produção de mineração de bitcoin da Ionic Digital cai 14,9% em março, e as participações aumentam para 2.815 BTC
A Ionic Digital registrou uma queda de 14,9% na produção de mineração de bitcoin em março, gerando 28,05 BTC com uma redução na taxa de hash de 19,4%. A empresa tem 2.815,6 BTC e manteve dívida zero, sem vender nenhum bitcoin em março.
GateNews1h atrás
O ETF de Bitcoin atraiu quase US$ 1 bilhão em capital na semana, estabelecendo o maior recorde de entrada líquida de fundos desde janeiro
O ETF de Bitcoin à vista teve entrada líquida de US$ 996 milhões na semana, atingindo a maior alta desde janeiro, com o IBIT da BlackRock liderando. O total de ativos do ETF de Bitcoin à vista ultrapassou US$ 100 bilhões, e a tendência de alocação institucional continua.
GateInstantTrends1h atrás

