Share crypto content and earn up to 60% commissions through content mining.
placeholder
gatefun
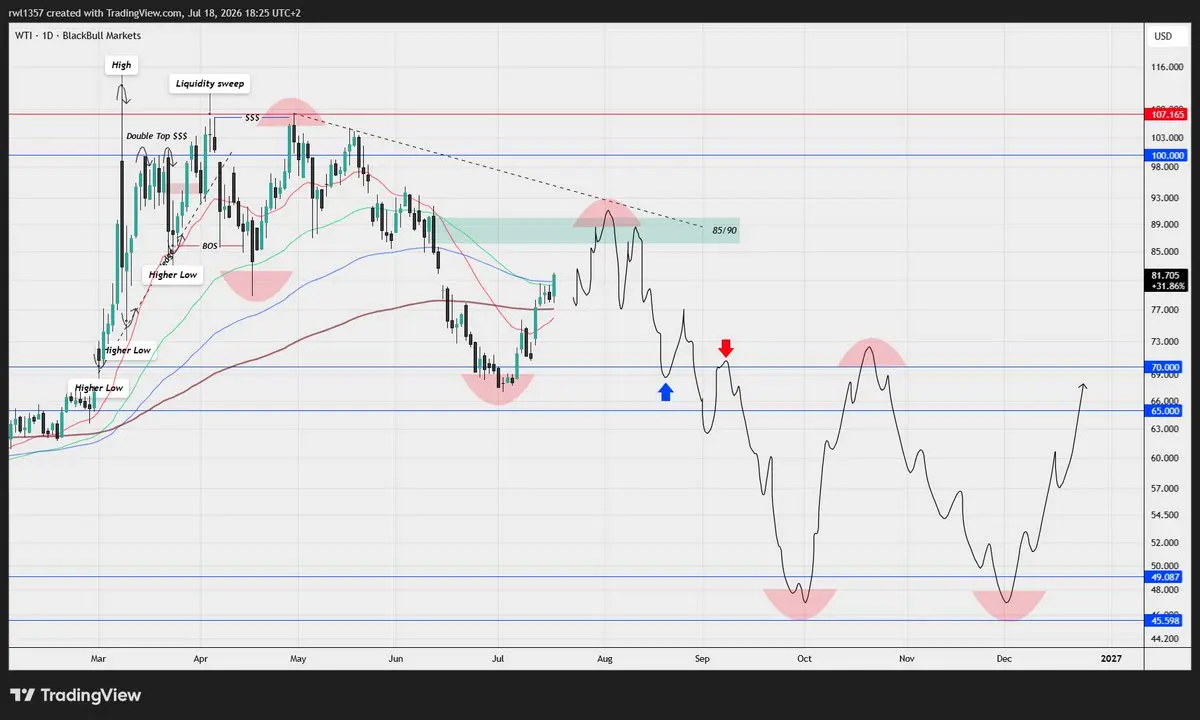
OIL is about to form another macro lower high after bouncing from the $65–70 area highlighted a few months ago. This aligns with my view that a recession was never an option during a midterm year, therefore with inflation no longer proving to be sticky, I expect oil to continue trending lower into November potentially reaching the 45–50 range this time
post-image
  • Reward
  • Comment
  • Repost
  • Share
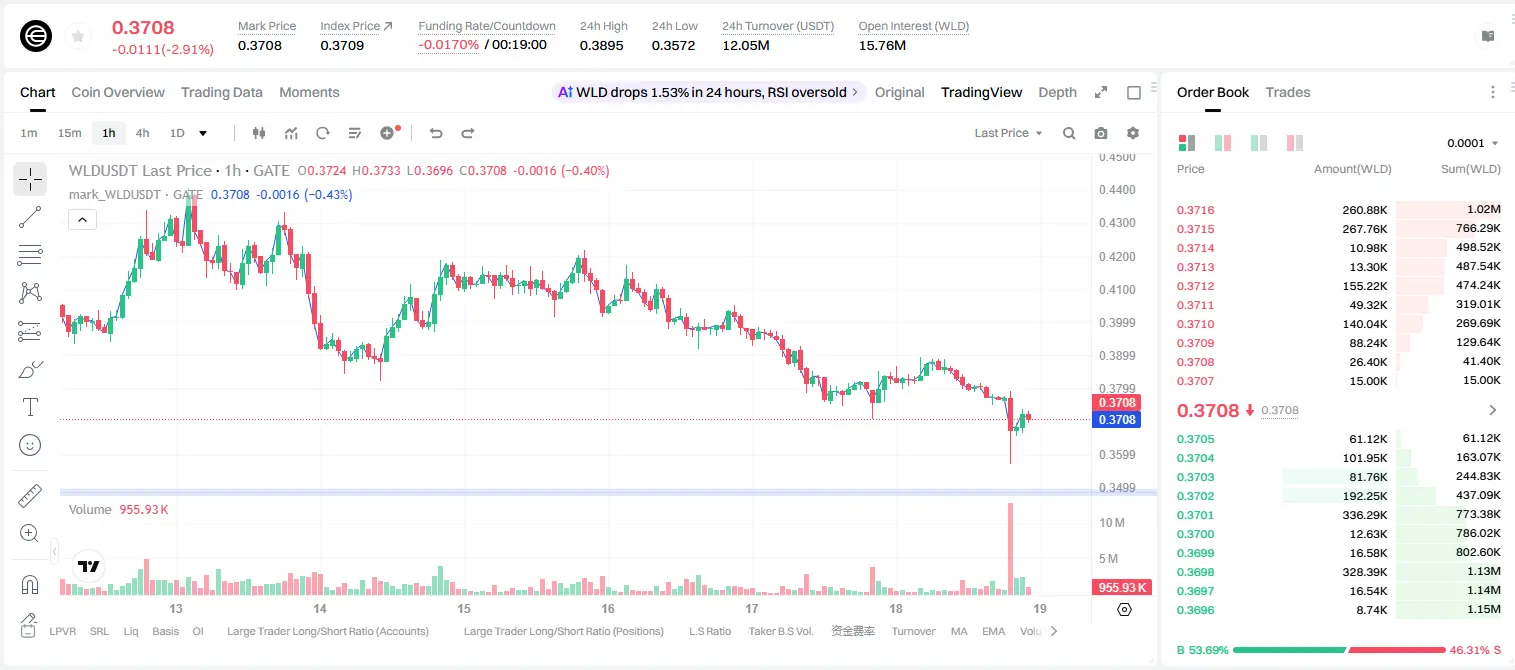
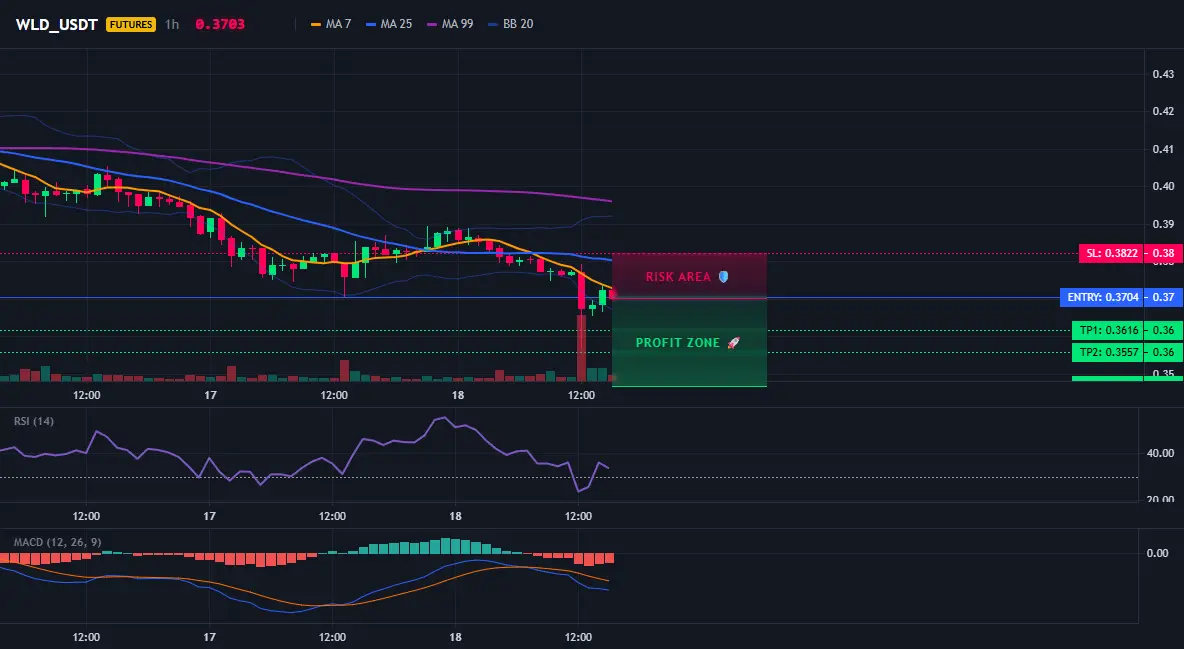
WLD short signal is already at 95%. Are you game to follow?
$WLD /USDT - SHORT
Trading plan:
Entry: 0.3692 – 0.3716
SL: 0.3822
TP1: 0.3616
TP2: 0.3557
TP3: 0.3469
Why focus on this setup?
- On the 4-hour timeframe, the bearish trend is clear; the RSI on the 15-minute chart is only 43.2, with weak momentum.
- Around 0.3704, TP1 is 0.3616, TP2 is 0.3557; stop loss is 0.3822, with a reasonable risk-reward ratio.
- Why now? The daily chart stays bearish, and ATR is only 0.0049—after volatility contraction, breakouts often accelerate.
Discussion:
Will this short hit TP2 first, or will it be a bear
WLD-3.58%
View Original
post-image
post-image
  • Reward
  • Comment
  • Repost
  • Share
Bitcoin Market overview
gate liveLIVE
1,375
live-coin
  • Reward
  • 9
  • Repost
  • Share
CryptoMary:
2026 GOGOGO 👊
View More
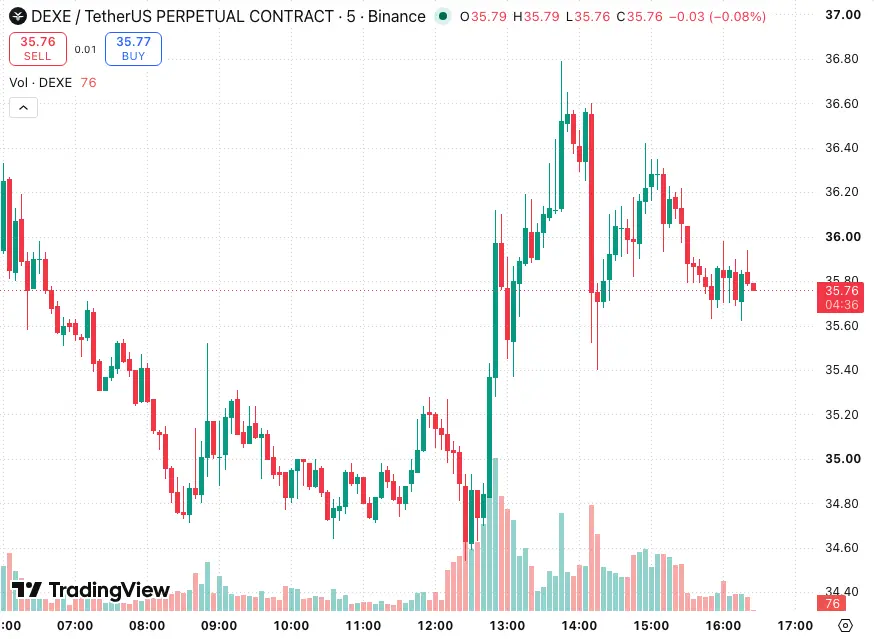
$DEXE Watch for short-selling opportunities! Today’s data is a bit scary: net sells alone pushed directly to $9.31 million, more than three times the inflow amount. From the chart, it still looks like it’s ranging/sideways, but I think it’s likely that the main players are quietly dumping to lure longs. For this kind of sideways “bait-and-fake” script, it’s very likely to be followed by a big waterfall move. Don’t chase too much—watch the risks and consider shorting from a good level to see.
DEXE4.54%
View Original
post-image
  • Reward
  • Comment
  • Repost
  • Share
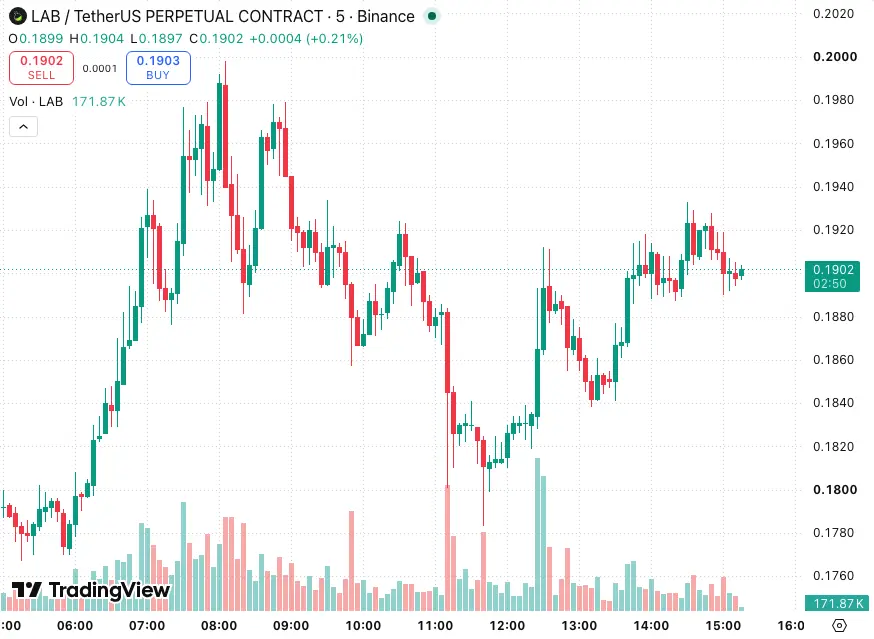
$LAB Watch the long opportunity. If this dump drops down, a bunch of people will definitely claim they saw it coming in hindsight, but I’m actually betting on a reversal upward. Right now, the 4-hour level still supports going long. Although the daily chart is ranging, the price has shown solid support reactions in the 0.188 to 0.190 range. The 15-minute RSI is around 54, momentum is neutral, and there’s still room for further upside. The most important part is that the 15-minute volume has surged by 4x—the buy pressure is real. I’ve already entered myself. Everyone can keep an eye on entry a
LAB3.07%
View Original
post-image
  • Reward
  • Comment
  • Repost
  • Share
Trading Tip 104:
Focus on Improving not Proving🥂
post-image
post-image
  • Reward
  • Comment
  • Repost
  • Share
🚨 STOP... STOP... STOP... 🚨
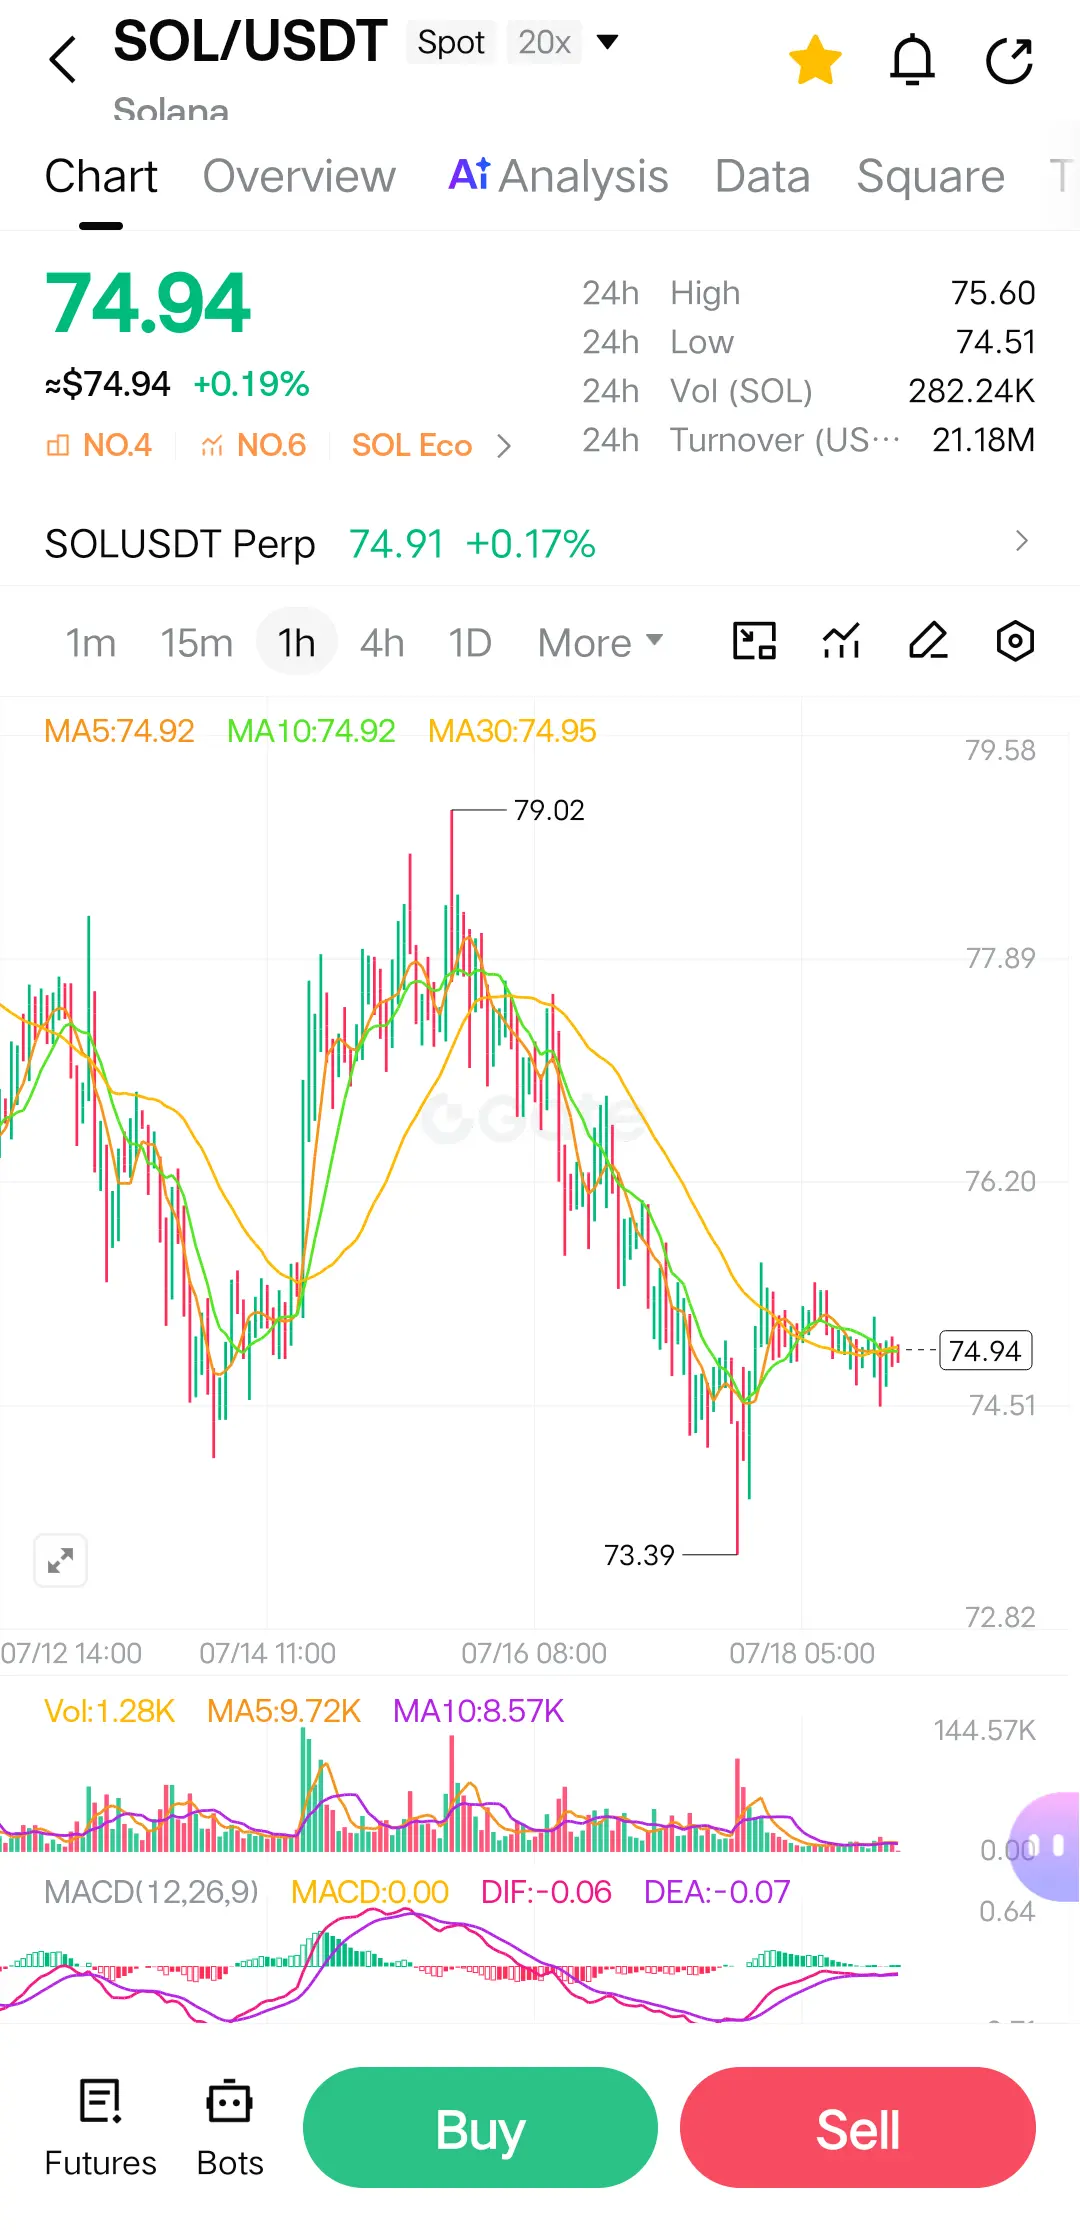
🔥 $SOL /USDT is preparing for its next breakout! Buyers are defending the SuperTrend support, and price continues to hold above a key demand zone. A strong push above resistance could unleash fresh bullish momentum. 🚀
🚸 SOL/USDT 🔰 LEVERAGE: 1X–20X
🚀 LONG
✅ ENTRY: $74.80 – $75.00
🎯 TARGETS 1️⃣ $75.60 2️⃣ $76.20 3️⃣ $77.00 4️⃣ $78.00
🛑 STOP LOSS: $74.20
📊 Market Snapshot 💰 Current Price: $74.89 📈 24H Change: +0.12% 🚀 24H High: $75.60 📉 24H Low: $74.50
⚠️ Key Level: A confirmed close above $75.60 could trigger a strong rally toward $77+. Holding above $74
SOL0.33%
post-image
  • Reward
  • Comment
  • Repost
  • Share
#ETHStandsAbove1900 : The Battleground for the Next Crypto Rally
In the ever-volatile world of digital assets, price levels often carry far more weight than just a number on a screen. They represent psychological milestones, institutional entry points, and the distillation of market sentiment. Today, one such level is commanding the attention of every trader, analyst, and long-term holder in the ecosystem: $1,900 for Ethereum (ETH) .
The narrative that "ETH Stands Above 1900" is not just a casual observation of the daily price action; it is a critical signal of market strength, resilience, and
post-image
  • Reward
  • Comment
  • Repost
  • Share
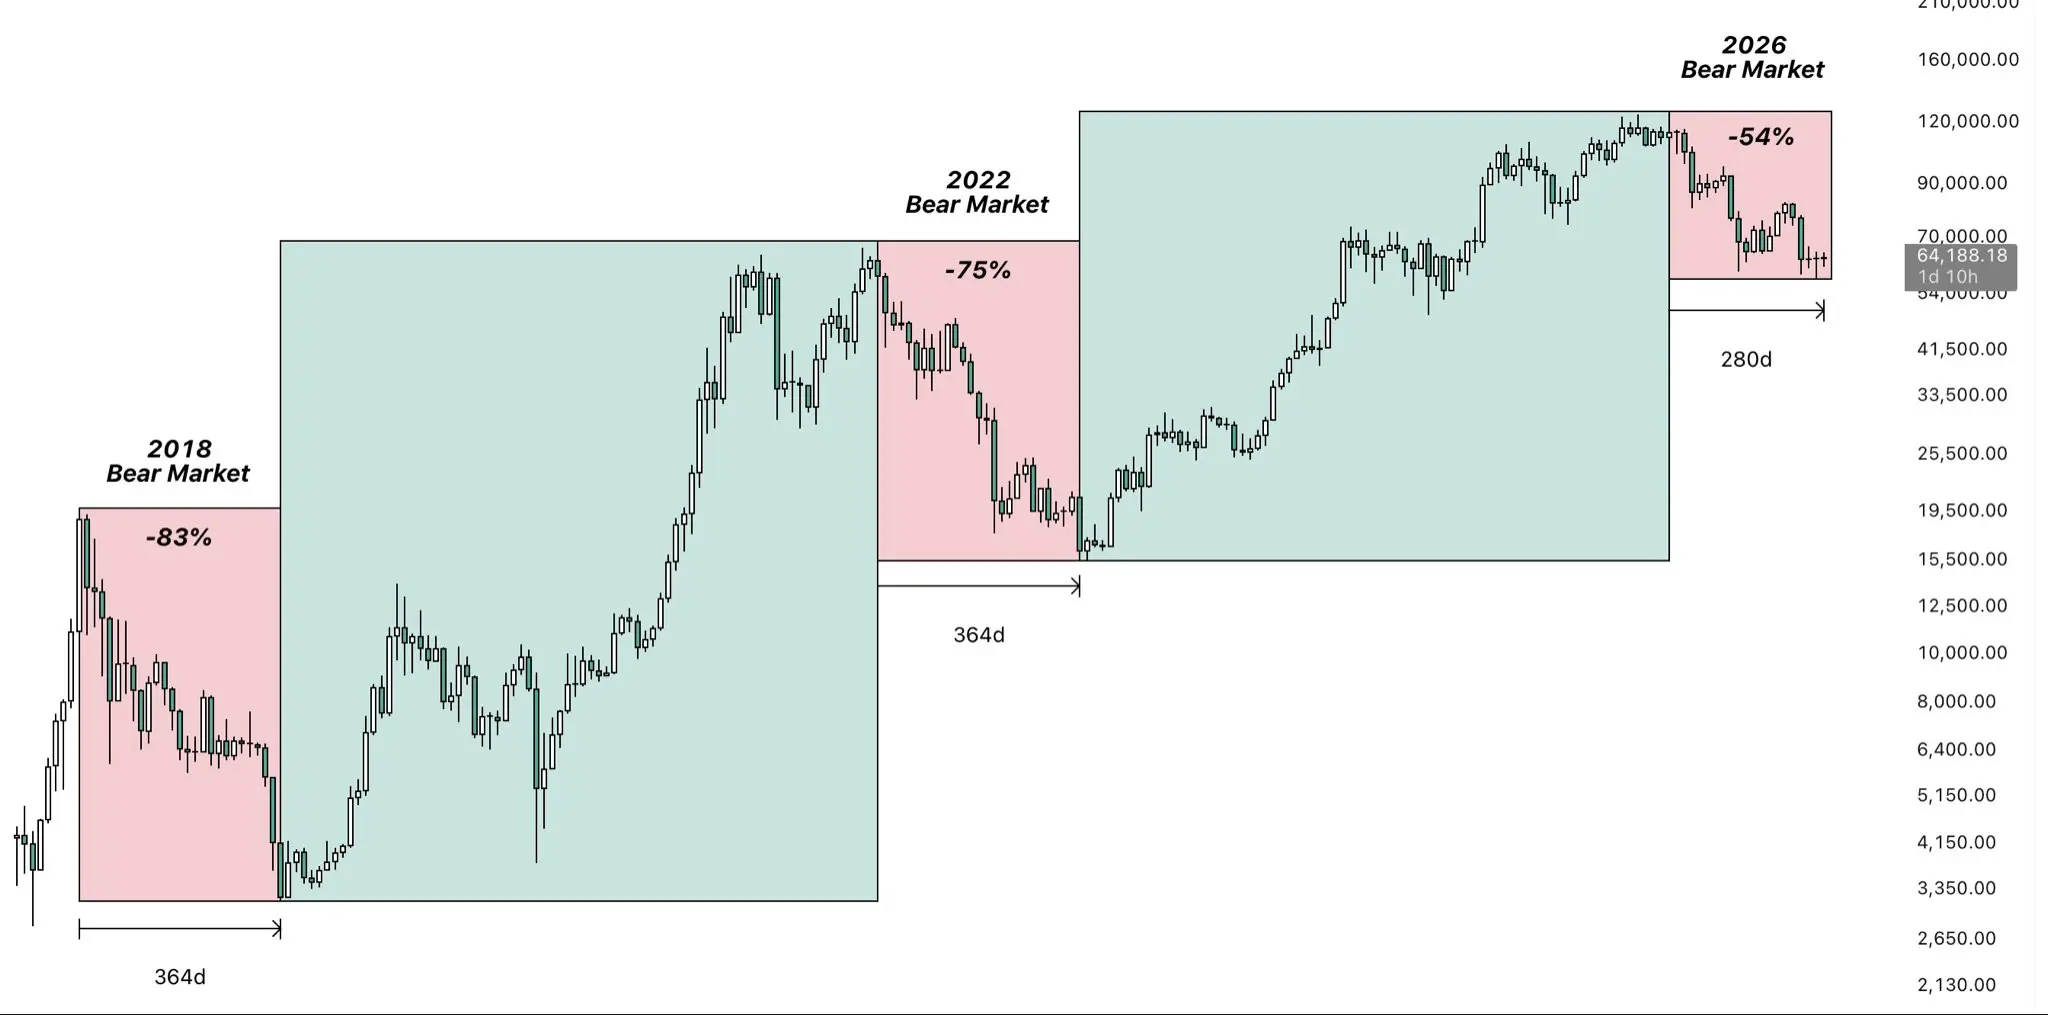
$BTC Looking at the previous two bear markets, there is still a reasonable chance that we haven’t seen the final capitulation yet.
Both the 2018 and 2022 bear markets lasted roughly one year from the cycle top to the eventual bottom.
We are currently only around day 280, which means there could still be close to three months of bearish PA ahead if this cycle follows a similar timeframe.
We have also seen diminishing returns across the past bear markets. BTC dropped around 83% in 2018 and 75% in 2022, while the maximum drawdown this time has only been around 54% so far.
That is still over 20% l
BTC1.14%
post-image
  • Reward
  • 2
  • Repost
  • Share
ArtChainDealer:
Looking at 2018 and 2022, both took almost a year to hit the bottom. Now it’s only been 280 days—just hang in there for another three months. Don’t panic.
View More
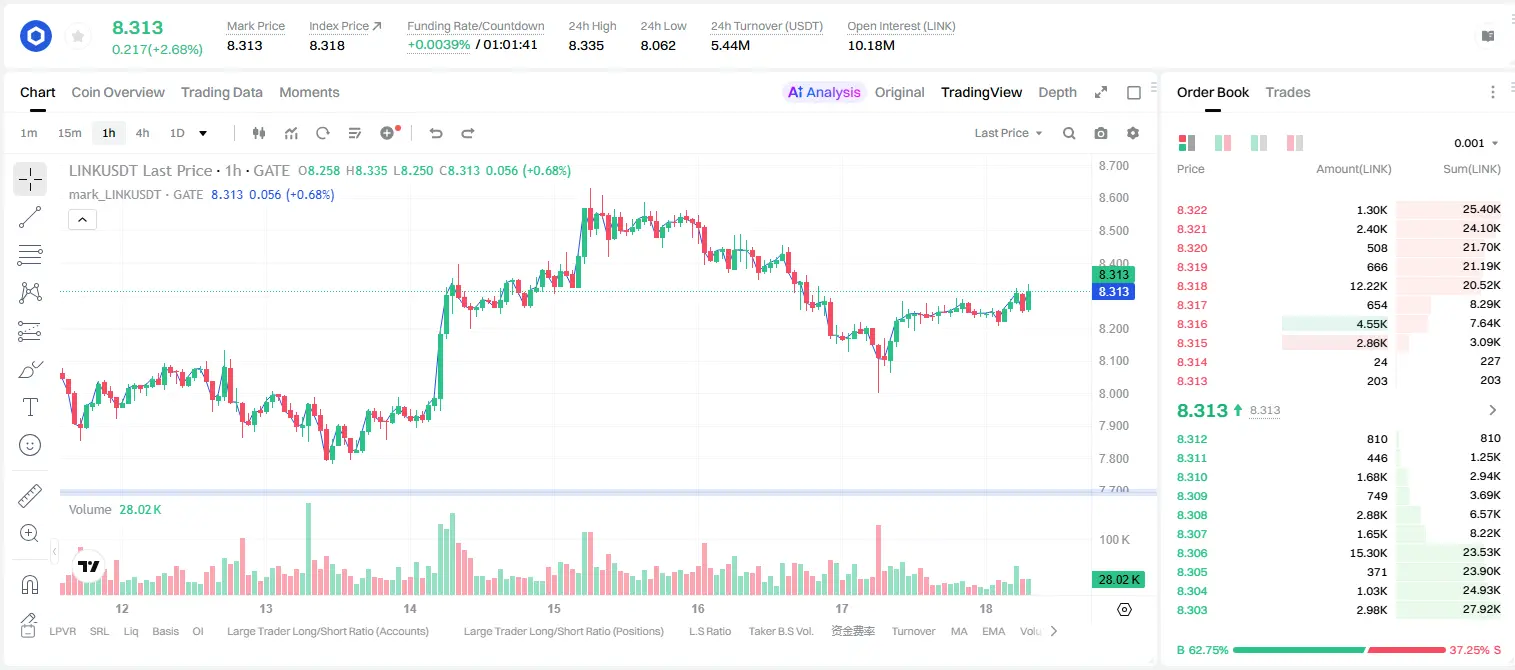
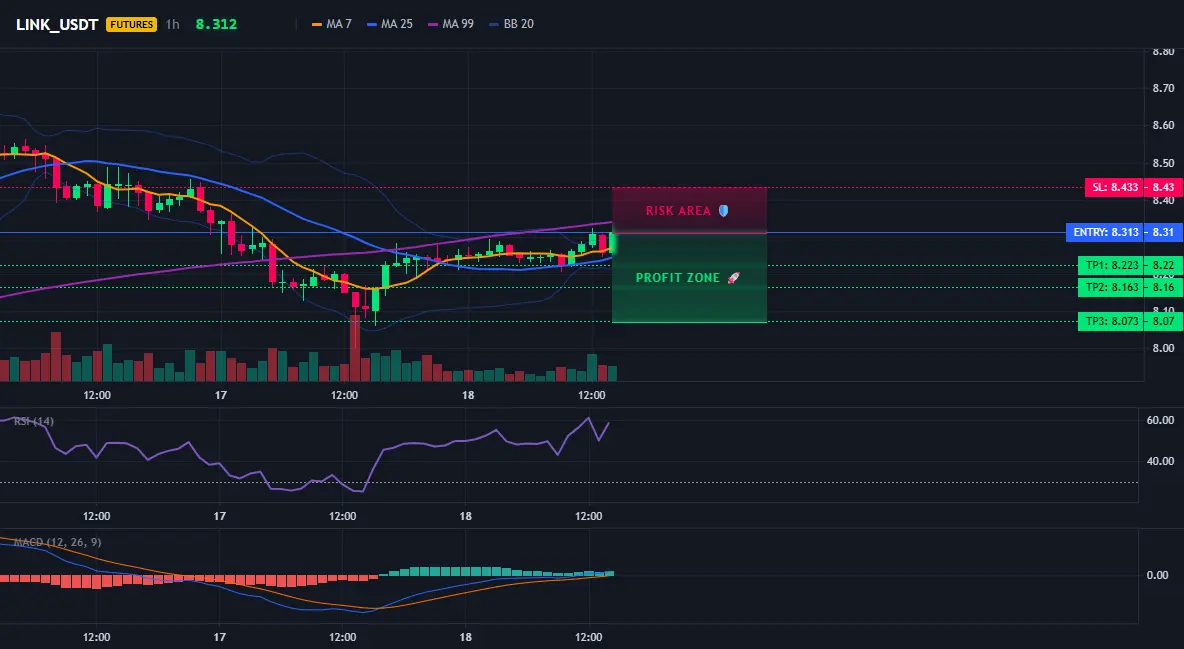
LINK 4-hour timeframe hides reversal signals—are you brave enough to short?
$LINK /USDT - SHORT
Trading plan:
Entry: 8.300 – 8.326
SL: 8.433
TP1: 8.223
TP2: 8.163
TP3: 8.073
Why focus on this structure?
- Current price 8.313: EMA and RSI (62) show short-term overbought, and the 4H direction is clearly SHORT.
- Within the daily ranging range, the resistance at 8.326 hasn’t been broken, leaving room for downside to TP1: 8.223.
- Why now? The 15-minute RSI has already rolled over from high levels—wait for confirmation of an entry below 8.300.
Discussion:
Will this move hit TP2: 8.163 first, or wi
LINK0.94%
View Original
post-image
post-image
  • Reward
  • Comment
  • Repost
  • Share
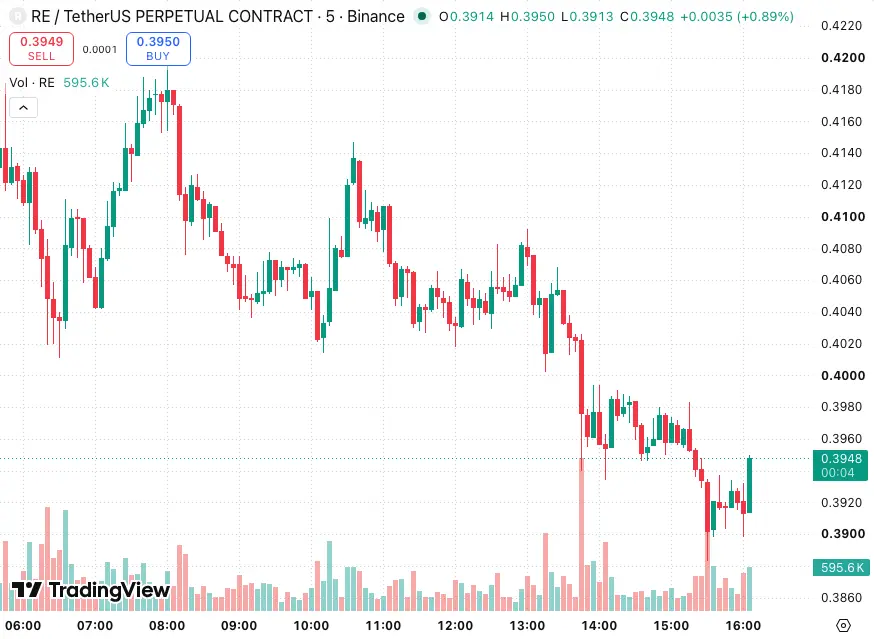
$RE Get ready to look at a lot. This drop is way too brutal—it's already severely oversold. I think there could be an oversold rebound here. Get a bit of blood back and then see whether it continues down. For the entry price, you can watch the 0.3822 to 0.392 range. For the upside target, first look near 0.408 to 0.425. Place your defense at 0.367. But pay attention to the risk—this is a contrarian trade, and the hourly short momentum is still very strong. If things go badly, there could be a chain liquidation risk. Down below there is buying support, but don’t go heavy—control your position
RE-15.42%
View Original
post-image
  • Reward
  • Comment
  • Repost
  • Share
THE WORLDCUP PREDICTION
gate liveLIVE
611
  • Reward
  • Comment
  • Repost
  • Share
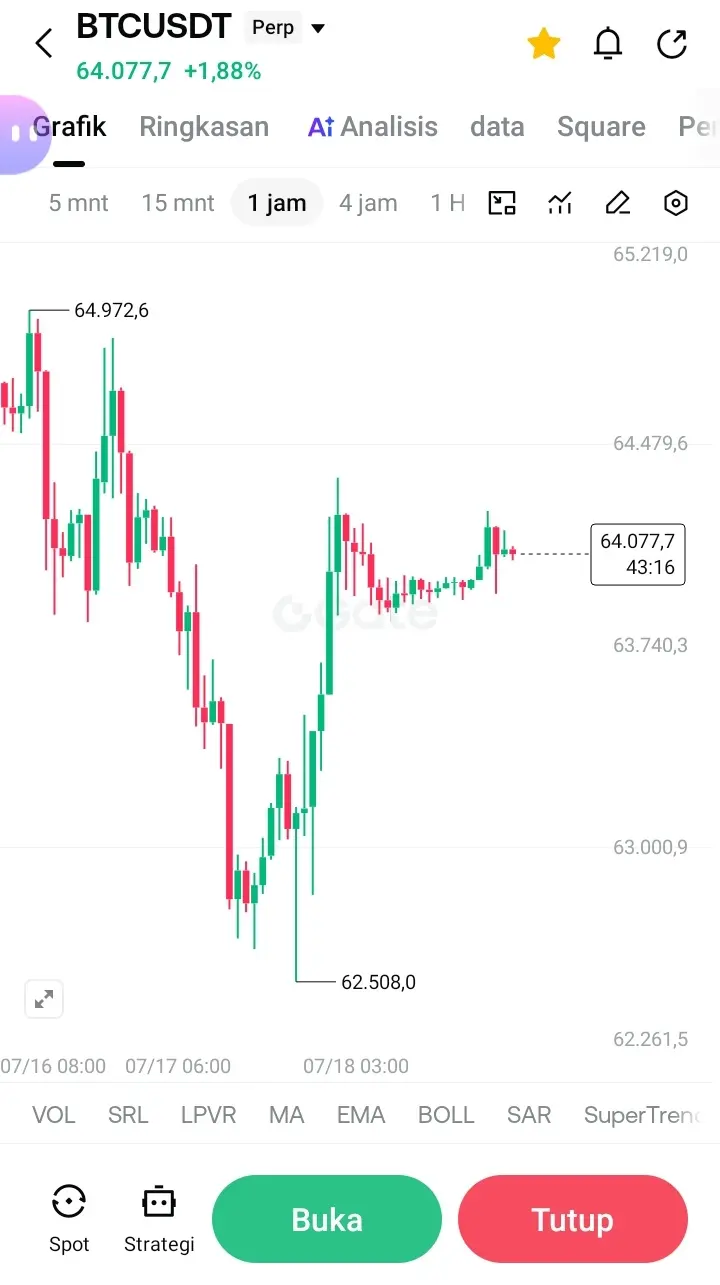
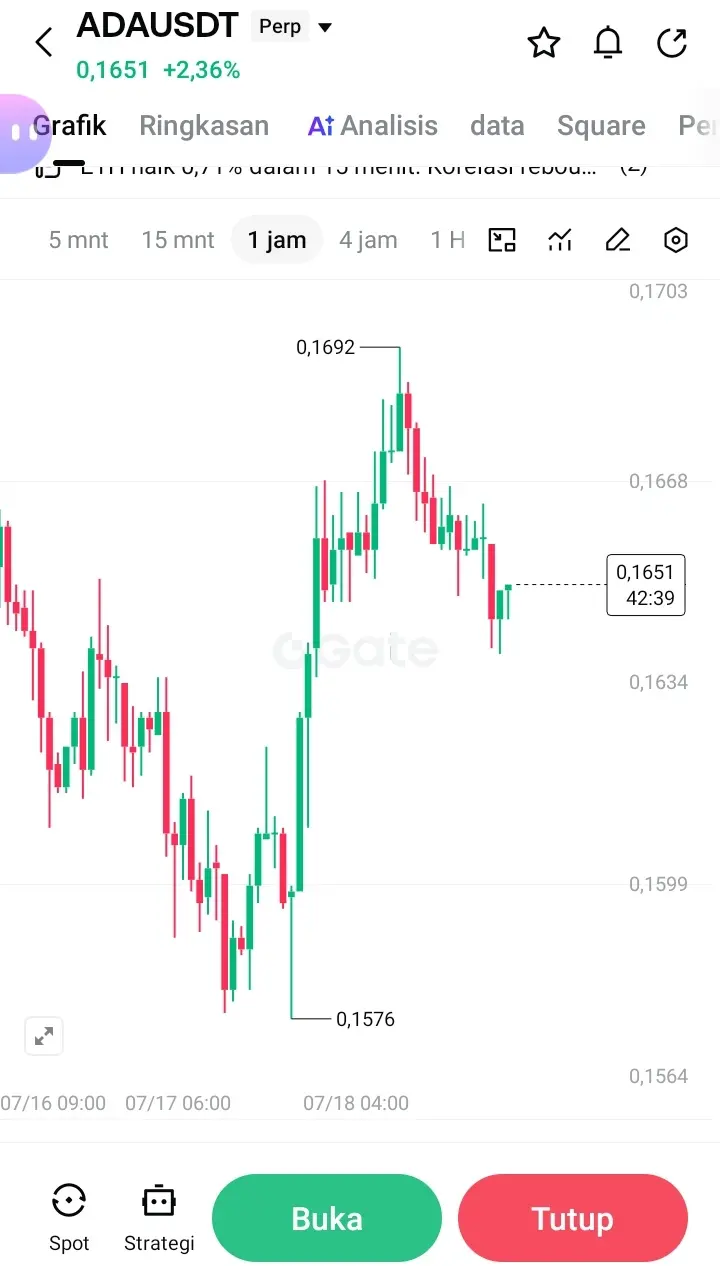
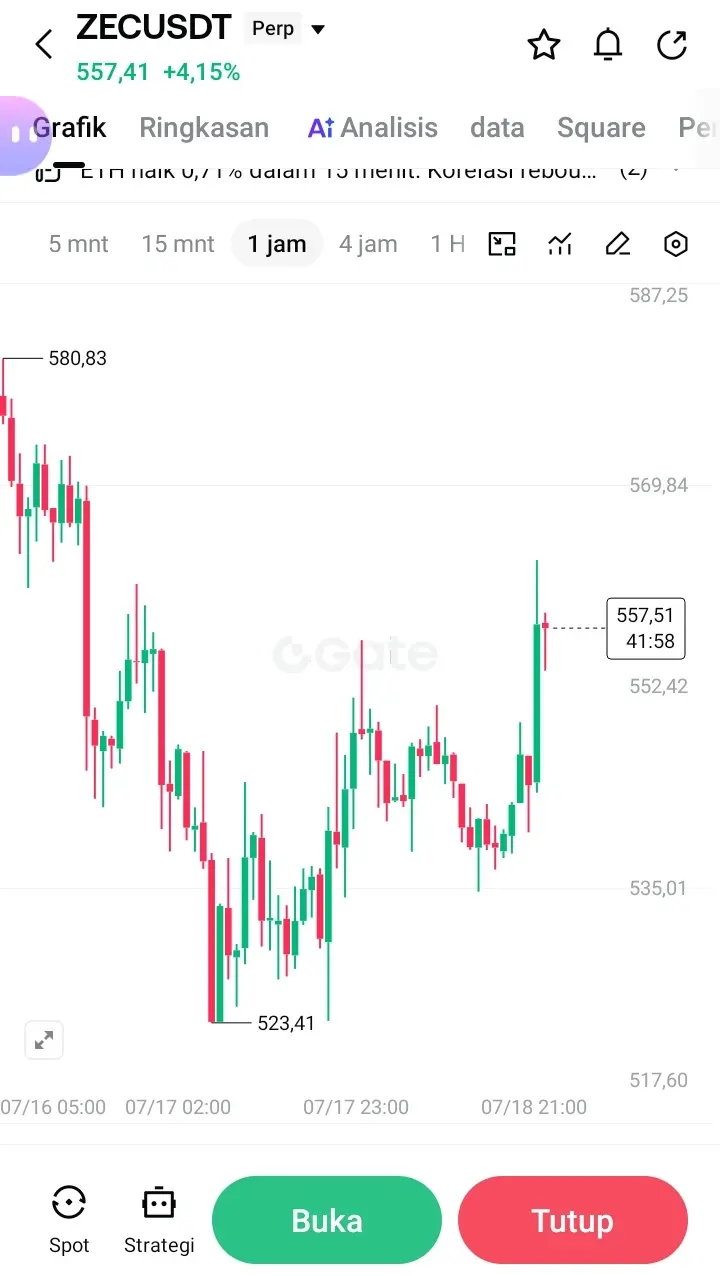
BTC Signal | Bollinger Bands 4 Hours Tightens + 1-Hour Funding Closure, Buy When Price Drops
The 1-hour BTC buying pressure has closed to 0.63, quickly pulling the price back from 63925 to 64180, quickly absorbing short-term sell pressure. The 4-hour Bollinger Bands have tightened to the 62946-65320 range, with the mid-band at 64133 acting as a short-term resistance. Funding rates are low at 0.0040%, contract positions are stable, and there are no signs of a short squeeze. The 1-hour MACD has a golden cross, but the histogram is shrinking, indicating slightly weaker momentum. Objectively, the
BTC1.14%
ADA-0.18%
ZEC2.26%
View Original
post-image
post-image
post-image
  • Reward
  • 2
  • Repost
  • Share
CryptocurrencyAnalysis:
1000x Vibes 🤑
View More
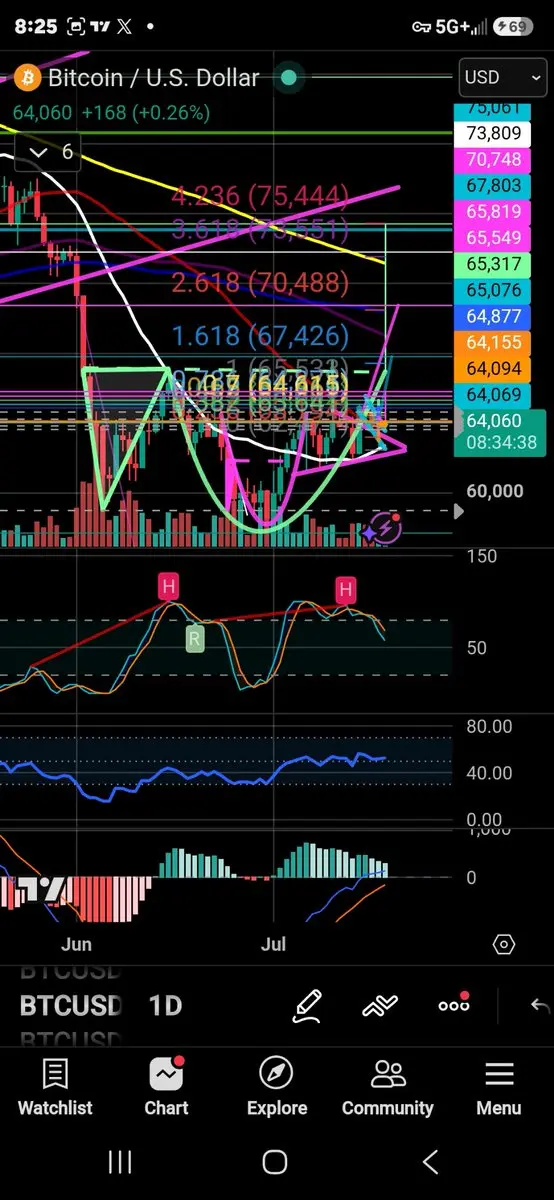
$BTC 1D Chart 🔎
Top Down Analysis Continued...
A mixed bag here on the 1D timeframe.
The moving averages are gathering tightly here indicating that a move is coming.
The stochastic RSI has a hidden bearish divergence and it is curling downwards. Some bearish vibes.
There is also a nice bullish divergence that is indicating that there could be a change in momentum coming. Flipping from bearish to bullish.
The MACD is just crossing over from bearish to bullish. However it does show some fading buying pressure.
Keep in mind the MACD is a lagging indicator.
Conclusion: Potential to flip from b
BTC1.14%
post-image
  • Reward
  • Comment
  • Repost
  • Share
cobie after another rugged memecoin on base
MEME1.23%
post-image
  • Reward
  • Comment
  • Repost
  • Share
JUST IN: Uniswap moves to implement protocol fees on select v4 pools, with an on-chain vote this Sunday across seven chains and on Robinhood Chain for v2/v3 pools. If passed, fee-bearing liquidity could shift incentives across multi-chain liquidity. $UNI
UNI0.62%
MULTI1.43%
post-image
  • Reward
  • Comment
  • Repost
  • Share
#SummerCreationCamp
🌞 #SummerCreationCamp is an incredible opportunity for every trader, investor, and market enthusiast to share original insights while learning from one of the most active global trading communities. Every day brings fresh opportunities across crypto, U.S. stocks, Hong Kong stocks, AI-related projects, and prediction markets. Instead of simply following market noise, this is the perfect time to focus on research, data-driven analysis, and long-term thinking that can help build stronger investment decisions.
The financial markets never stop evolving. Bitcoin and Ethereum co
BTC1.14%
ETH0.57%
post-image
post-image
  • Reward
  • 4
  • Repost
  • Share
HighAmbition:
thnxx thnxxxx sharing
View More
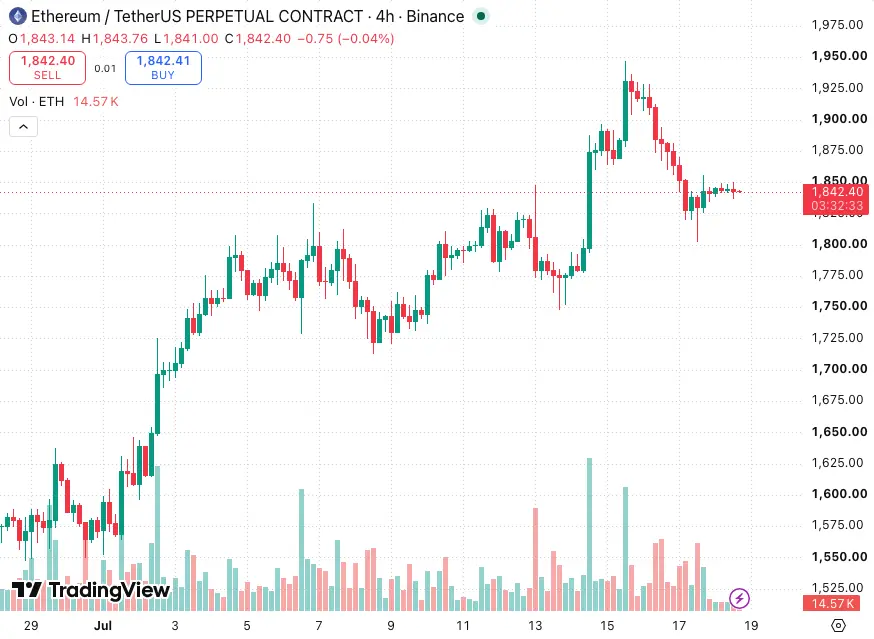
$ETH is all in panic, but I think a bullish opportunity may be coming.
The daily chart is still ranging and consolidating; the broader bullish structure hasn’t broken. There’s a clear support reaction around 1840 to 1842. Take a look at the 15-minute chart: the RSI is around 45, and there’s still plenty of room for the bulls to push upward. Also, the short-term trading volume has jumped directly by 4 times—the real buy-side capital has already entered to confirm.
You can watch for a low-long opportunity around 1840. The upside targets first look at around 1846 to 1855. But don’t go all in cha
ETH0.57%
View Original
post-image
  • Reward
  • Comment
  • Repost
  • Share
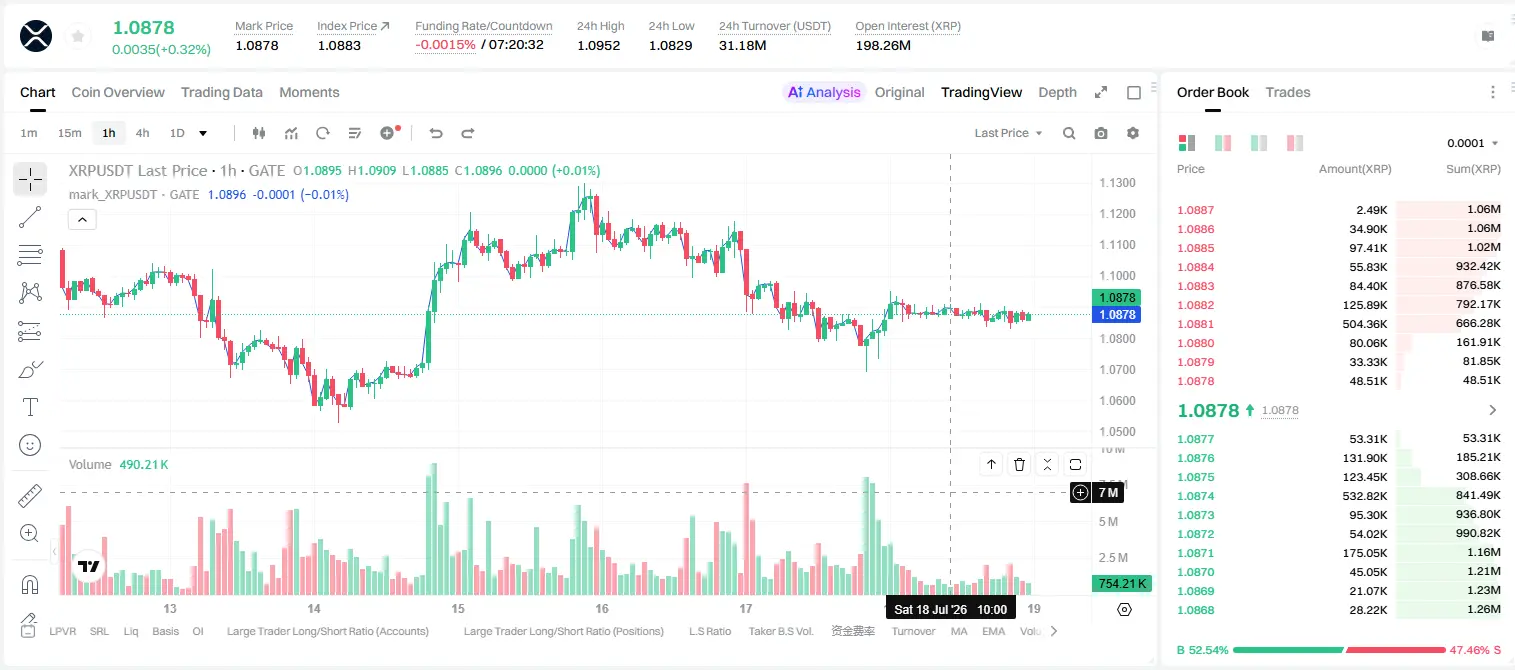
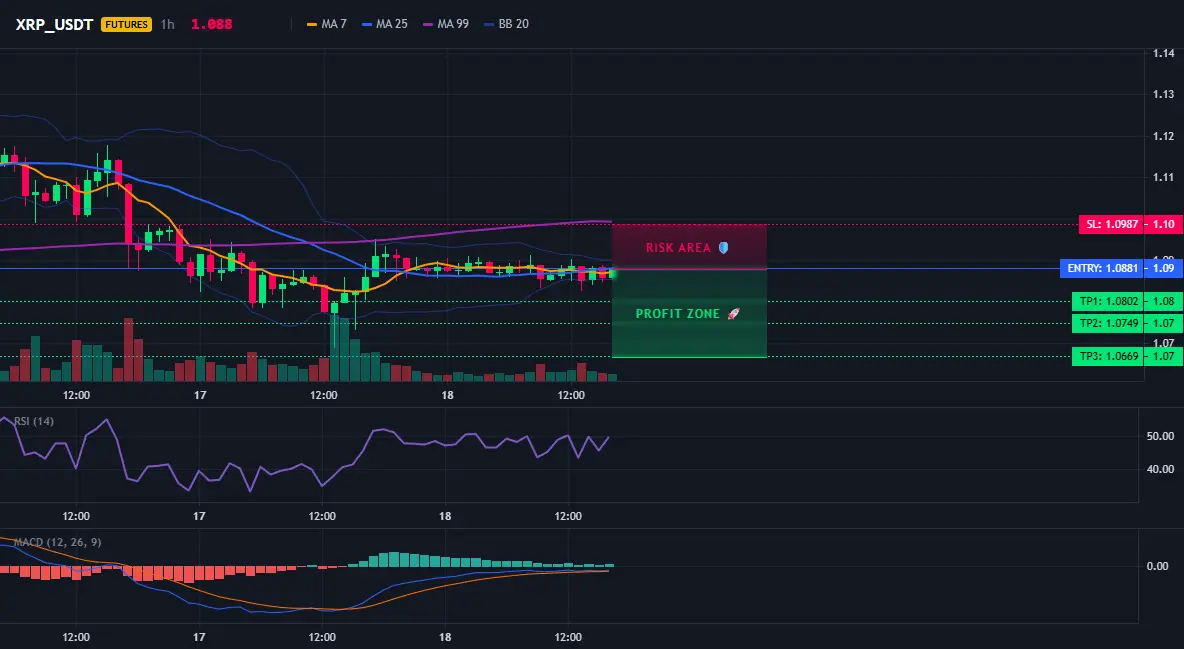
XRP bearish signals have been locked in—are you brave enough to short?
$XRP /USDT - SHORT
Trading plan:
Entry: 1.0870 – 1.0892
SL: 1.0987
TP1: 1.0802
TP2: 1.0749
TP3: 1.0669
Why focus on this structure?
- On the 4-hour timeframe, it’s clearly bearish, with a 95% high confidence.
- Around 1.0881 now, RSI on the 15-minute timeframe is 53.89—no overbought/overloaded conditions, with room to the downside.
- Targets: TP1 1.0802, TP2 1.0749, stop-loss at 1.0987.
- The daily trend is bearish—why now? The pullback hasn’t broken resistance, and bearish momentum is strong.
Discussion:
Will this move rea
XRP0.33%
View Original
post-image
post-image
  • Reward
  • Comment
  • Repost
  • Share
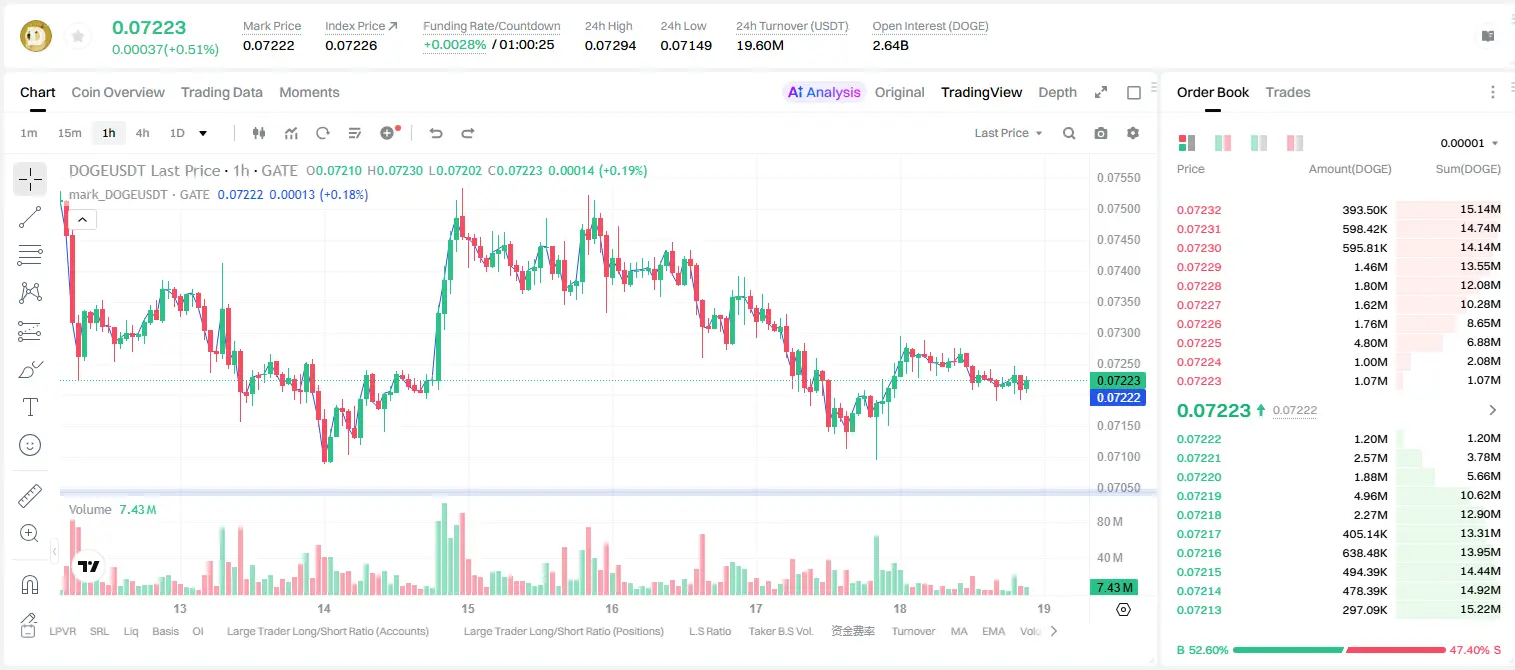
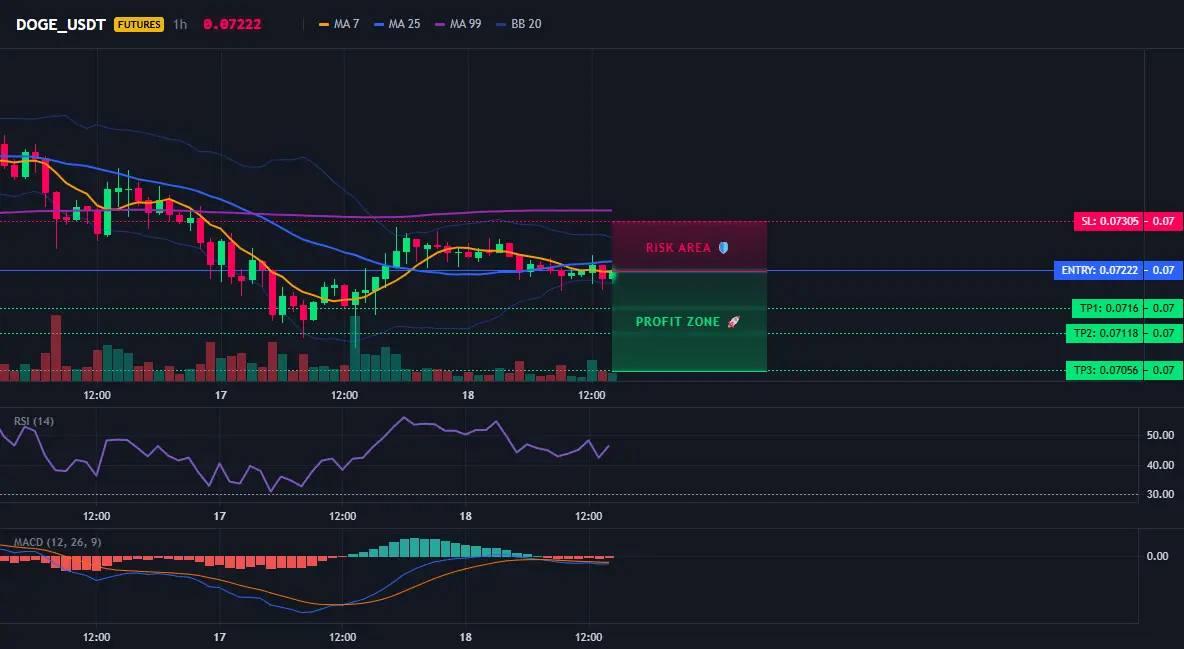
Is DOGE’s rebound just bull-trap? On the 4-hour timeframe, shorts have already set up.

$DOGE /USDT - SHORT

Trading plan:
Entry: 0.07213 – 0.07231
SL: 0.07305
TP1: 0.07160
TP2: 0.07118
TP3: 0.07056

Why focus on this structure?
- EMA/RSI data: 15-minute RSI is only 50.6, showing weak momentum, and the 1-hour EMA has not broken through the 0.07222 resistance.
- Why now? The 1D trend is clearly bearish, and a SHORT signal with 95% confidence has already triggered. The entry reference is 0.07222, with TP1 below at 0.07160.
- If it breaks 0.07213, shorts will accelerate, targeting TP2 at 0.071
DOGE-0.15%
View Original
post-image
post-image
  • Reward
  • Comment
  • Repost
  • Share
Load More

Join 40 M users in our growing community

⚡️ Join 40 M users in the crypto craze discussion
💬 Engage with your favorite top creators
👍 See what interests you
  • Pinned