Federal Reserve FOMC Meeting After the announcement, Ethereum (ETH) dropped nearly 6% in the past 24 hours, reaching the structural level of $3,250 following the Fed’s third rate cut this year. During this period, trading volume increased by 35%, indicating mounting selling pressure. CoinGlass data shows that cryptocurrency liquidation amounts surged to $400 million in the past 24 hours, despite most of it occurring during yesterday’s trading session.
FOMC Rate Cut Triggers Profit-Taking: Analyzing the $400 Million Liquidation Wave
Analysts had already priced in this rate cut expectation, so Powell’s inclination to cut rates did not surprise the market. Therefore, this appears to be a typical “sell on good news” scenario, but the timing is terrible, as Ethereum just touched the critical level of $3,250, which could mark the end of the downtrend. The bad news is: at least so far, the price action does not seem to have fully responded to this positive development.
On Wednesday, after Powell’s speech, ETH’s price surged to $3,400, and selling pressure seemed to intensify. Today’s liquidations confirm that the market is selling ETH as it approaches this key level. This “spike high and fall back” pattern is known in technical analysis as a “bull trap” or “false breakout,” where the price temporarily breaks resistance but quickly falls back, clearing out late buyers.
CoinGlass data shows that long liquidations soared to $400 million in the past 24 hours, indicating a large amount of leveraged long positions being forcibly closed as the price declined. The liquidation wave reflects excessive leverage in the market; when the price fails to continue upward as expected, leveraged traders are forced to cut losses or are liquidated by exchanges, further accelerating the downward momentum. This chain reaction is very common in crypto markets and a primary cause of short-term volatility.
However, from another perspective, the completion of the liquidation wave means that market leverage has been cleaned up, and overly speculative positions have been eliminated. Although this deleveraging process is painful, it creates conditions for a healthier rally ahead. As leverage positions decrease, price volatility tends to stabilize, allowing genuine buying interest to take hold.
The Dual Significance of the $3,250 Support and the 200-Day EMA
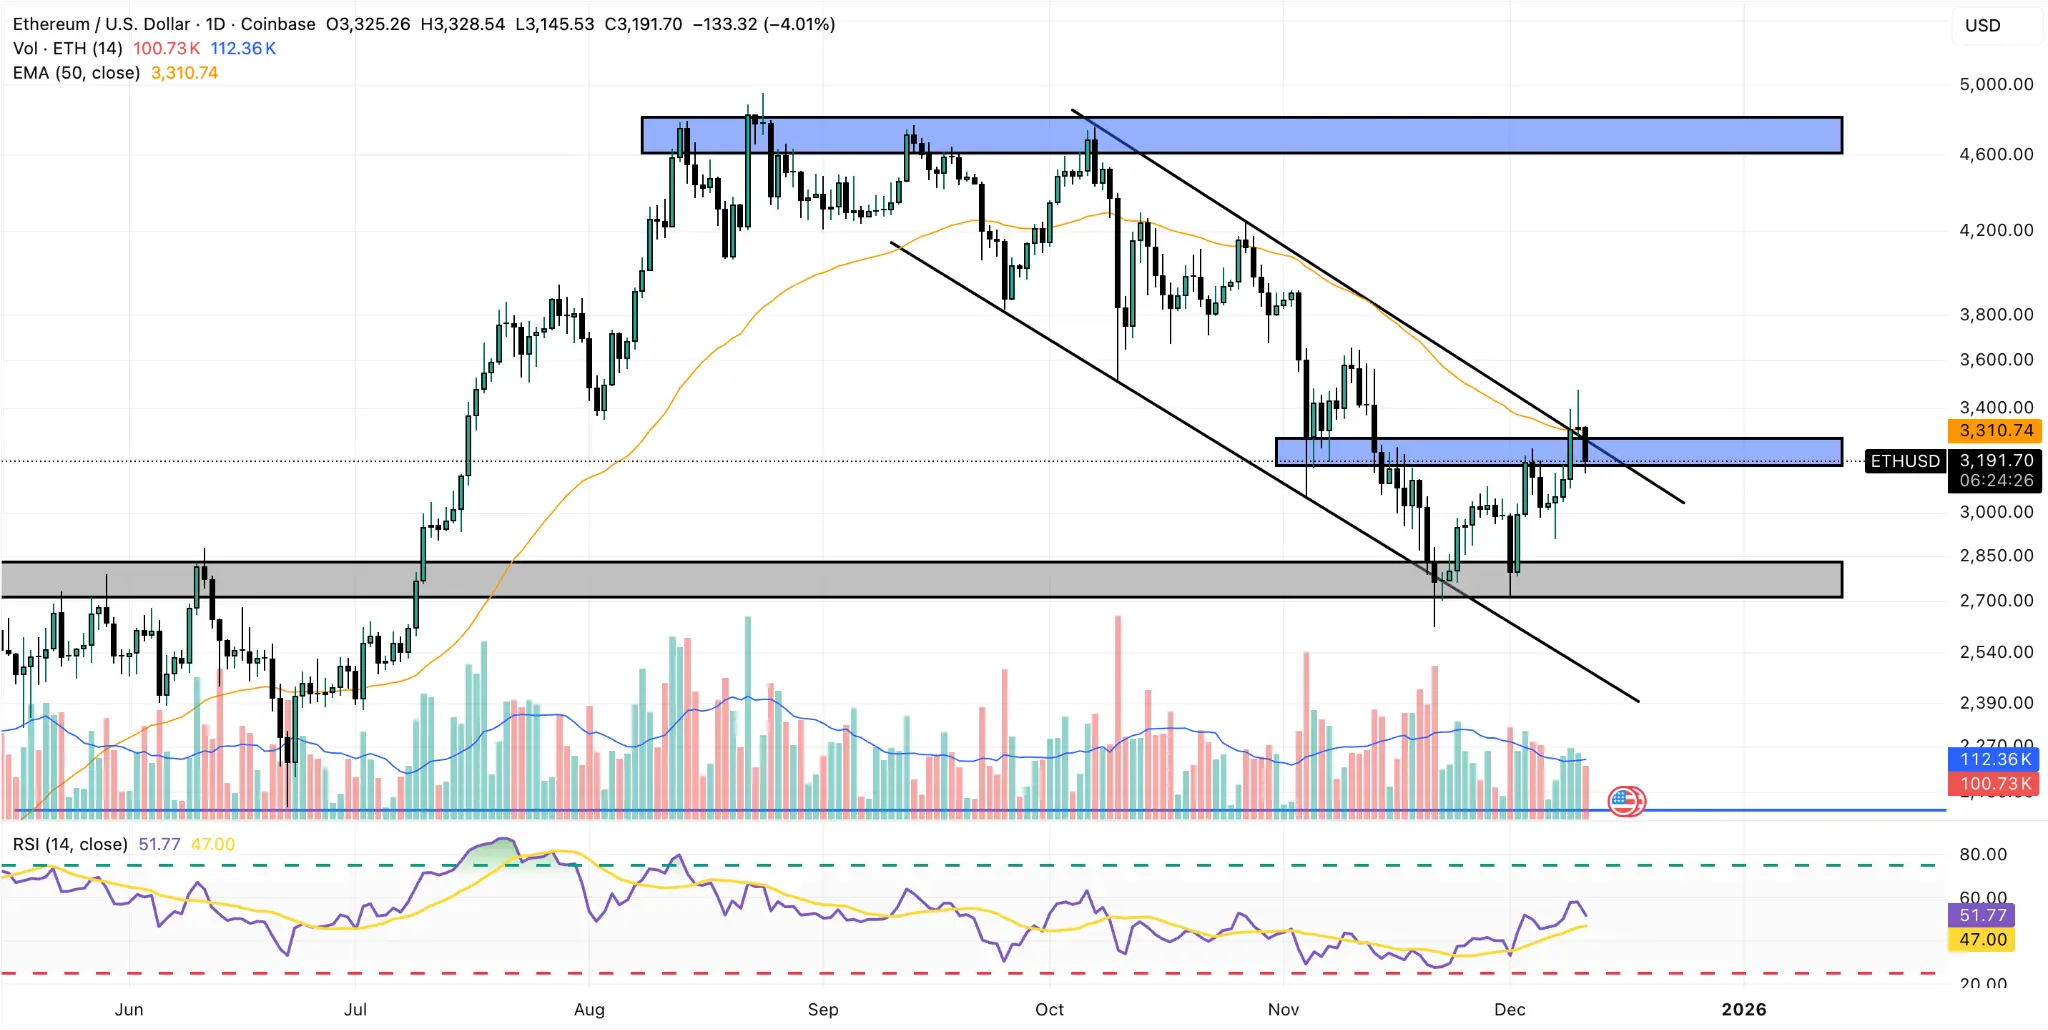
(Source: Trading View)
From the daily chart, it is evident that ETH has reached the $3,250 price zone. In previous Ethereum price forecasts, we emphasized this as a key resistance level to watch, because breaking through this resistance would break the bearish structure of ETH. Additionally, this price zone coincides with the 200-day Exponential Moving Average (EMA), increasing its technical relevance for both short-term and long-term price forecasts.
On December 4, before the FOMC meeting, we initially encountered immediate resistance. However, the price rebounded on Tuesday and broke through the $3,250 resistance level. Still, we can see early signs of resistance, such as larger upper shadows. These upper shadows indicate that the price reached higher levels but failed to hold, showing strong selling pressure around $3,400.
The 200-day EMA is one of the most important long-term trend indicators in technical analysis. When the price is above the 200-day EMA, it is generally considered a long-term uptrend; below it indicates a long-term downtrend. ETH currently struggles around $3,250 near the 200-day EMA, highlighting the importance of this level. If ETH can hold above $3,250, it would confirm a trend reversal; if it falls below, it could enter a deeper bearish correction.
The Relative Strength Index (RSI) is also at a critical juncture, currently at 52. If this bullish momentum continues, in the coming weeks or even before the end of the year, the price could advance toward $4,000, confirming a bullish structure. However, if rejection occurs on lower timeframes, ETH might quickly fall back to around $2,800.
Ethereum’s Current Three Scenario Paths
Bullish Scenario: Hold above $3,250 and break $3,400, target $4,000, potential 23% gain
Consolidation Scenario: Range between $3,150 and $3,400, building a base for clearer direction
Bearish Scenario: Fall below $3,150 support, target $2,800, approximately 14% decline
Hourly Rebound Signs: Technical Bounce After RSI Bottoming
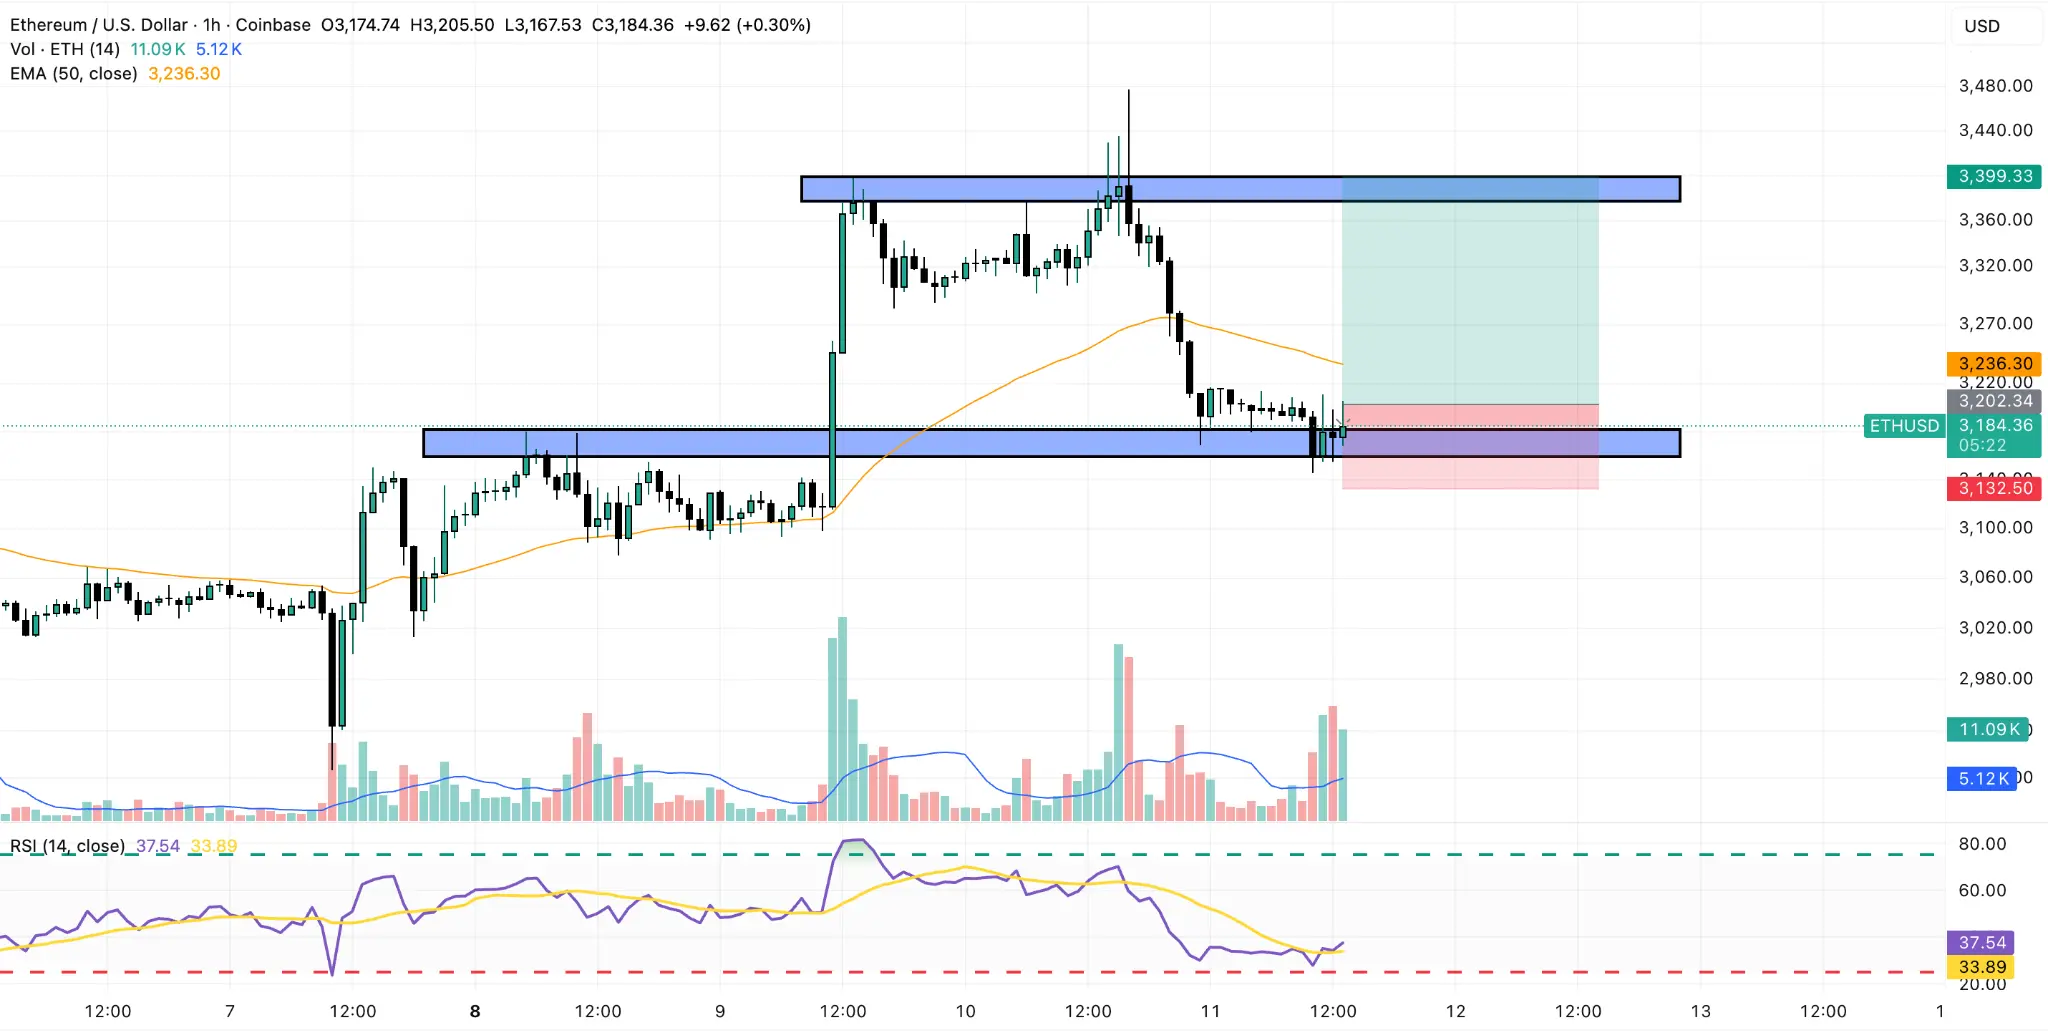
(Source: Trading View)
Switching to a lower timeframe, we see the same pattern re-emerging on the hourly chart. The price retraced, reaching the previous high of the upward trend, testing the market’s bullish structure again. The Relative Strength Index (RSI) in this short-term frame just touched below 30, indicating oversold conditions. Currently, this momentum oscillator is rising above its 14-period moving average, suggesting a potential rebound.
RSI dipping below 30 is a significant technical signal. In crypto markets, RSI under 30 typically signals short-term oversold conditions, and a technical bounce can occur at any time. When RSI begins to rise from oversold territory and breaks above its moving average, it often signals a buying opportunity. The ETH hourly RSI currently shows this pattern, providing short-term bullish support.
Volume also confirms this rebound trend, having risen above average. In technical analysis, “rising price + increasing volume” is a sign of healthy upward movement, indicating genuine buying interest rather than false signals. Conversely, if price rises but volume diminishes, it often signals a false rebound. Currently, ETH’s volume supports the sustainability of this bounce.
If the price breaks above the $3,300 midpoint, the bullish outlook will be confirmed, potentially leading to a strong rebound toward $3,400. Overall, these are early signs that the selling pressure after the FOMC meeting may be ending, and ETH could be poised for a strong rally. However, traders should wait for the daily close above $3,250 to confirm the breakout. Until then, any rebound might just be a correction within a downtrend rather than a trend reversal.
