Bitcoin’s trading price today approaches $86,500, with a rare capitulation signal emerging on the technical front. Its 14-day Relative Strength Index (RSI) fell below 30 in mid-November, marking the oversold capitulation threshold monitored by traders. A chart published by global macro investor Julien Bittel shows that after the RSI dipped below 30 in the past 5 instances, Bitcoin typically rose to twice the capitulation level within an average of about 90 days.
Historical Patterns of Capitulation Signals and the 90-Day Clock
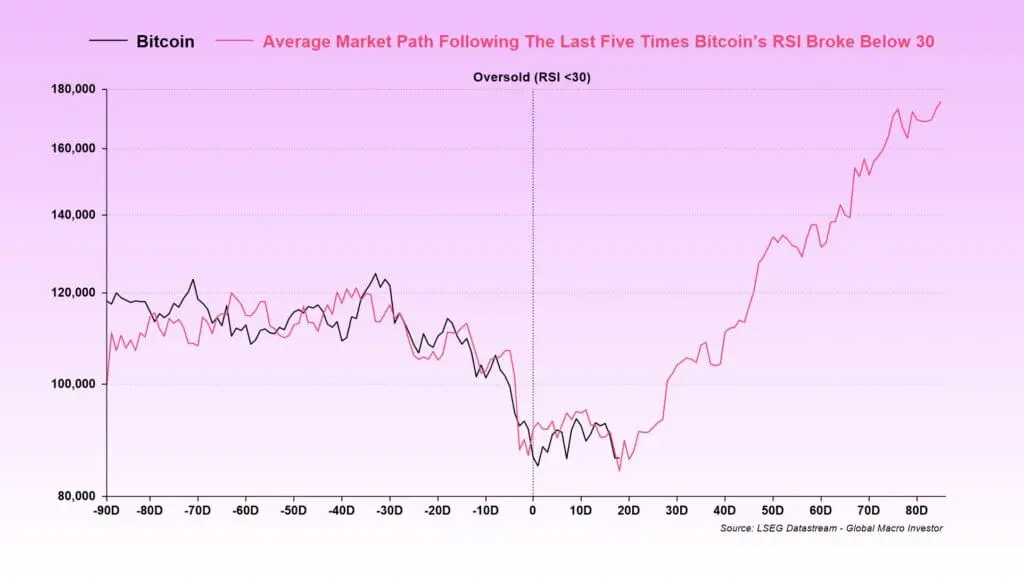
(Source: Julien Bittel)
A 14-day RSI falling below 30 is regarded as an extremely oversold signal in technical analysis, often indicating that panic selling is nearing its end. Bittel’s chart overlays Bitcoin’s recent movements with the average trajectory after the past 5 RSI dips below 30, illustrating a path that ends around 180,000 USD approximately 90 days after the oversold point.
This $180,000 target is derived based on returns. Bitcoin hit a low of about $80,697 on November 21. Reaching $180,000 after 90 days implies roughly a 123% increase. From the current $89,000, reaching $180,000 would mean a return of about 105% within roughly three months, or approximately 0.80% daily compounded.
Performance of Bitcoin After the Past 5 RSI Capitulation Events
March 2020: Post-COVID crash, RSI dipped below 30, rising from $4,000 to $11,000 within 90 days, a 175% increase.
May 2021: China mining ban triggered panic, rebounding from $30,000 to $60,000 within 90 days, a 100% increase.
November 2022: After the FTX collapse, RSI bottomed out, rising from $15,000 to $25,000 within 90 days, a 67% increase.
It is important to emphasize that this chart is not a predictive distribution but an event study average, meaning it can mask differences among these five historical paths. Actual movements may deviate, but historical patterns provide a valuable reference framework.
Bittel’s analysis suggests that Bitcoin is currently in a recovery phase similar to after capitulation. However, analyst Caleb Franzen issued an important warning: “Overbought readings in a bull market are bullish signals, but oversold readings in a bear market do not necessarily indicate bullishness.” This reminds us that RSI signals must be interpreted within a broader market cycle context.
$106,400 Critical Support/Resistance Cycle
CryptoSlate’s analysis focuses on the $106,400 level, which has repeatedly switched between support and resistance. Bitcoin has been below this level for several consecutive weeks before mid-December, which is significant for the RSI chart, because moving toward $180,000 almost certainly requires breaking through previous market turning points, not just a momentum rebound within a correction zone.
Why is $106,400 so critical? This price point is at the intersection of multiple technical factors. From a cost basis perspective, it is a concentration zone for large holdings, with many institutions and long-term holders averaging around this level. From a trend structure perspective, it was an important support during the October bull run, which turned into resistance after being broken. Psychologically, failing to hold the $100,000 mark has shaken confidence; if $106,400 cannot be reclaimed, the market may question whether the bull market has truly ended.
Another CryptoSlate report indicates that after Bitcoin reached a high of $126,223 in October, it fell to nearly $80,697 on November 21, a decline of about 36% from the high. This retracement falls within the 35% to 55% range set by the cycle framework, which predicts that if the post-halving rhythm remains dominant, the bottom area could be around $82,000 to $57,000.
From the current $89,000, Bitcoin remains near the upper end of this retracement zone. Holding above $82,000 without breaking down supports the cyclical bull logic. But if it falls below and tests $57,000, it could indicate deeper structural issues, potentially signaling the end of the four-year cycle.
ETF Capital Flows and Derivative Restrictions
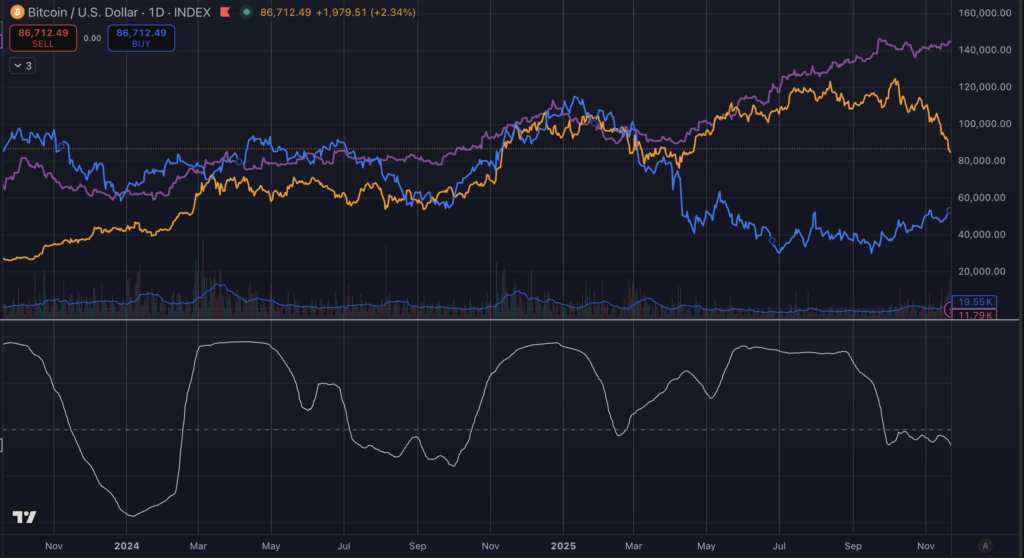
(Source: Trading View)
Capital flows are an effective cross-indicator to test whether the bullish rebound thesis for Bitcoin holds water. On November 19, as Bitcoin’s price fell below $90,000, investors withdrew a record $523 million from the BlackRock-backed iShares Bitcoin Trust (IBIT), after which ETF net inflows nearly stalled. This capital outflow indicates institutional investors lack confidence in the short-term outlook. To support the $180,000 rebound thesis, ETF capital flows must turn back into inflows.
Derivative positions add another layer of restriction. CryptoSlate reports that options traders’ gamma concentration is in the broad $86,000 to $110,000 range, which could facilitate two-way trading as hedging adjustments are made, potentially delaying trend movements until spot prices exit and follow through. This suggests that within the $86,000–$110,000 zone, Bitcoin may exhibit choppy sideways movement, making clear trend formation difficult.
According to Barchart’s technical dashboard, Bitcoin’s 14-day RSI, after falling below 30 in mid-November, has rebounded to around 40, aligning with a rebound trend. However, if capital flows weaken again, the market will remain sensitive to any new selling pressure.
The Federal Reserve is expected to cut interest rates to a range of 3.50% to 3.75% in December, and announced monthly purchases of about $40 billion in short-term government bonds to ease year-end liquidity pressures. This liquidity injection is generally favorable for risk assets. Comparing the global M2 liquidity shift over approximately 90 days with Bitcoin often explains how liquidity pulses lead to risk asset re-pricing.
MilkRoad states: “Short-term oversold signals must be interpreted within the context of liquidity and business cycles. If market conditions continue to improve and capital keeps flowing back, these oversold declines tend to recover over time, even if the process may be somewhat chaotic.”
