Date: Tue, Dec 23, 2025 | 10:20 AM GMT
The broader cryptocurrency market continues to struggle with uneven and choppy price action, a phase that began following the sharp sell-off on October 10. That correction dragged Ethereum (ETH) lower by nearly 20% over the past 60 days, keeping risk appetite subdued across the altcoin space. Pump.fun (PUMP) has not been spared from this weakness, remaining firmly under selling pressure as market sentiment stays cautious.
PUMP is now down more than 57% over the past two months, and while volatility has eased slightly in recent sessions, the daily chart reveals a technical structure that strongly favors further downside rather than an immediate recovery.
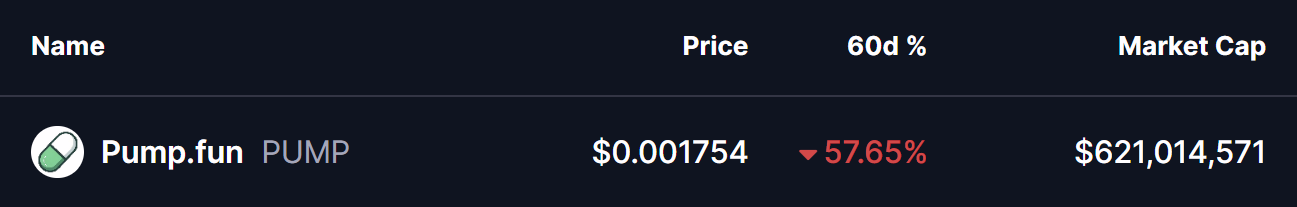
Source: Coinmarketcap
Head and Shoulders Breakdown Confirms Bearish Shift
On the daily timeframe, PUMP formed a textbook head and shoulders pattern — one of the most widely followed bearish reversal formations in technical analysis. The structure began to take shape in late August, with the left shoulder forming near the $0.004 area, followed by a sharp rally that pushed price to a higher peak, creating the head near $0.0095.
The right shoulder developed in early November, topping out around $0.00548 before momentum clearly faded. This failure to reclaim previous highs signaled growing weakness among buyers and set the stage for a breakdown.
As selling pressure increased, PUMP slid toward the neckline support near the $0.0035 zone — a level that had previously acted as a strong demand area. The chart shows that this support ultimately gave way, confirming the head and shoulders breakdown. Once price lost the neckline, downside momentum accelerated, driving PUMP toward the $0.00175 region.
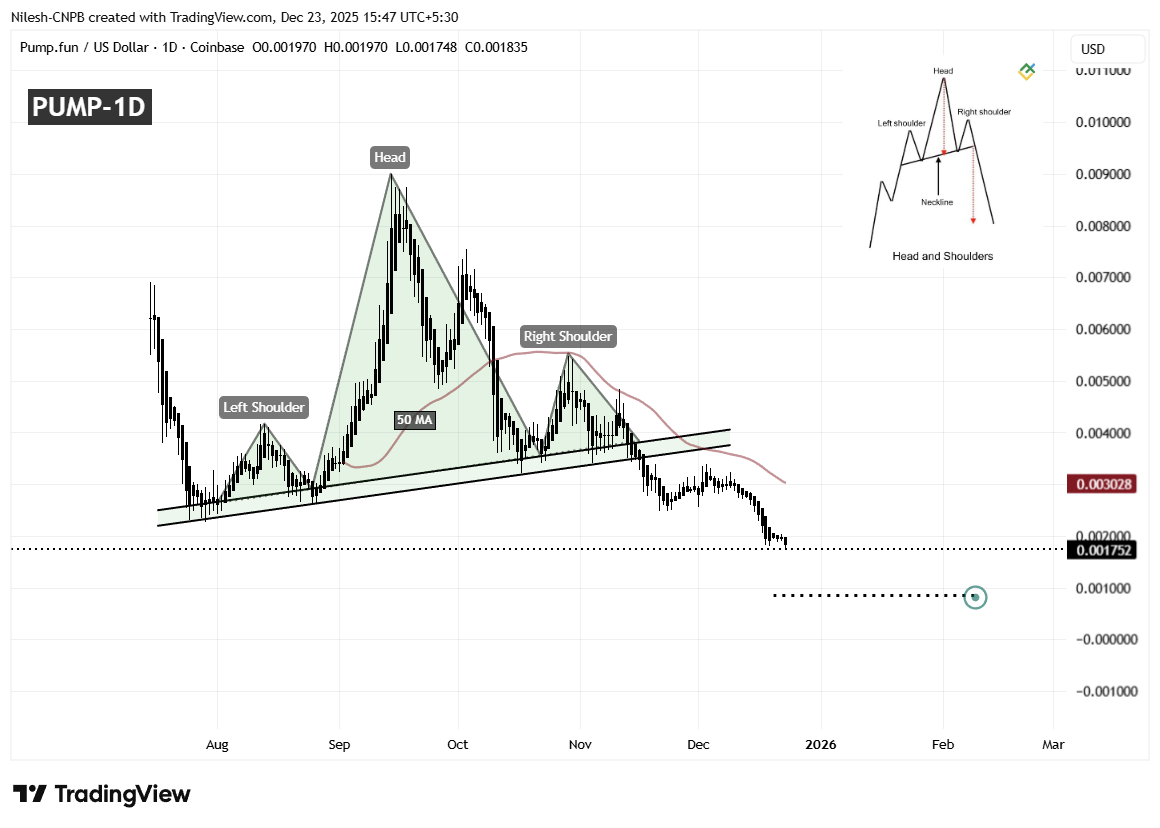
PUMP Daily Chart/Coinsprobe (Source: Tradingview)
This move represents a clear shift in market structure, with sellers firmly in control and bullish momentum largely exhausted.
What’s Next for PUMP?
With the breakdown now confirmed, attention turns to how PUMP behaves around former support levels. The $0.0035 neckline zone has flipped into resistance, and any relief bounce into this area that fails to reclaim it would likely reinforce the bearish outlook.
If downside pressure persists, the measured move from the head and shoulders pattern points toward a potential target near $0.00085. This level aligns with the projected breakdown objective and could act as a temporary pause point if selling accelerates further.
On the upside, a short-term relief rally cannot be ruled out, particularly if broader market conditions stabilize. A reclaim of the 50-day moving average near $0.003028 could trigger a bounce. However, even in that scenario, the overall structure would remain bearish unless PUMP can establish sustained acceptance above this level.
Until then, the trend favors caution, with sellers maintaining the upper hand and downside risks remaining elevated.
**Disclaimer: **The views and analysis presented in this article are for informational purposes only and reflect the author’s perspective, not financial advice. Technical patterns and indicators discussed are subject to market volatility and may or may not yield the anticipated results. Investors are advised to exercise caution, conduct independent research, and make decisions aligned with their individual risk tolerance.
Disclaimer: The information on this page may come from third parties and does not represent the views or opinions of Gate. The content displayed on this page is for reference only and does not constitute any financial, investment, or legal advice. Gate does not guarantee the accuracy or completeness of the information and shall not be liable for any losses arising from the use of this information. Virtual asset investments carry high risks and are subject to significant price volatility. You may lose all of your invested principal. Please fully understand the relevant risks and make prudent decisions based on your own financial situation and risk tolerance. For details, please refer to
Disclaimer.
Related Articles
Bitcoin Breaks Crucial Neckline Area of Bullish Pattern, Analysts Prepare for $50,000 BTC Prices
Bitcoin breaks crucial neckline area of bullish pattern.
This has sent analysts into a bearish frenzy, expecting lower prices.
The price of BTC is expected to hit targets between $48,000 and $55,000 next.
The crypto community continues to watch price charts closely to determine what
CryptoNewsLand17m ago
We Asked 2 AIs: What Must XRP Do to Escape the Ongoing Crisis?
Alongside the rest of the crypto market, Ripple’s cross-border token tried to break out in the middle of the business week, surging to a monthly peak of over $1.60. However, the subsequent rejection pushed it south to under $1.50 as of press time.
Even the most recent developments on the Ripple
CryptoPotato18m ago
Bearish sentiment builds in crypto as volatility and hedging rise
The crypto market exhibited signs of volatility on Tuesday, with bitcoin BTC$66,223.90 spiking to $68,300 shortly after midnight UTC before tumbling back to $66,500.
The initial spike was spurred by reports that U.S. President Donald Trump was willing to end the war in Iran without the Strait of
CoinDesk46m ago
Stablecoins grow faster than expected as more new applications emerge
Stablecoin is experiencing faster growth than expected, driven by new applications like AI payments. However, Standard Chartered maintains its forecast of a $2 trillion market cap by 2028.
TapChiBitcoin1h ago
PI Network (PI) Price Predictions for This Week
PI Network's price has corrected from $0.30 to $0.17, indicating a 40% drop. Currently, it hovers around $0.18, presenting a bearish outlook unless it surpasses $0.20. Volume remains low, suggesting indecision among sellers, while the RSI stays under 50, signaling further potential declines.
CryptoPotato1h ago
