Cardano (ADA) records a nearly 4% increase on Monday, pushing the price close to the psychological level of $0.40. Signals from the derivatives market clearly reflect an improvement in investors’ risk appetite, as open interest (OI) on ADA futures contracts, along with the number of long positions, are simultaneously increasing. On the technical side, the trend picture continues to lean positive: market momentum is being reinforced, opening up room for ADA to challenge higher resistance levels in the near future.
Increased buying position thanks to stable DEX volume on Cardano
Data from Taptools shows a significant breakout in transaction volume within the Cardano ecosystem, rising from $3.19 million on Thursday to $4.06 million on Sunday. This development indicates a notable recovery in community interest, a trend that has remained stable since Cardano launched a privacy-focused sidechain called Midnight.
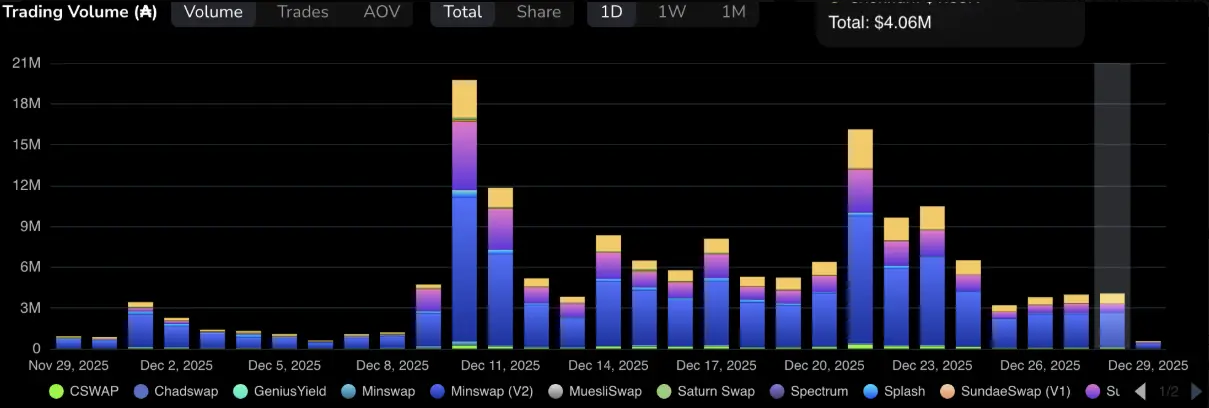 Cardano Transaction Volume | Source: TaptoolsIn the derivatives market, data from CoinGlass indicates that open contracts of Cardano futures have increased by 2.33% within 24 hours, reaching $729.41 million. This reflects a bullish sentiment among traders, with a higher risk appetite being demonstrated.
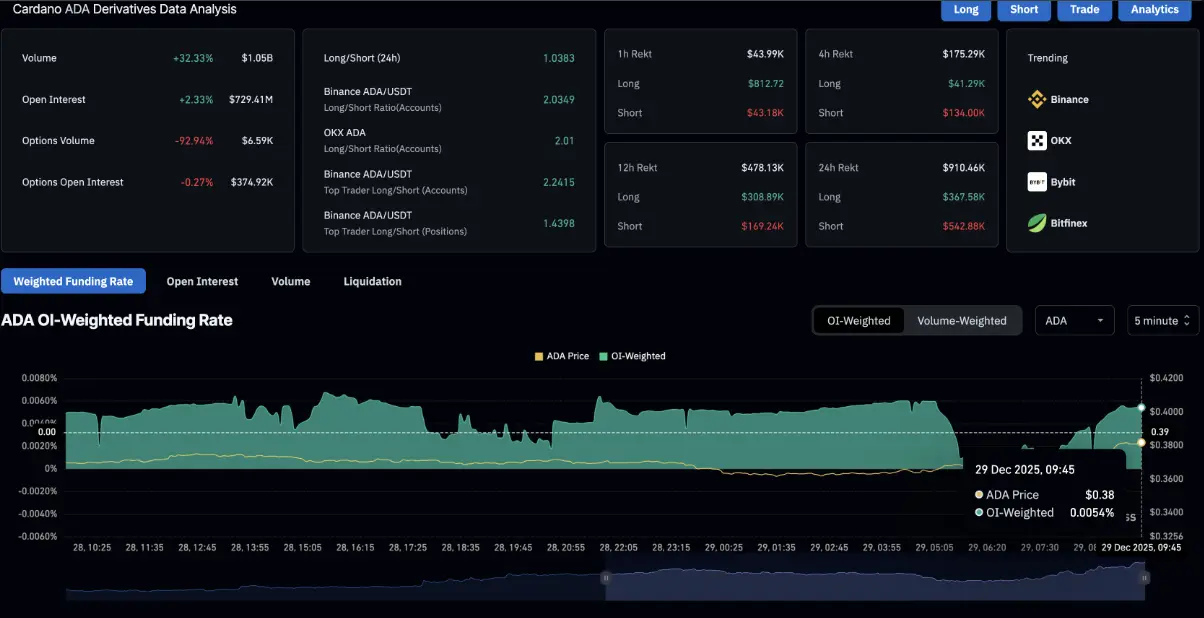 Cardano Derivatives Products | Source: CoinGlassNotably, the funding rate based on OI stands at 0.0054%, suggesting a bullish bias as traders are willing to pay fees to maintain long positions. Meanwhile, the long/short ratio increased to 54.73% on Monday, compared to 48.42% on the previous Sunday. If the accumulation of long positions continues to strengthen, Cardano is likely to enter a new bullish phase, driven strongly by leverage in the market.
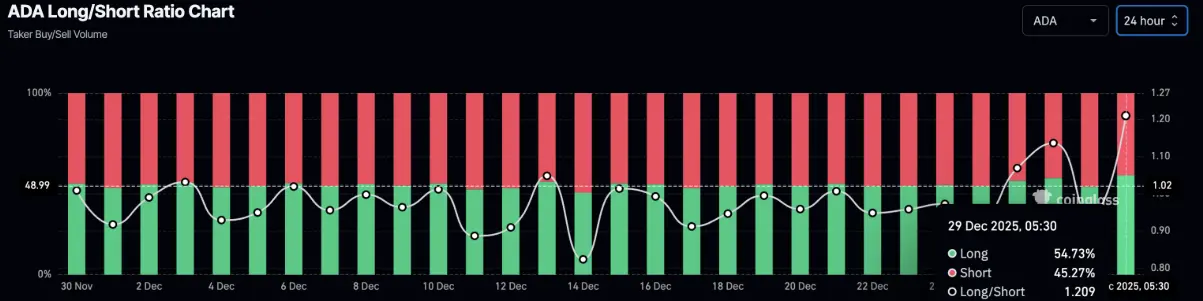 Long/Short Ratio Chart of Cardano | Source: CoinGlass## Technical Outlook: Can Cardano Break the $0.40 Level?
Cardano recorded a nearly 4% gain on Monday, continuing its recovery after a clear bullish divergence appeared on the RSI indicator, formed between the two lows on 12/18 and 12/25. The upward momentum of ADA is currently heading toward the resistance trendline established by connecting the peaks on 10/28 and 12/09, around the $0.40 level on the daily logarithmic chart.
In a positive scenario, if ADA convincingly breaks above $0.40, the price is likely to move toward the 50-day exponential moving average (EMA) at $0.4379, serving as the next resistance target.
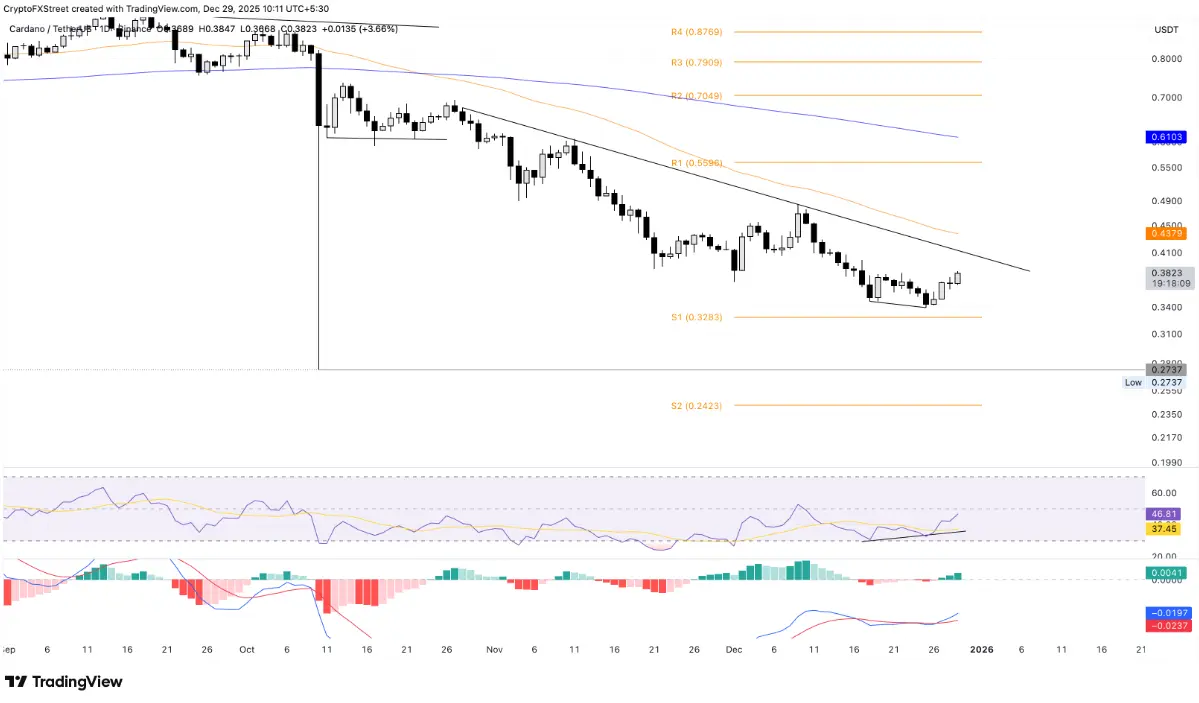 Daily ADA/USDT Chart | Source: TradingViewTechnical signals on the daily timeframe indicate that market momentum is gradually improving toward a neutral to positive outlook. The RSI indicator is currently at 46 and continues to rise toward the midline, reflecting weakening selling pressure. At the same time, MACD lines are approaching the zero line after forming a bullish cross at the end of last week, suggesting the upward trend is being reinforced.
Conversely, if ADA reverses and corrects, the S1 Pivot Point at $0.3283 could become an important support level, helping the price temporarily stabilize before facing selling pressure.
Disclaimer: The information on this page may come from third parties and does not represent the views or opinions of Gate. The content displayed on this page is for reference only and does not constitute any financial, investment, or legal advice. Gate does not guarantee the accuracy or completeness of the information and shall not be liable for any losses arising from the use of this information. Virtual asset investments carry high risks and are subject to significant price volatility. You may lose all of your invested principal. Please fully understand the relevant risks and make prudent decisions based on your own financial situation and risk tolerance. For details, please refer to
Disclaimer.
Related Articles
Bitcoin may be forming a base at $65,000 as 'paper hands' have been flushed out
Jurrien Timmer, director of global macro at Fidelity Investments, says strong earnings are helping markets absorb geopolitical shocks, despite ongoing risks.
CoinDesk14m ago
Bitcoin analysts flag triggers for a massive surge to $88,000 even as war risks linger
Key factors, such as ETF flows, macro factors and on-chain supply favor a rally in bitcoin even as war risks linger.
CoinDesk16m ago
Bitcoin hits a wall – the chart just challenged the $88,000 bull case
The price action is sending a clear warning signal that analysts' optimism may be running ahead of itself.
CoinDesk17m ago
Crypto Market Momentum – Analyzing Today’s Top Gainers and the Shift in Investor Sentiment
The cryptocurrency market is defined as highly volatile and rapidly evolving, offering a landscape in which a newly developed protocol has the potential to either succeed or fail in the span of 24 hours. Today’s market data from CoinMarketCap reveals a captivating trend: the wider cryptocurrency mar
BlockChainReporter45m ago
Exodus CEO: Retail investors at a nine-year low, institutions quietly enjoy the crypto bull market
Exodus CEO JP Richardson said that in 2026 the crypto market will see an unprecedented structural shift, with institutional investors moving in rapidly, while retail investors are absent at scale due to a cost-of-living crisis. Data shows retail activity has fallen to a nine-year low, and some funds are flowing to traditional markets. While sentiment is fragile in the short term, the outlook for the mid term is still viewed positively.
MarketWhisper2h ago
European Central Bank backs ESMA with centralized oversight of crypto regulation, and bearish signals for Bitcoin emerge
The European Central Bank has officially supported transferring regulatory authority over crypto-asset service providers to the European Securities and Markets Authority, marking an important step in the process of consolidating crypto oversight. This change is intended to unify regulatory standards, reduce fragmentation issues, and strengthen compliance requirements, but it is expected to increase the compliance burden for small and medium-sized businesses. The market reacted negatively, and confidence in Bitcoin’s price outlook declined.
MarketWhisper2h ago
