Lighter (LIT) – the underlying token of the decentralized perpetual contract exchange just launched – is still in the process of finding equilibrium after a lively startup phase thanks to the airdrop program. Although there was a slight adjustment immediately upon listing, LIT maintained a price around $2.73, with post-listing performance exceeding market expectations.
Despite new supply continuously entering the exchange, LIT’s price remains above the post-listing lows. Buying pressure has appeared, but market sentiment remains cautious and not yet confident.
The question now is: Is the current price zone truly a solid support level, or just a temporary cushion before sellers regain control of the trend?
Capital flow shows initial positive signals
Early capital flow indicators are reflecting a trend of funds returning whenever the price adjusts.
Chaikin Money Flow (CMF) – a measure of large capital inflows or outflows based on volume pressure – has shown an upward trend on the 15-minute chart, even as prices dipped slightly from December 30–31. This is a significant bullish divergence, indicating large investors are quietly absorbing supply as the market cools down, especially amid the strong selling pressure often seen after an airdrop.
 Capital continues to flow in | Source: Lighter.XYZMoney Flow Index (MFI) – which tracks buying pressure through price and volume – also shows a similar trend: MFI continuously makes new highs while prices remain slightly down. This reflects buying activity during price dips and support from retail investors during the Lighter sell-off.
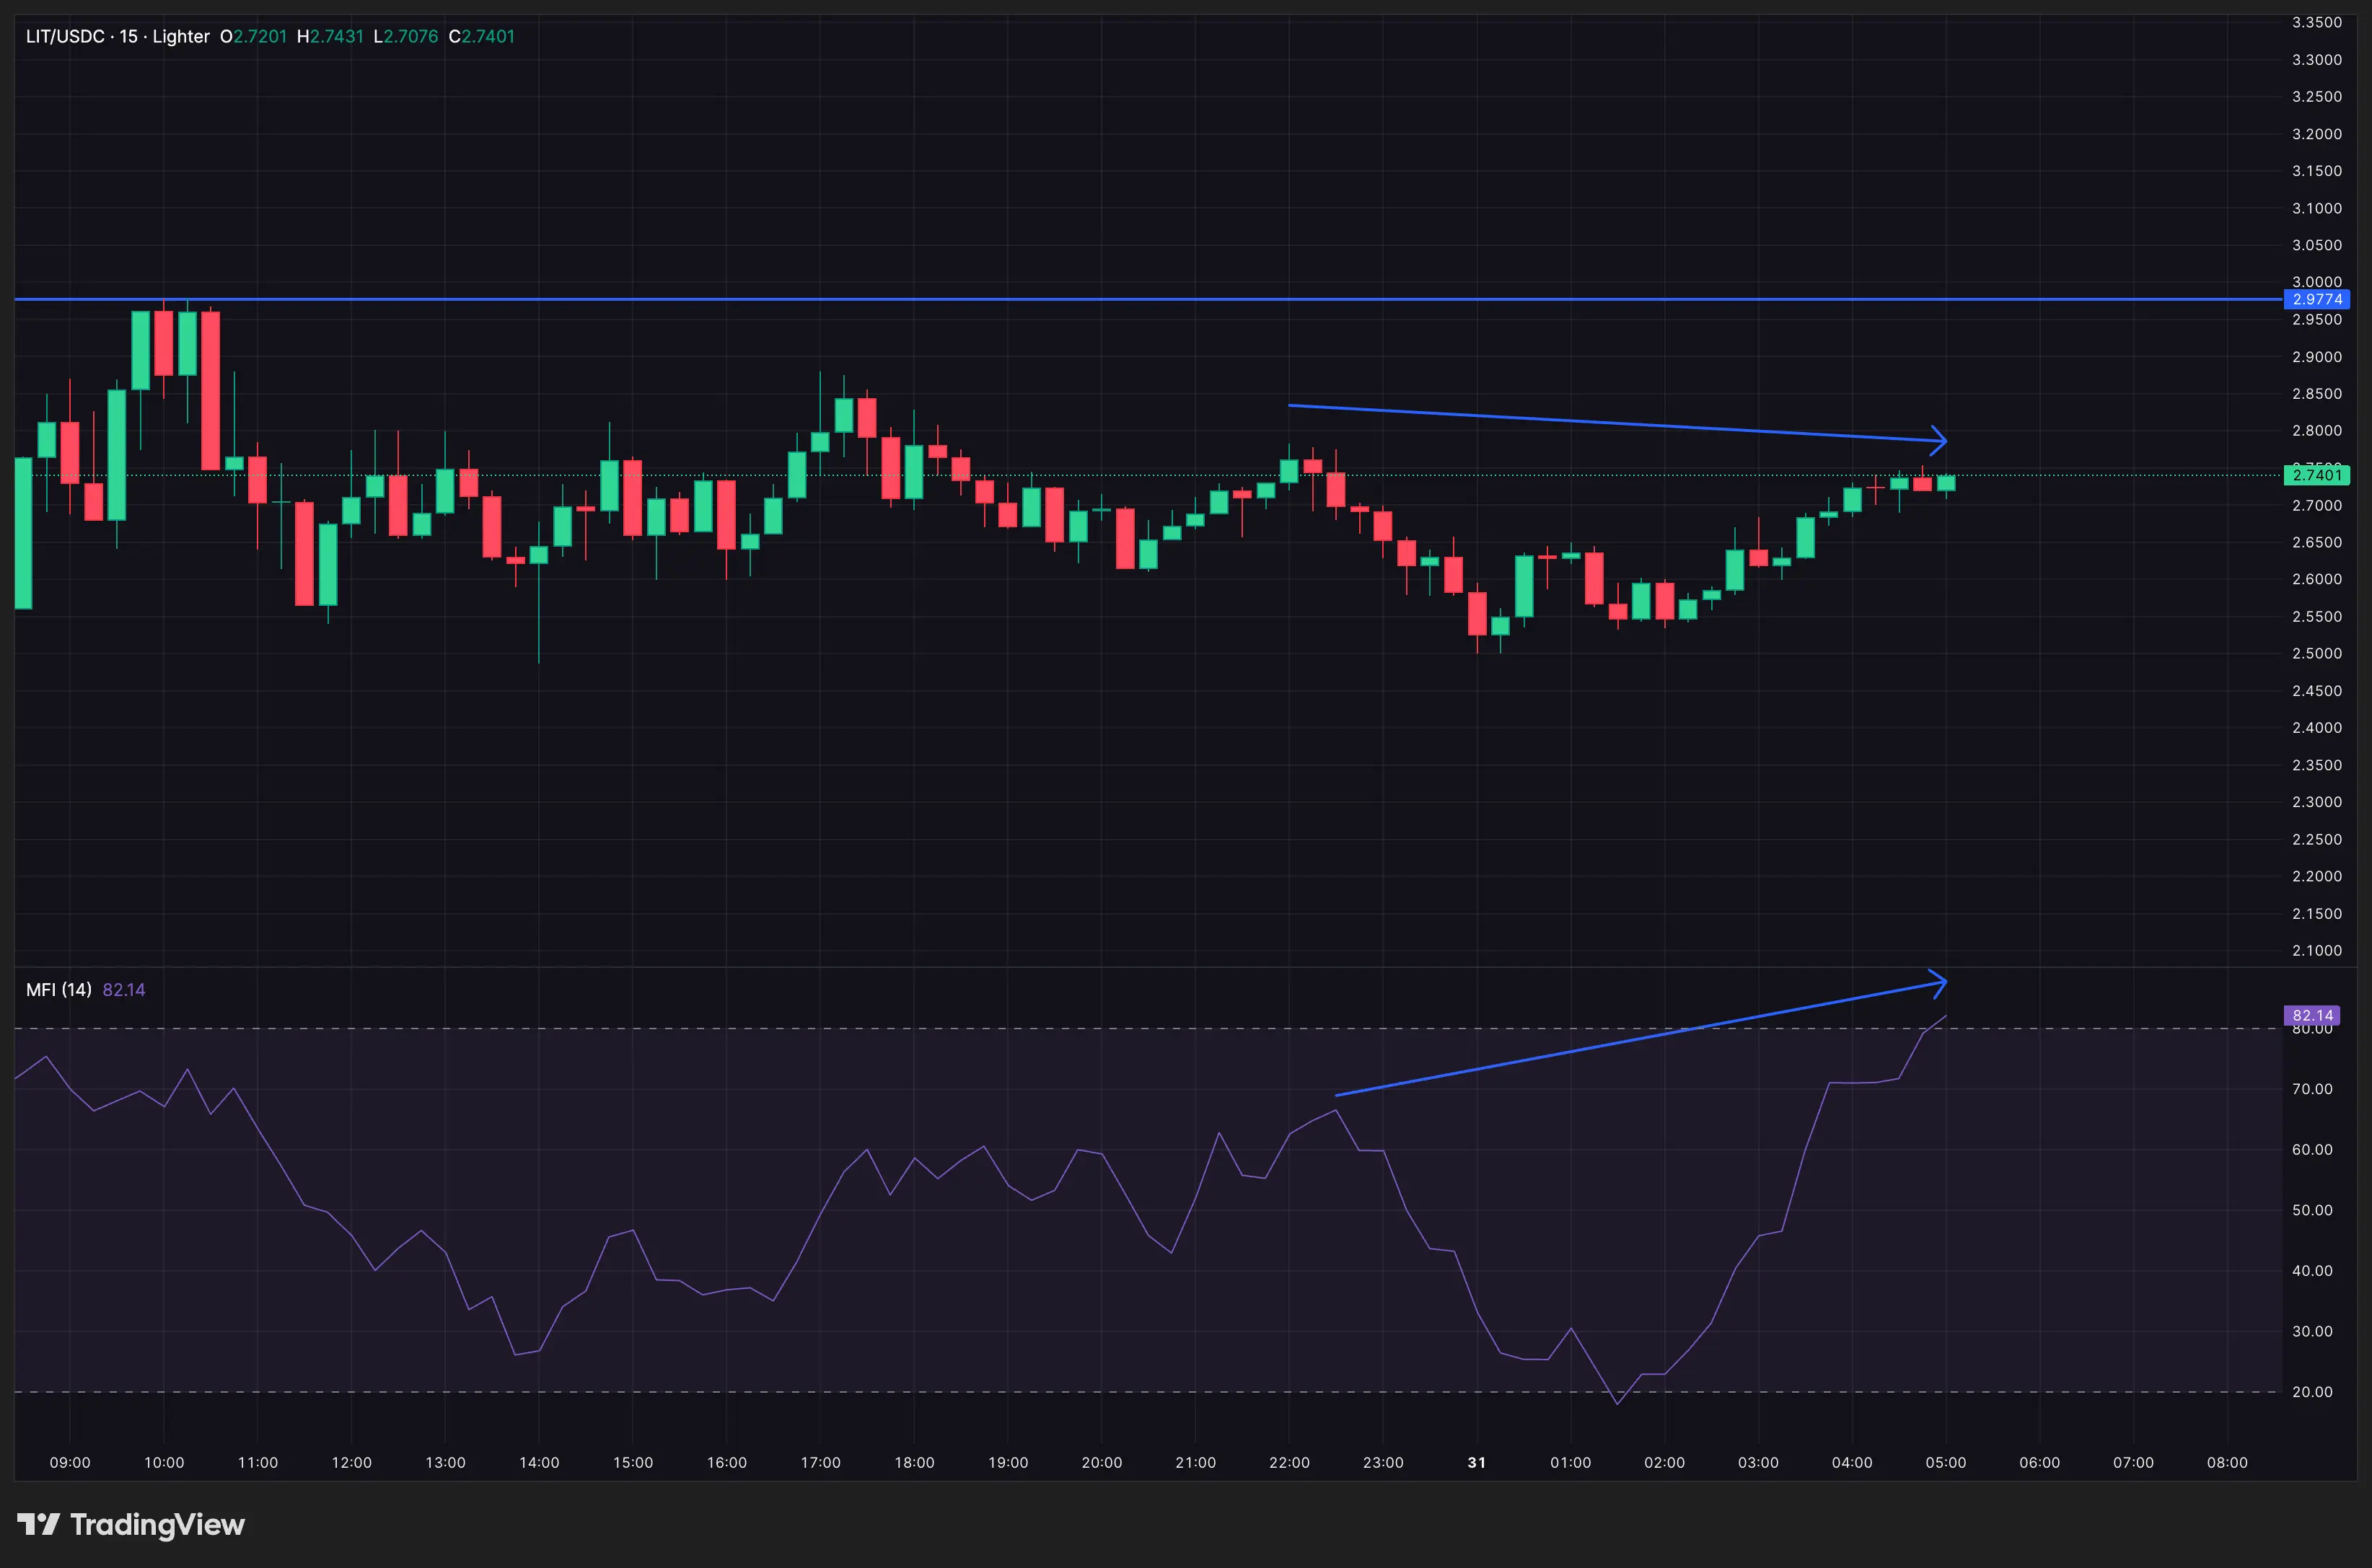 Retail investors buy the dip of LIT| Source: Lighter.XYZThe double divergence in CMF and MFI is very significant. It indicates that selling pressure from airdropped tokens is being absorbed by new capital, rather than leading to capitulation. The continuous buying by large wallets after listing further reinforces this positive signal, aligning with the upward trend of CMF.
If capital flow continues, Lighter’s price could potentially move toward higher levels.
Conversely, if CMF reverses downward below the support zone and MFI loses momentum (especially when overbought), the supporting argument will weaken.
Short-term strength: Present but needs confirmation
On shorter timeframes, the initial price structure shows areas where buying needs to be protected.
LIT is still trading above VWAP (Volume Weighted Average Price) on the 15-minute chart. VWAP reflects a fair value in real-time, and holding above VWAP signals that buyers are controlling the trend during the session. Each time the price tests VWAP around $2.62, it receives strong buying support.
This indicates that lower price zones are being actively absorbed, just as the MFI divergence predicted.
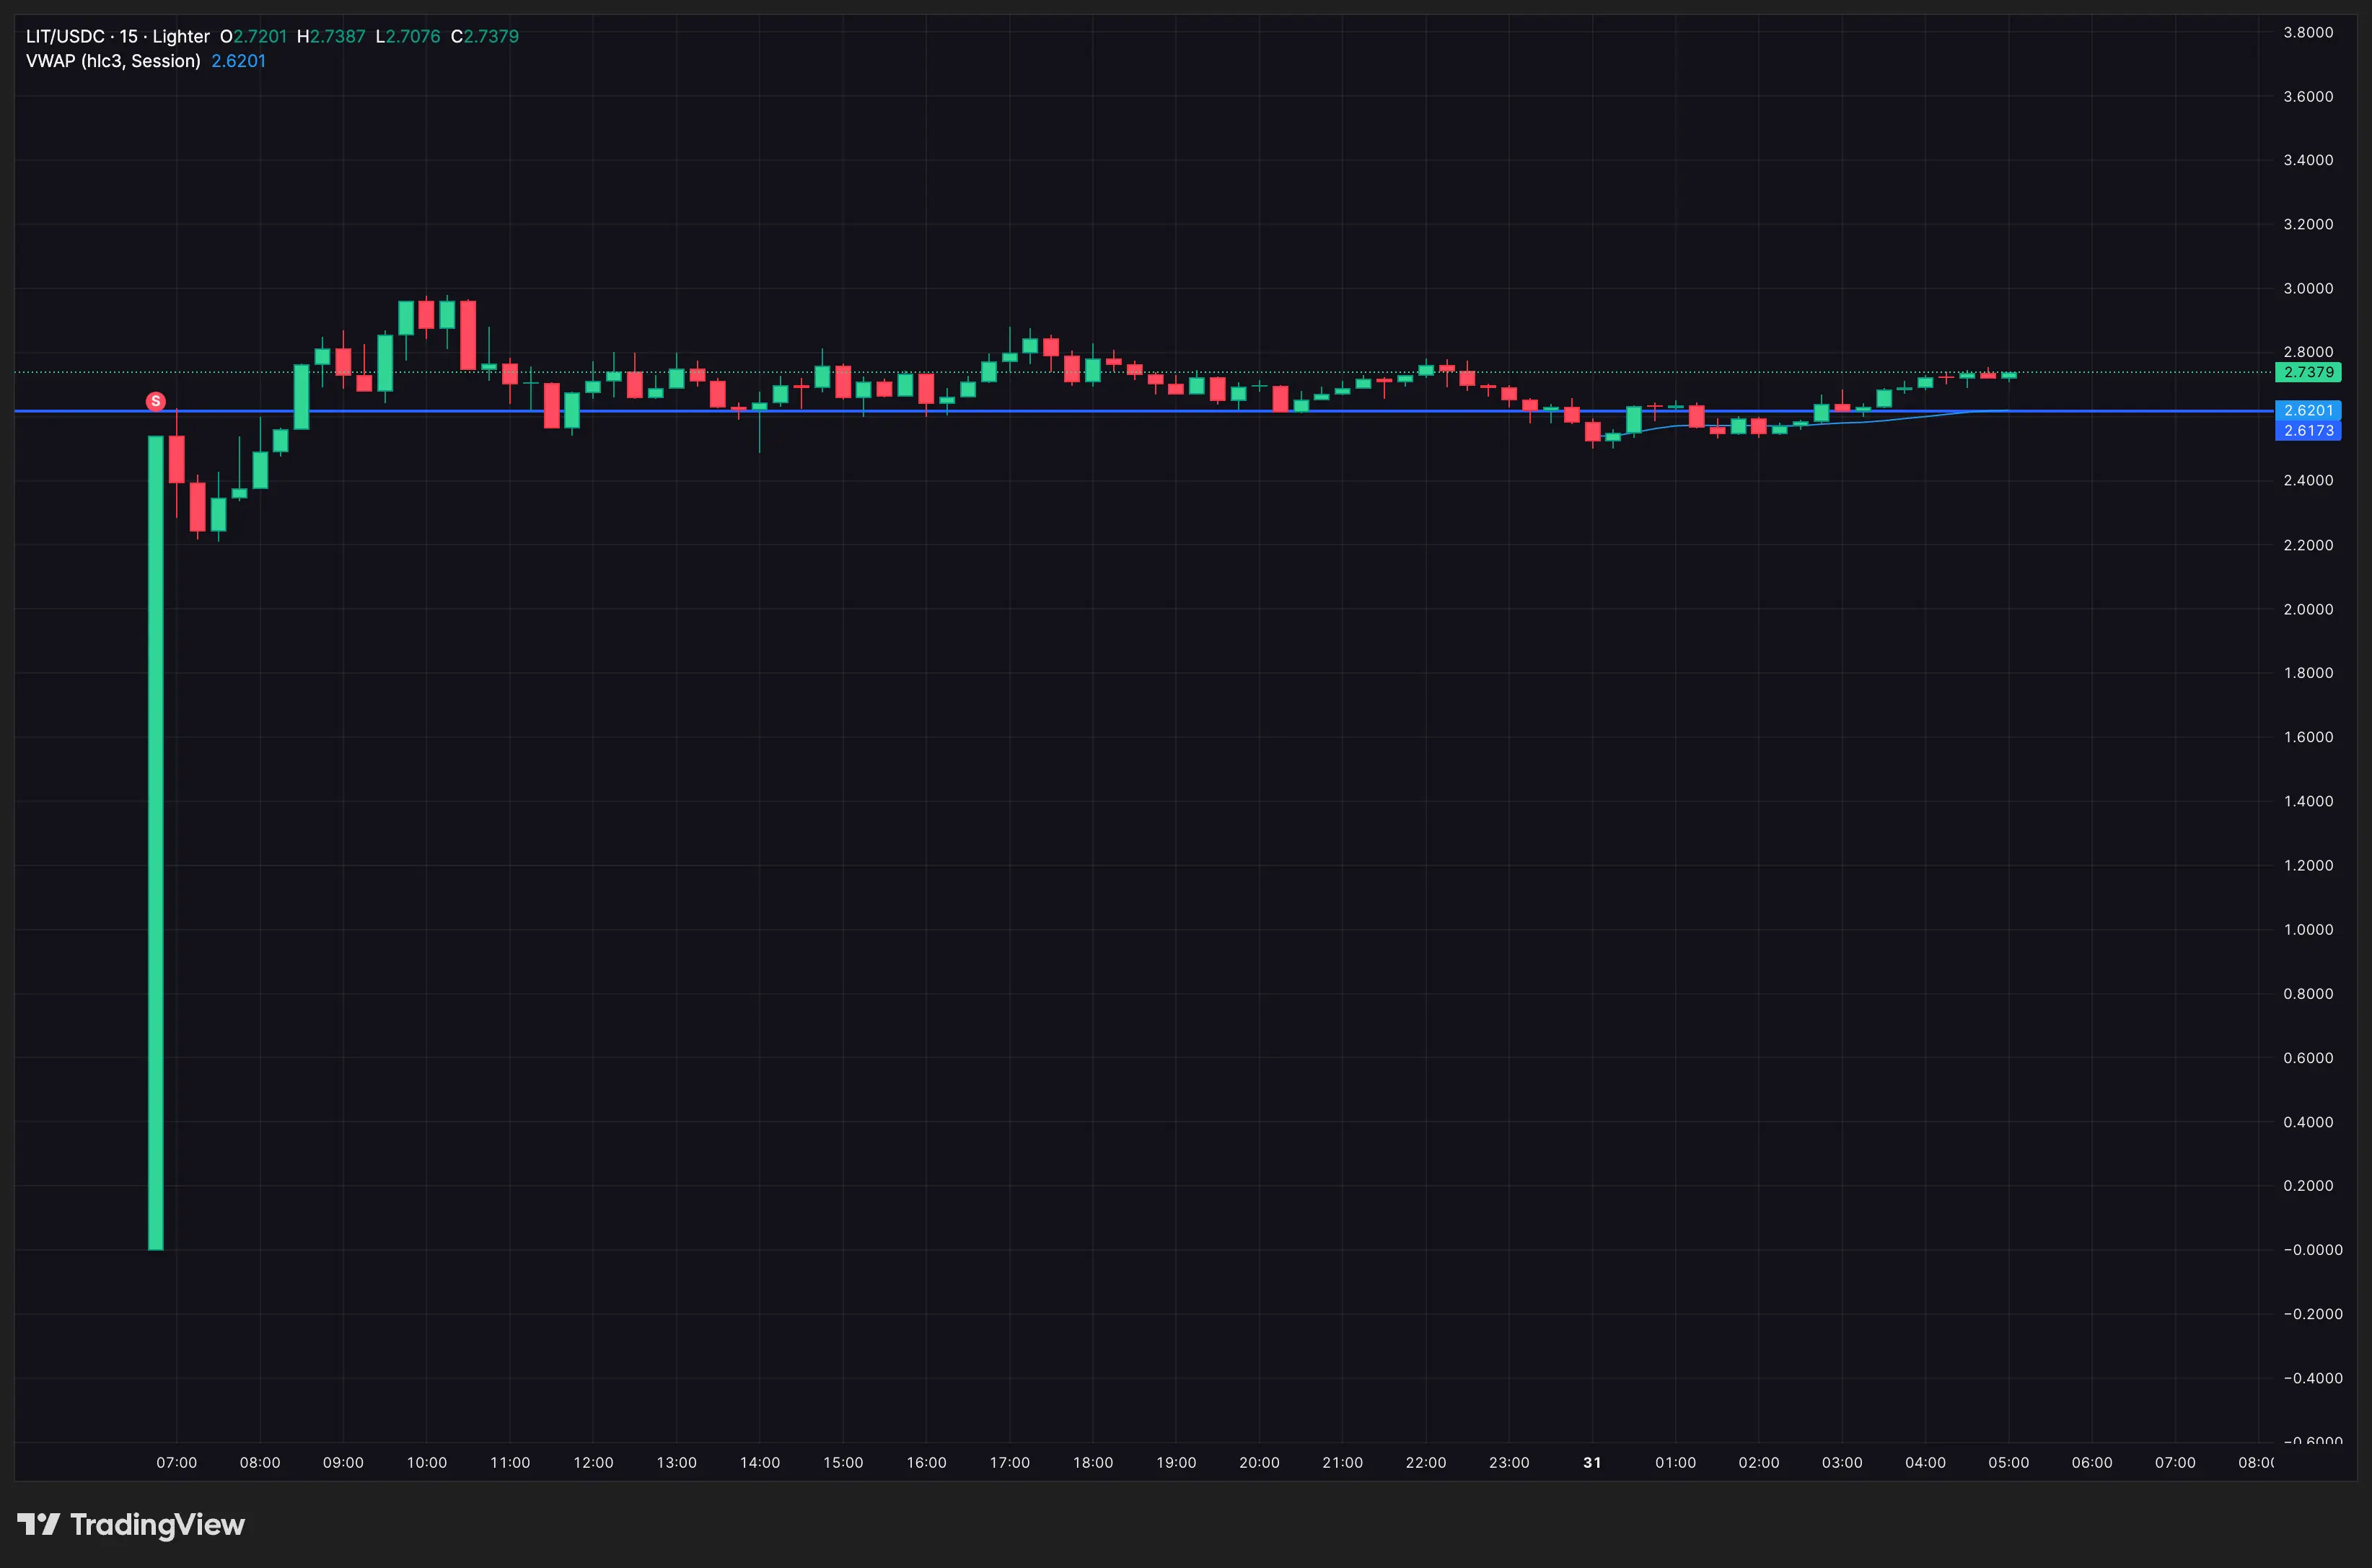 VWAP acts as support | Source: Lighter.XYZHowever, the market still lacks a crucial confirmation factor.
On-Balance Volume (OBV) (OBV) on the 1-hour chart – which measures volume flow relative to price – remains below the downtrend line. This suggests that capital inflow has begun, but trading volume has not yet fully consensus. Selling pressure from LIT is still restraining upward movement.
Until OBV breaks above the downtrend line, upward attempts may face obstacles before a true breakout.
If OBV surpasses the trendline combined with VWAP remaining supported, the price structure will shift from defensive to building a new trend. Closing above $3.08 would be the first signal that buyers are ready to conquer higher levels.
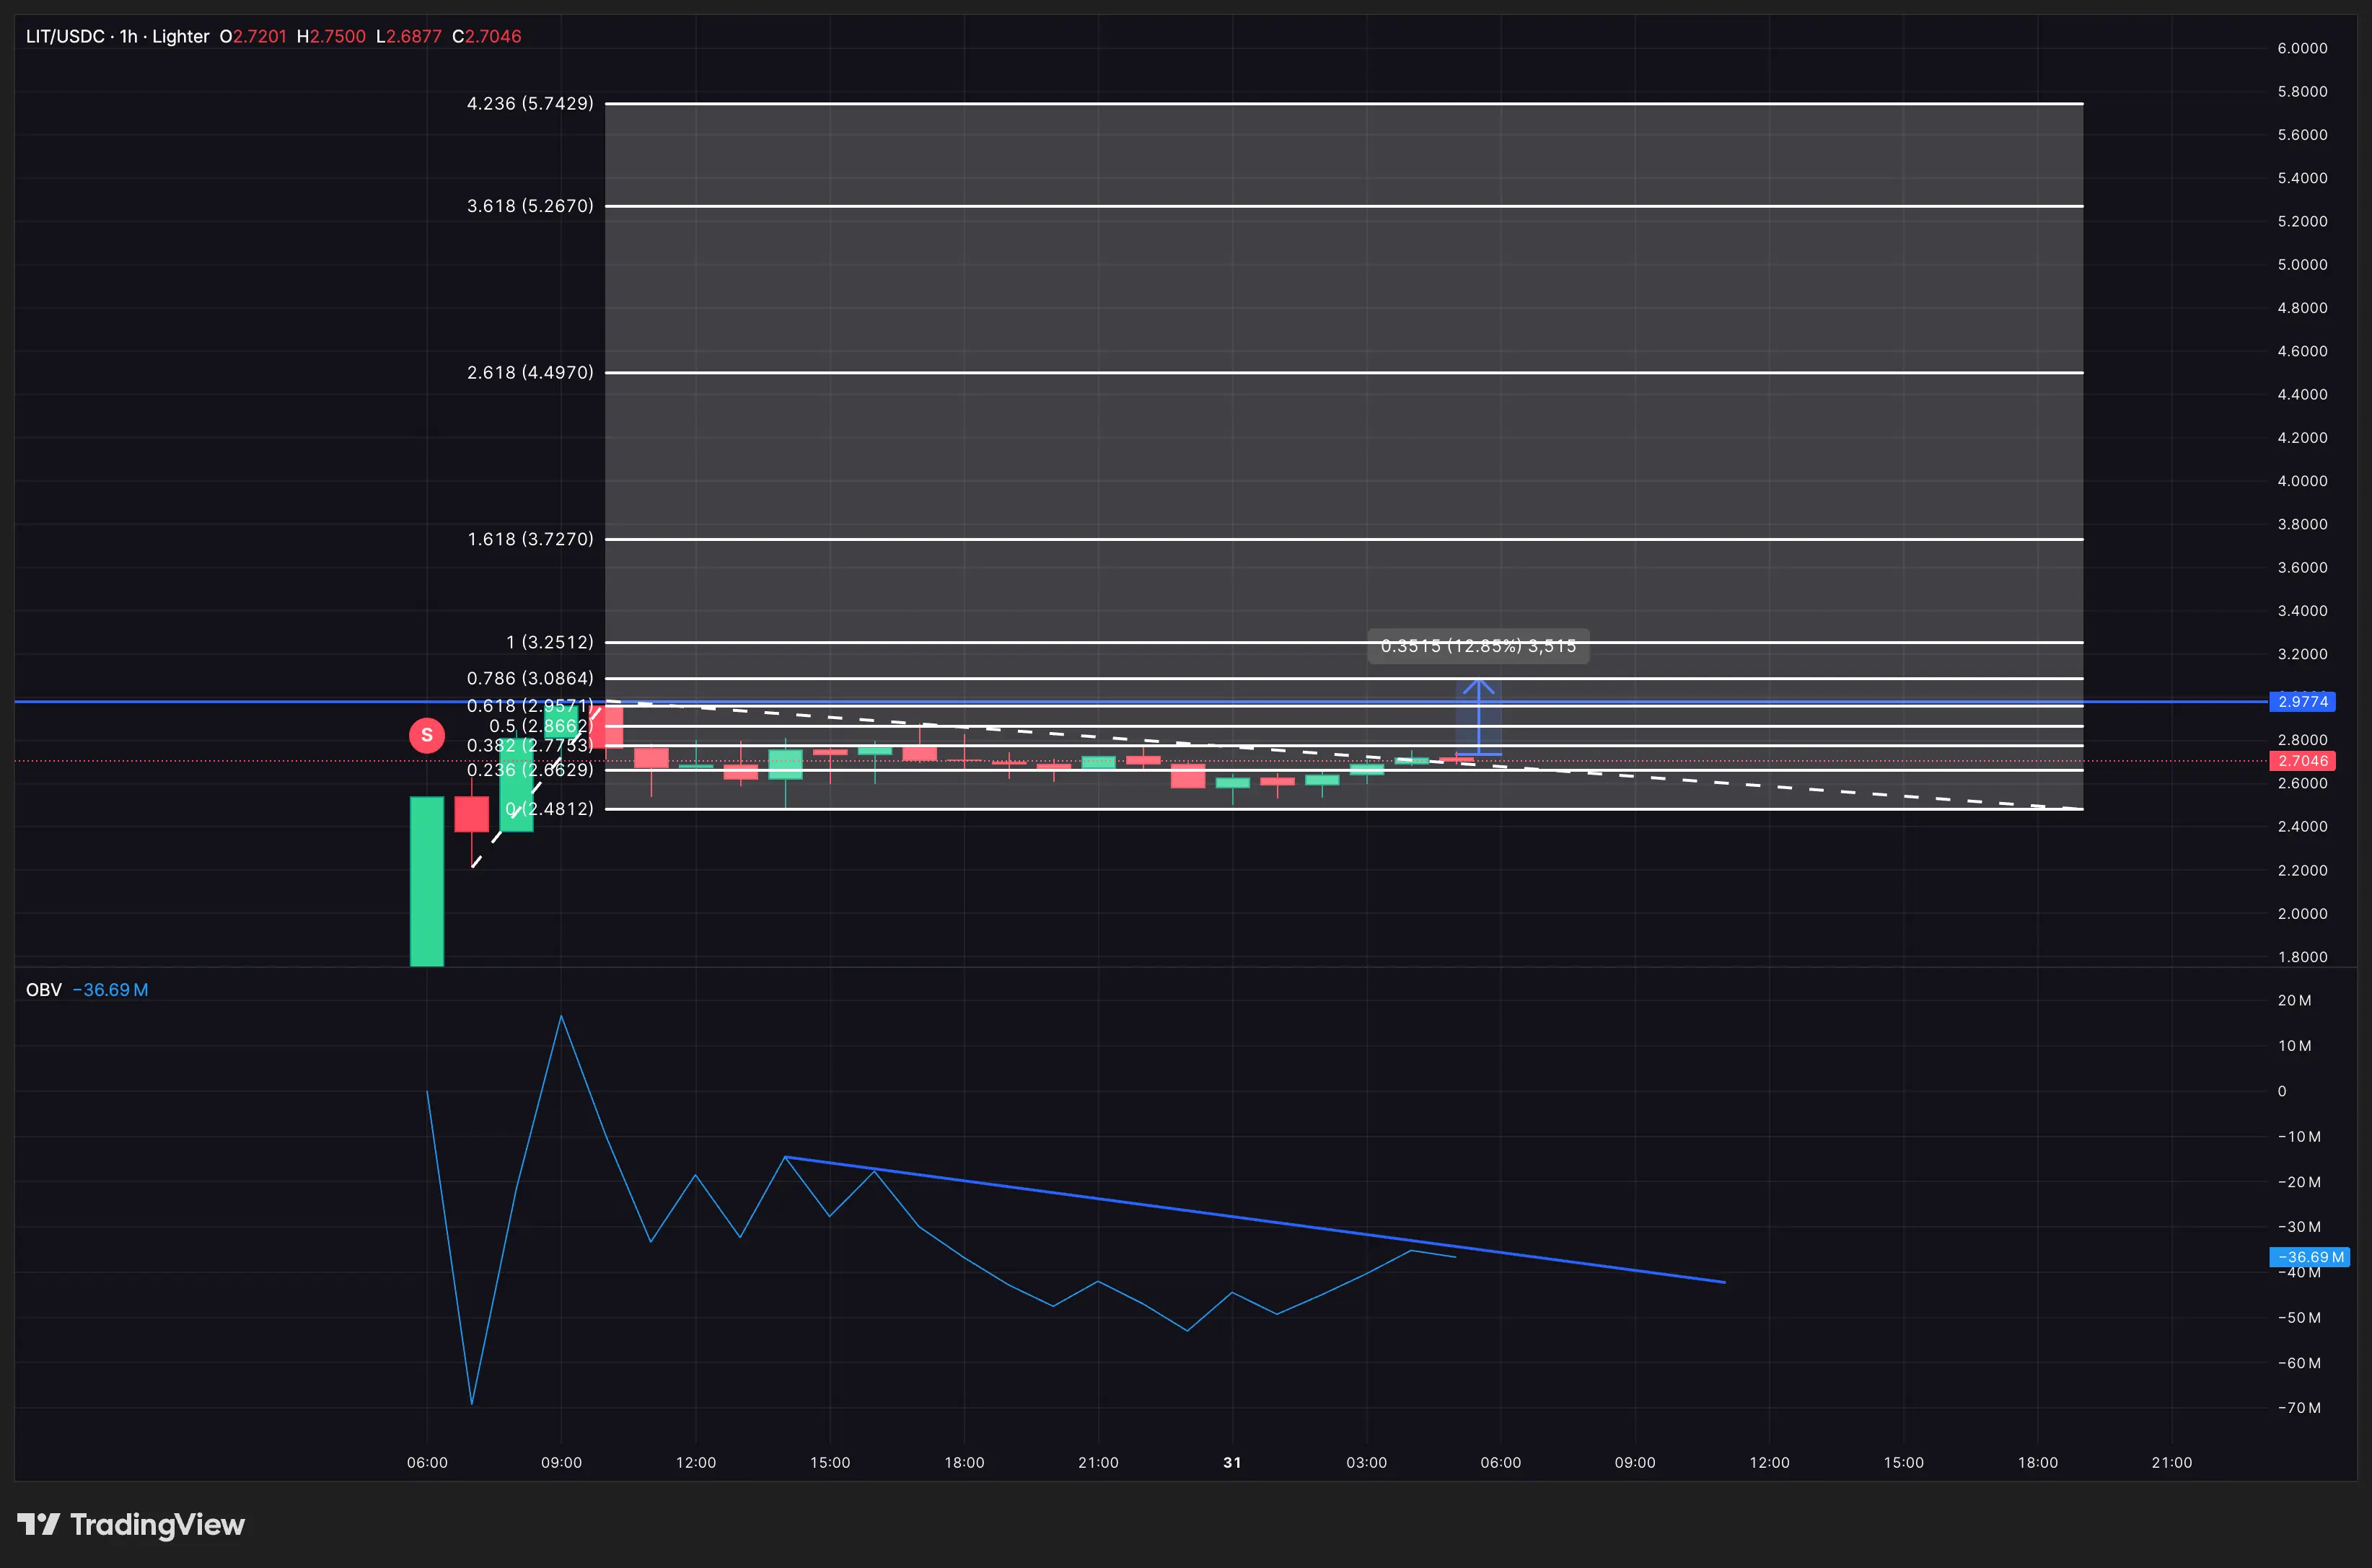 OBV confirmation needed | Source: Lighter.XYZIf sustained above this level, LIT could continue toward targets of $3.25 and $3.72 – corresponding to Fibonacci extension zones above the recent peak near $2.97.
Key price zones that will determine Lighter’s first trend
Currently, LIT is moving within a narrow decision zone, mainly trading between $2.48 and $2.77. Successfully defending the $2.62 level on lower timeframes (VWAP) and the $2.48 level on higher timeframes will maintain the bullish structure. If it breaks above $3.08 with confirmation from OBV, the chart will shift from initial support to a potentially expanding structure, and the price could reach the $3.25–$3.72 zone if trading volume supports it.
Conversely, if the $2.48 level is broken with a bearish close on the 1-hour chart, downside scenarios will emerge. If CMF and MFI turn downward and OBV remains below the trendline, the market structure will shift from support to vulnerability. Breaking below $2.48 opens the door to lower levels such as $2.38 and $2.07, especially if post-listing liquidity is withdrawn under selling pressure.
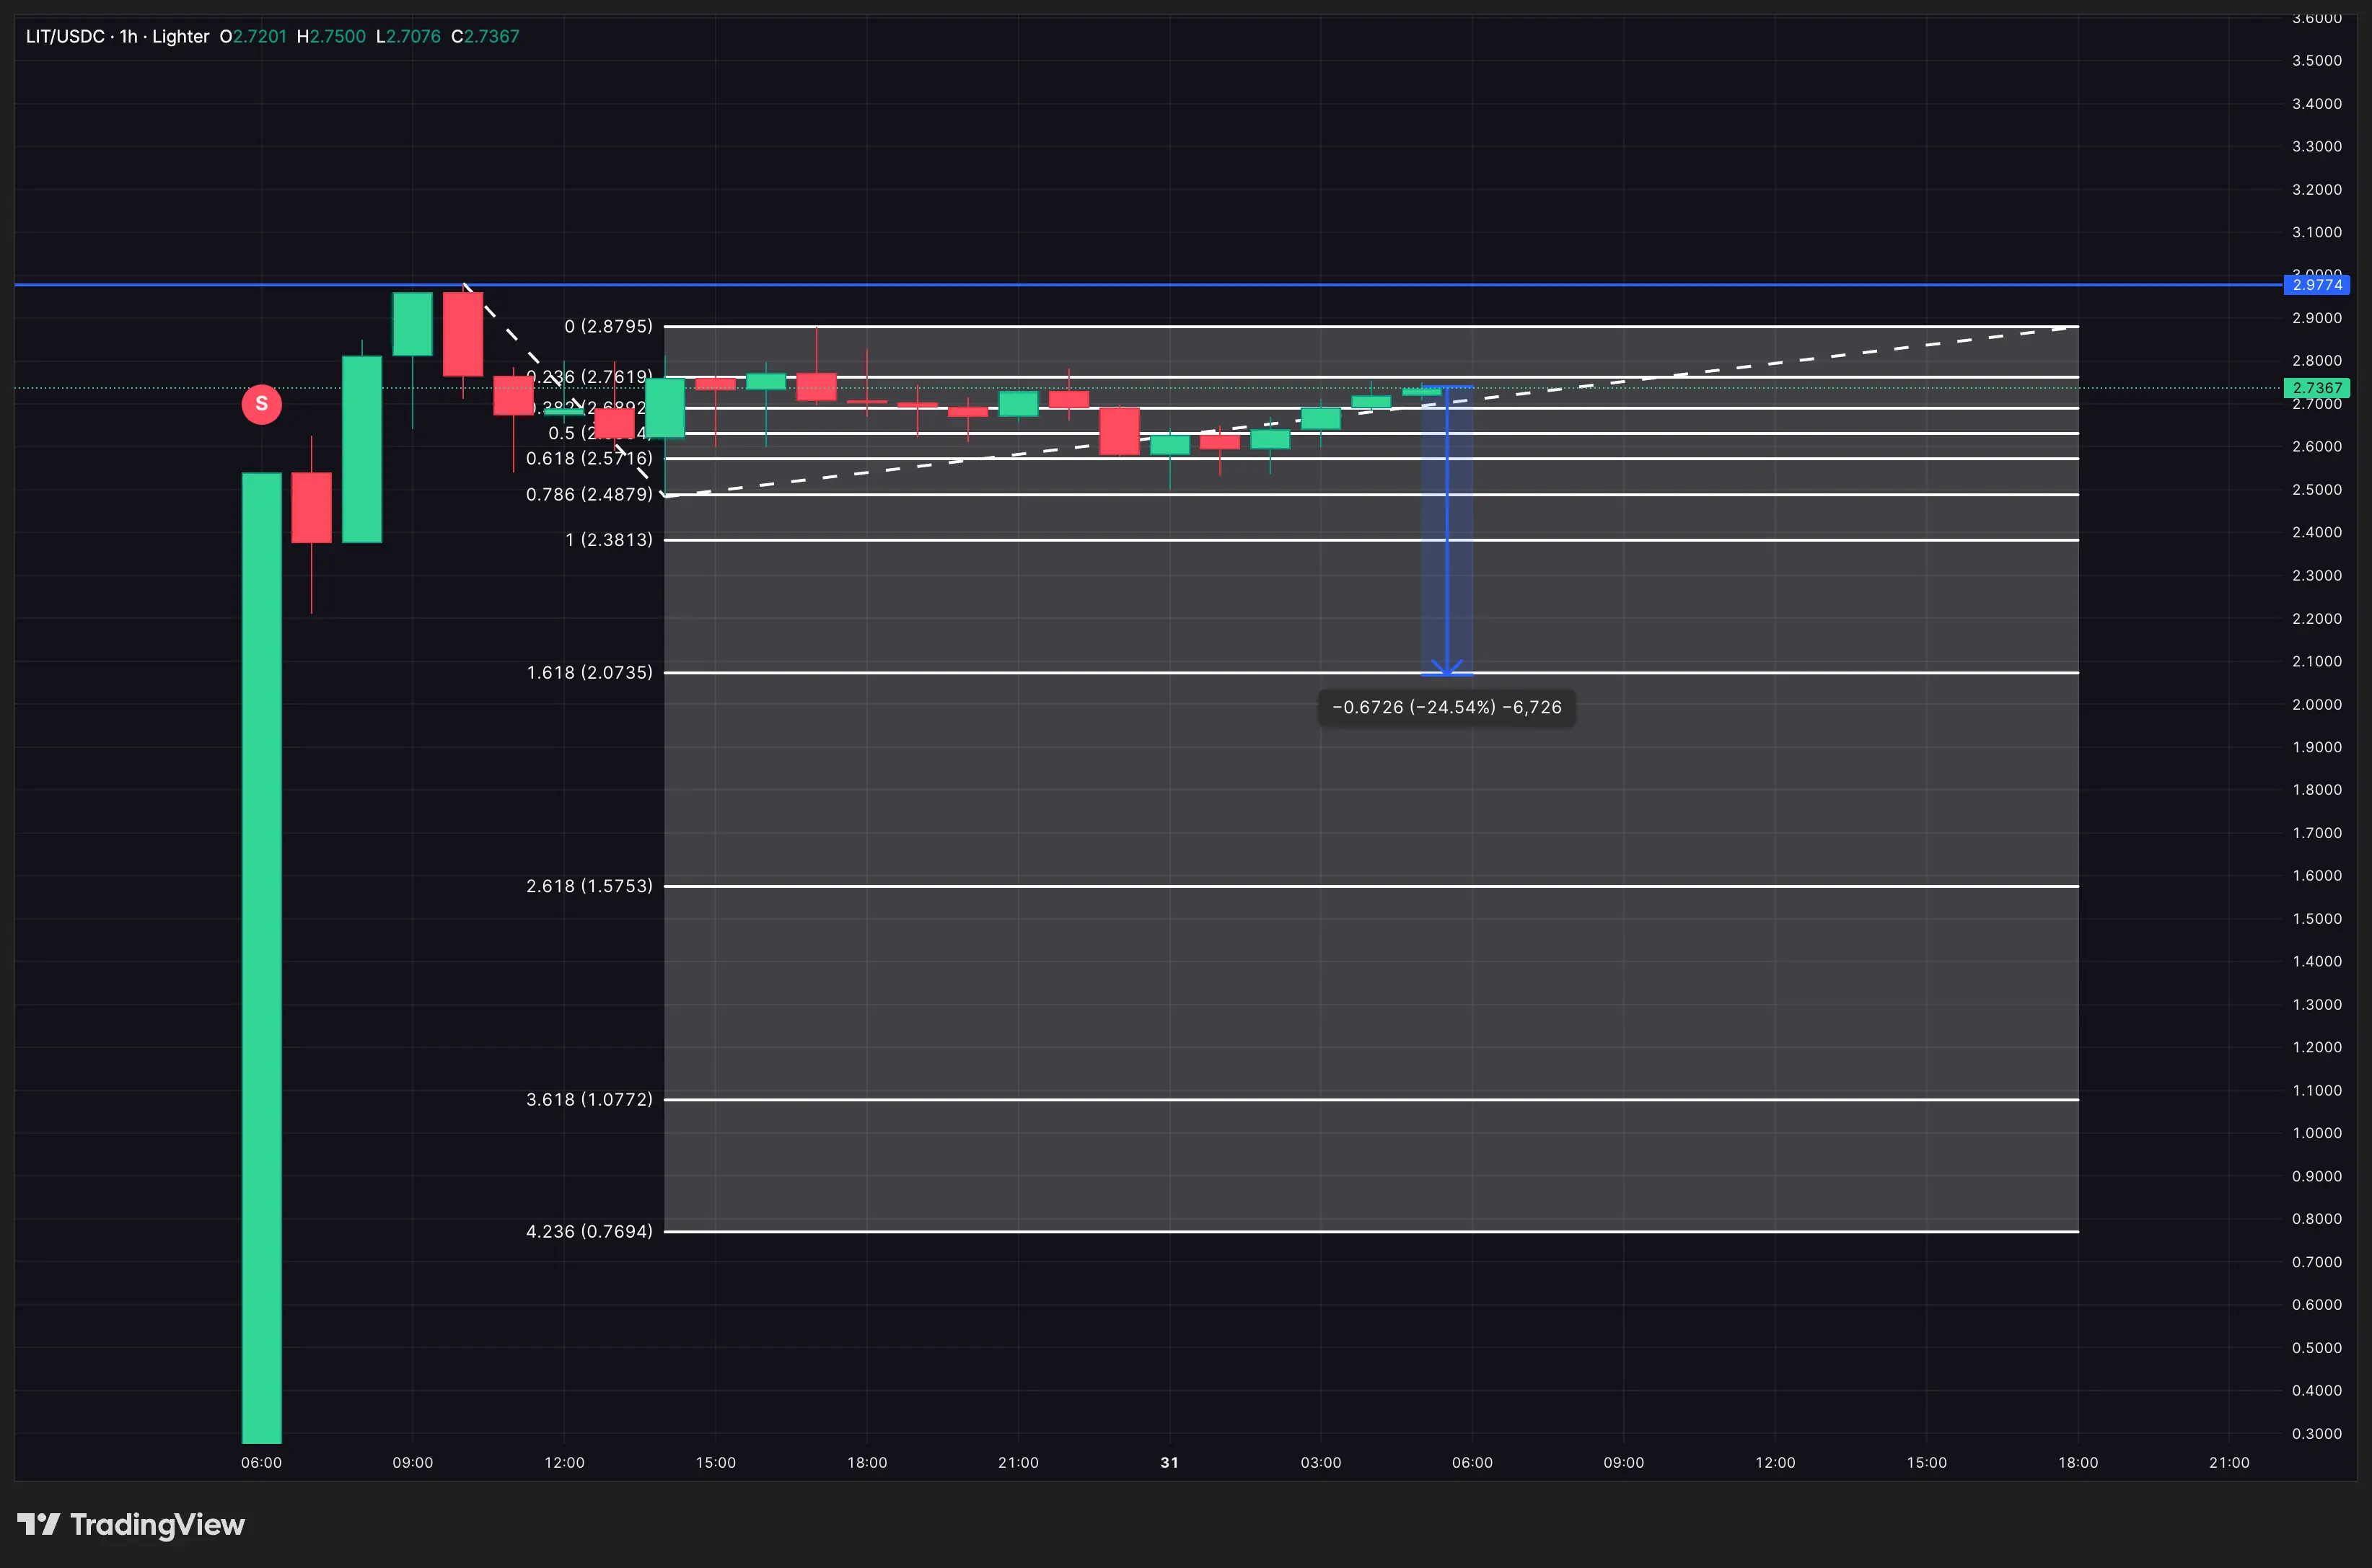 Lighter price analysis | Source: Lighter.XYZCurrently, buying pressure has appeared but is not yet dominant. The bullish scenario still relies on support indicators rather than a clear breakout structure.
Disclaimer: The information on this page may come from third parties and does not represent the views or opinions of Gate. The content displayed on this page is for reference only and does not constitute any financial, investment, or legal advice. Gate does not guarantee the accuracy or completeness of the information and shall not be liable for any losses arising from the use of this information. Virtual asset investments carry high risks and are subject to significant price volatility. You may lose all of your invested principal. Please fully understand the relevant risks and make prudent decisions based on your own financial situation and risk tolerance. For details, please refer to
Disclaimer.
Related Articles
Bitcoin ETFs 'will be larger' than gold ETFs: Analyst
Spot Bitcoin exchange-traded funds (ETFs) could surpass gold ETFs in total assets under management (AUM) as investor demand expands beyond the traditional “digital gold” narrative, according to ETF analyst James Seyffart.
“There are just more use cases of why somebody would put a Bitcoin ETF in a p
Cointelegraph5m ago
Fidelity Investments: Bitcoin testing long-term support—are bullish divergences signaling a potential base being formed?
Fidelity Investments’ chief macroeconomic officer, Jurrien Timmer, analyzes Bitcoin’s price action and believes it is finding support in the $65k to $70k range, showing strong technical signals. Bitcoin is currently at relatively low levels versus the power-law support line and the Golden Ratio Z-score, which could be setting up a bullish divergence. If it can hold steady, the market may correct and rebound, but investors need to watch out for inflation and liquidity risks.
ChainNewsAbmedia1h ago
XRP Faces Selling Pressure While Key Support Near $1.28 Holds
Key Insights:
XRP continues forming lower highs and lows, while price remains below major moving averages, reinforcing a sustained bearish structure across timeframes.
Open interest spikes during volatility signaled speculative trading, yet declining levels now reflect reduced risk
CryptoNewsLand8h ago
Cardano Price Near $0.245 Level as Market Momentum Weakens
Cardano's price is stabilizing around the $0.245 support level amid market consolidation and declining momentum. The inability to break resistance at $0.268 raises concerns about upward strength. Meanwhile, development of the new node version 10.7.0 is in testing, promising enhancements for the ecosystem.
CryptoNewsLand8h ago
Dogecoin Holds Near $0.09 as April Pattern Shapes Outlook
Key Insights
Dogecoin maintains stability above the $0.09 support, with buyers defending the level despite consistent selling pressure that limits strong upward momentum in early April trading sessions.
April performance remains historically mixed, with past rallies and declines shaping
CryptoNewsLand8h ago
Here’s why bitcoin’s drop below $68,000 raises the risk of a crash under $60,000
President Donald Trump's renewed aggressive posturing toward Iran has pushed bitcoin lower by roughly 2% over the past 24 hours to $67,000. While this price action is consistent with routine volatility, beneath the surface, market structure looks fragile.
This is mainly due to flows in the
CoinDesk9h ago
