
Date: Thu, Jan 01, 2026 | 10:30 AM GMT
As the new year 2026 begins, the broader cryptocurrency market is showing modest weakness, with both Bitcoin (BTC) and Ethereum (ETH) trading slightly in the red. This soft start has weighed on sentiment across the altcoin space as well, including Monad (MON). However, beneath the surface, MON’s chart structure is beginning to tell a more constructive story.
MON is currently down around 4% on the day, extending its 60-day decline to roughly 21%. While short-term price action remains subdued, the more important signal is emerging on the daily chart, where price structure is beginning to hint at a meaningful shift. If confirmed, this setup could mark the early stages of a bullish continuation following a prolonged corrective phase.
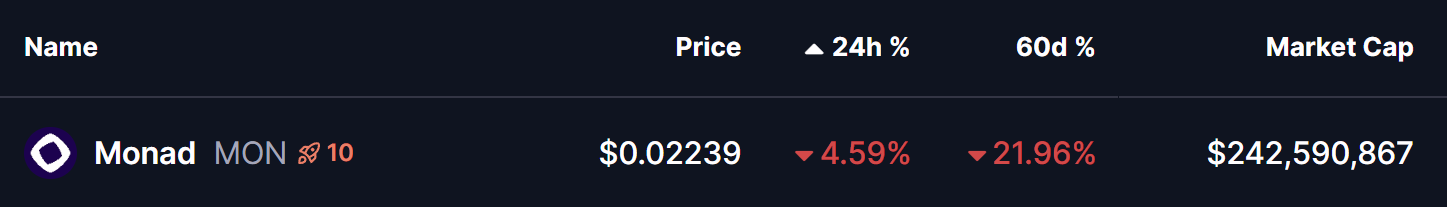
Source: Coinmarketcap
Rounding Bottom in Play
On the daily timeframe, MON appears to be forming a textbook rounding bottom pattern — a classic bullish reversal structure that typically develops after extended downside pressure. This pattern reflects a gradual transition from distribution to accumulation, where selling momentum weakens and buyers begin to step in more consistently.
Previously, MON faced strong rejection near the $0.04923 neckline zone, triggering a sharp decline that unfolded through late November and December. That move eventually found a floor near the $0.017 level, which has since acted as a key demand zone. Repeated defenses of this area prevented any deeper breakdown and helped establish a stable base for a potential trend reversal.
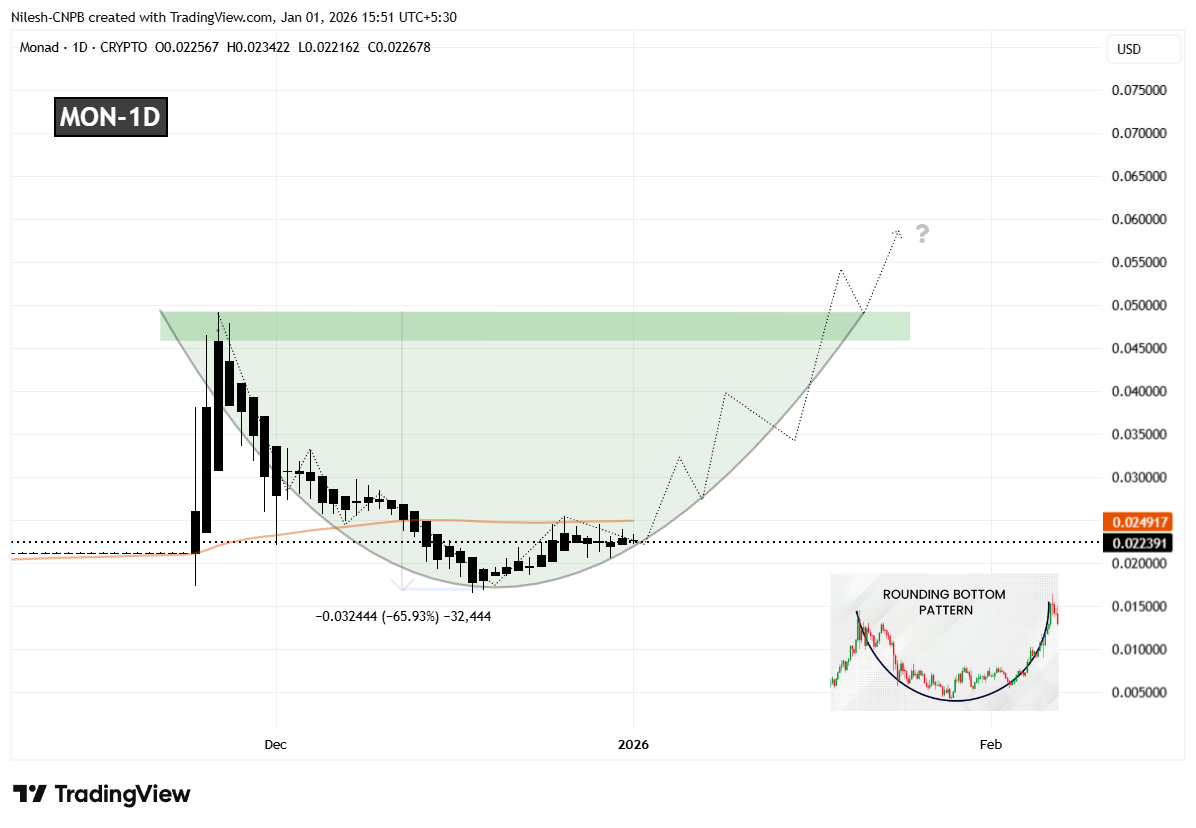
Monad (MON) Daily Chart/Coinsprobe (Source: Tradingview)
Since forming that bottom, MON has started to curve higher in a rounded fashion, closely matching the classic structure of a developing bottoming pattern. This gradual recovery suggests that selling pressure is fading rather than accelerating. The recent stabilization and recovery back above the $0.022 region further indicate that accumulation may be taking place as the market quietly prepares for a larger move.
What’s Next for MON?
For the rounding bottom pattern to move into confirmation, MON needs to reclaim the 50-day moving average, currently positioned near the $0.02491 level. A sustained move above this area would signal a shift in short-term momentum and confirm that buyers are beginning to regain control after months of corrective price action.
Looking ahead, the most significant technical hurdle remains the neckline resistance around $0.04923. A clean and decisive breakout above this zone would validate the entire reversal structure and could open the door for a broader bullish expansion phase, with momentum traders likely returning to the market.
Until those levels are reclaimed, the pattern remains in its early development stage. Short-term pullbacks or consolidation remain possible if MON struggles near the 50-day moving average. However, as long as price continues to hold higher lows above the $0.017 base, the broader bottoming structure remains intact.
Overall, MON’s emerging rounding bottom formation suggests the token may be approaching an important inflection point. While confirmation is still pending, the improving structure and alignment with a classic bullish pattern indicate that the coming sessions could be decisive for Monad’s next directional move.
Disclaimer: The views and analysis presented in this article are for informational purposes only and reflect the author’s perspective, not financial advice. Technical patterns and indicators discussed are subject to market volatility and may or may not yield the anticipated results. Investors are advised to exercise caution, conduct independent research, and make decisions aligned with their individual risk tolerance.
About Author: Nilesh Hembade is the Founder and Lead Author of Coinsprobe, with over 5 years of experience in the cryptocurrency and blockchain industry. Since launching Coinsprobe in 2023, he has been providing daily, research-driven insights through in-depth market analysis, on-chain data, and technical research.

Disclaimer: The information on this page may come from third parties and does not represent the views or opinions of Gate. The content displayed on this page is for reference only and does not constitute any financial, investment, or legal advice. Gate does not guarantee the accuracy or completeness of the information and shall not be liable for any losses arising from the use of this information. Virtual asset investments carry high risks and are subject to significant price volatility. You may lose all of your invested principal. Please fully understand the relevant risks and make prudent decisions based on your own financial situation and risk tolerance. For details, please refer to
Disclaimer.
Related Articles
Worldcoin is nearing its all-time low: the $326 million buy order failed, and $0.20 is the next target for WLD
Worldcoin (WLD) price continues to hover near its historical lows, currently at $0.2482, and the near-term trend remains weak. Despite large inflows of institutional capital such as Eightco Holdings, there are still no signs of a rebound in the market—if anything, it has intensified supply pressure. On-chain data supports the risk of selling off; once the key support level of $0.2455 is broken, it could quickly drop to $0.20. Overall, WLD faces structural pressure, and the market is focused on whether it can break through the historical low.
GateNews2m ago
Polymarket: Iran ceasefire probability is only 3%, and the surge in oil prices is hitting Bitcoin’s price trend
The expected shift around Iran ceasefire talks is toward pessimism, and the trading market shows that the ceasefire success rate set by Trump is only 3%. Iran rejected a short-term ceasefire proposal and put forward long-term political and economic conditions, further compressing the room for negotiations. Energy markets are strengthening in expectation, and the probability that WTI crude for April, which hit $120, rises to 77%. Crypto assets such as Bitcoin are under pressure during the phase when risk appetite declines, with capital flowing into traditional safe-haven assets.
GateNews8m ago
Grayscale’s New Bets: 43% of Its AI Fund Into One Coin (It’s Not NEAR or RENDER)
Grayscale increased its investment in TAO within its AI-focused crypto fund from 31% to over 43%, highlighting strong confidence in the project amid a selective approach to other AI tokens. This move may influence market sentiment around TAO.
CaptainAltcoin22m ago
Bitcoin Drops Below $69k: Trump’s Final Ultimatum to Iran Triggers Risk-Off Selling
Bitcoin fell to $685,000 on April 7, down about 2% for the day. Driven by concerns over the Middle East situation, risk-off sentiment has increased. With the market under pressure and international oil prices rising, the crypto market has faced headwinds, and investors lack confidence in a Bitcoin rebound. In the short term, macro events will continue to affect Bitcoin’s price action.
GateNews46m ago
AAVE breaks below the $100 support: DeFi sector selloff intensifies, and $80 may become the key line of defense
The DeFi market continues to face persistent pressure. On April 6, AAVE fell sharply to $84, and the current price is trading in a range around $94. Technical indicators show that bearish signals are dominant, while the fundamentals bring uncertainty due to the end of a partnership. In the short term, watch the $92 support level; $100 is a key reversal signal. The overall trend is influenced by market sentiment, so the probability of a rebound is relatively low.
GateNews50m ago
