Bitcoin ends 2025 with a daily realized volatility of only 2.24%—the lowest in the entire recorded history of this asset.
According to data from K33 Research, Bitcoin’s volatility chart has been tracked since 2012, a period during which BTC frequently fluctuated by 7.58% daily. Since then, volatility has been continuously compressed across cycles: 3.34% in 2022, 2.80% in 2024, and now only 2.24% in 2025.
However, market perception does not fully align with these figures. The sharp correction in October, when Bitcoin’s price dropped from $126,000 to $80,500, created a particularly brutal impression. On October 10 alone, a liquidation wave due to tax-related reasons wiped out approximately $19 billion in leveraged long positions in a single day.
The paradox lies in: Bitcoin is becoming less volatile by traditional measures, yet it attracts larger capital flows and generates larger absolute price and market cap swings compared to previous cycles.
Low volatility does not mean “the market is standing still.” It reflects that the market has become deep enough to absorb institutional-scale capital flows without triggering panic feedback loops as before.
ETFs, corporate treasuries, and tightly regulated custodians now serve as liquidity anchors. Meanwhile, long-term holders are gradually distributing supply into this infrastructure system itself.
As a result, daily returns have become smoother, even though market capitalization can still fluctuate by hundreds of billions of USD—a level of volatility that previously could trigger 80% crashes in 2018 or 2021.
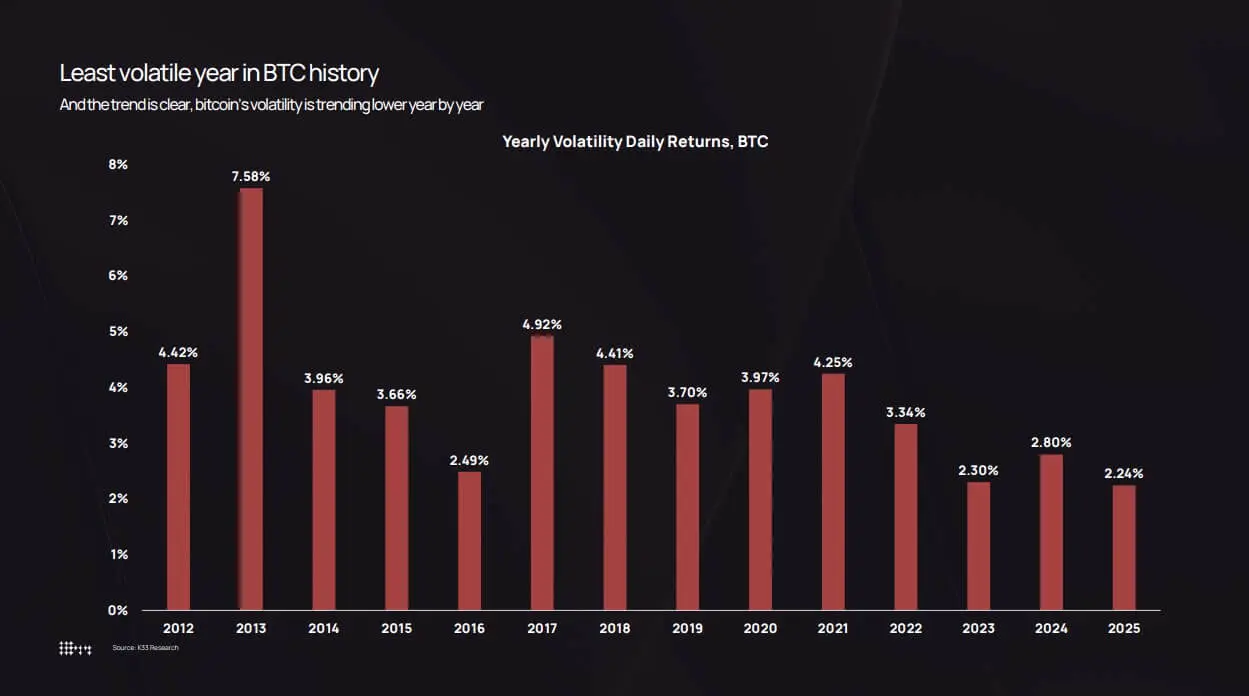 According to data from K33 Research, Bitcoin’s annual volatility has decreased from a peak of 7.58% in 2013 to a record low of 2.24% in 2025.## Bitcoin Volatility from 2012 to Present
K33 data shows Bitcoin’s yearly volatility has declined from a peak of 7.58% in 2013 to a record low of 2.24% in 2025.
In 2013, Bitcoin’s average daily return was 7.58%, reflecting thin order books and speculative frenzy. By 2017, this figure had dropped to 4.81%, then to 3.98% in 2020, and slightly increased to 4.13% during the pandemic-driven growth cycle of 2021. The collapse of Luna, Three Arrows Capital, and FTX in 2022 caused volatility to spike to 3.34%.
Since then, the compression trend continued: 2.94% in 2023, 2.80% in 2024, and 2.24% in 2025.
Logarithmic price charts also support this view. Instead of parabolic peaks followed by 80% crashes, Bitcoin from 2022–2025 has gradually moved within an upward trend channel.
Correction episodes appeared in August 2024 (bottom below $50,000) and October 2025 (reduced to $80,500), but did not trigger systemic collapses.
According to K33, a roughly 36% decline in October remains well within Bitcoin’s historical correction range. The difference is that previous 36% drops typically occurred in environments with 7% volatility, not when volatility is around 2.2%.
This discrepancy creates a “perception gap.” A 36% drop over six weeks is shocking, but compared to previous cycles—where daily volatility of 10% was common—the 2025 behavior is almost “calm.”
Bitwise even reports that Bitcoin’s volatility has fallen below Nvidia’s, repositioning BTC as a high-beta macro asset rather than a purely speculative tool.
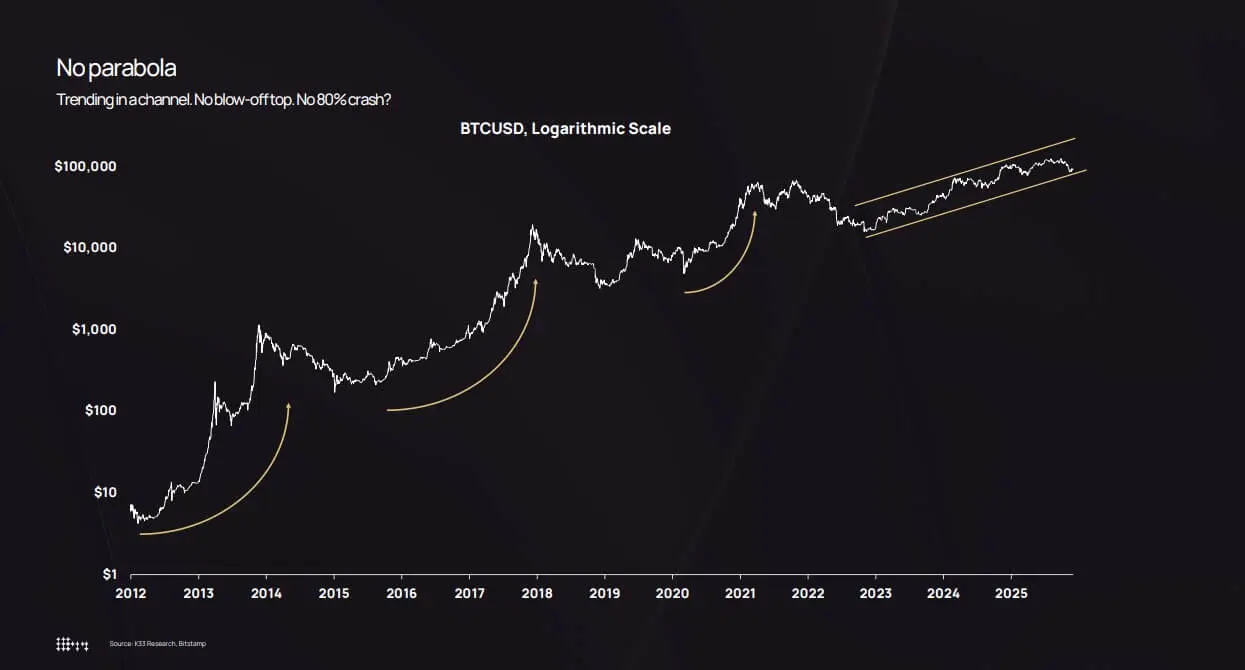 The logarithmic price chart of Bitcoin shows steady upward growth within a rising channel since 2022, avoiding the parabolic surges and 80% crashes of previous cycles.## Larger Market Cap, Institutional Infrastructure, and Supply Re-distribution Processes
K33’s core insight is: the actual reduction in volatility is not due to capital flows disappearing, but because now only extremely large capital movements can shift prices.
The three-month volatility chart shows that even in a low-volatility environment, Bitcoin still experiences fluctuations of hundreds of billions of USD.
The October–November 2025 correction wiped out about $570 billion in market cap, nearly matching the $568 billion in July 2021. The volatility range remains unchanged; what has changed is the market’s depth to absorb shocks.
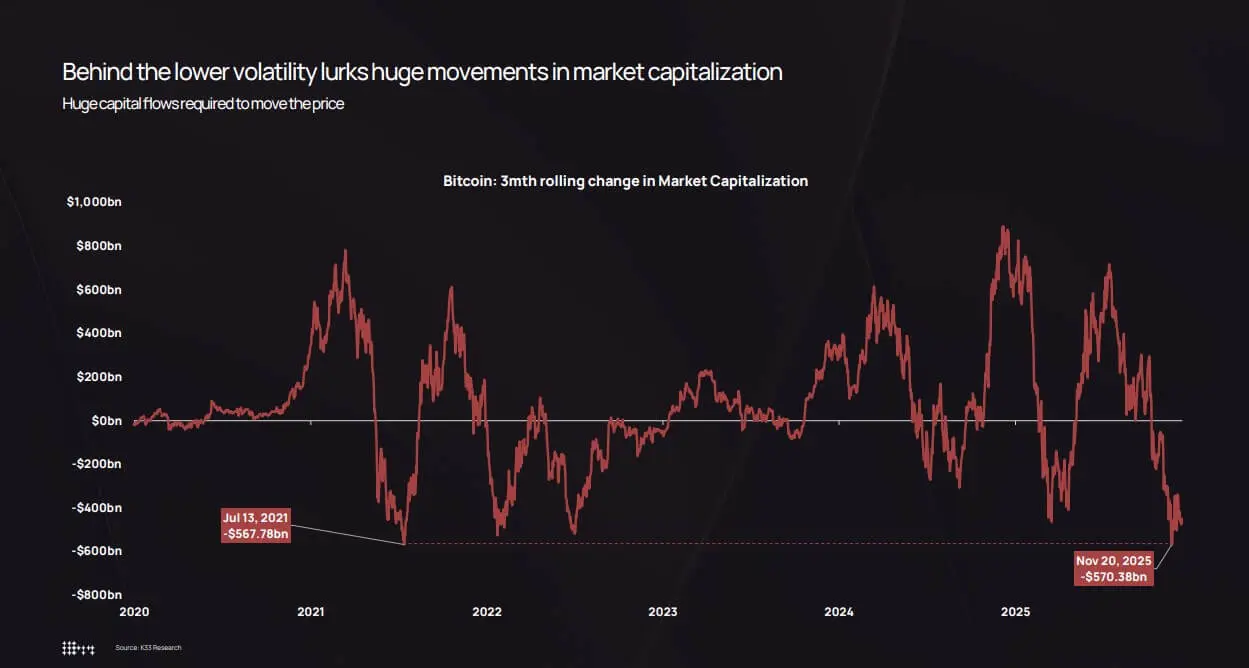 *Bitcoin’s market cap volatility over three months reached $570 billion in November 2025, comparable to the $568 billion decline in July 2021 despite lower overall volatility.*Three structural factors explain this compression.
First, absorption from ETFs and institutional investors. K33 estimates that ETFs recorded a net purchase of about 160,000 BTC in 2025, lower than over 630,000 BTC in 2024 but still significant. Overall, ETFs and corporate treasuries bought around 650,000 BTC, accounting for over 3% of circulating supply.
More importantly, these flows stem from systematic rebalancing rather than FOMO among retail investors. Even if Bitcoin’s price drops about 30%, ETF holdings decline only in single digits, with no panic withdrawals or forced liquidations.
Second, corporate treasuries and structured issuance. The total Bitcoin held by treasuries reached approximately 473,000 BTC by the end of 2025, despite slower purchasing in the latter half of the year. Increased demand mainly came through preferred shares and convertible bonds, reflecting a long-term capital structure strategy rather than trend trading.
Third, the redistribution process from early adopters to a broader investor base. K33’s supply age analysis shows that from early 2023, BTC “sleeping” for over two years has gradually re-entered the market. Over the past two years, about 1.6 million BTC of long-term supply has been redistributed.
2024 and 2025 are among the years with the largest “revival” of supply in history, including the sale of 80,000 BTC via Galaxy and 20,400 BTC to Fidelity in July 2025.
 *Bitcoin ranks near the bottom of 2025 asset performance with a -3.8% decline, lagging behind gold and equities in a year that has been unusual for this cryptocurrency.*This selling was absorbed by ETFs, corporate treasuries, and regulated custodians, who built positions over many months.
This redistribution is crucial. Early holders accumulated Bitcoin around $100–$10,000, often concentrated in large wallets. When they sell, supply disperses to ETF shareholders, corporate balance sheets, and asset management clients, each buying smaller amounts within diversified portfolios.
The result is reduced concentration, thicker order books, and weaker feedback loops. Previously, selling 10,000 BTC into thin liquidity could cause a 5–10% “gap” drop, triggering stop-losses and cascading liquidations. In 2025, the same amount of selling attracts more institutional demand, causing only 2–3% price swings.
Portfolio Structure, Leverage Shocks, and the End of the Parabolic Cycle
Low volatility forces institutions to adjust their Bitcoin allocation strategies.
According to modern portfolio theory, the allocation weight is determined by risk contribution. A 4% Bitcoin position with 7% volatility poses much higher risk than the same weight at 2.2%.
This mathematical reality creates pressure for allocators either to increase Bitcoin’s weight or to use options and structured products based on the assumption of lower volatility.
K33’s multi-asset performance comparison shows Bitcoin near the bottom in 2025, down 3.8%, underperforming gold and stocks—an unusual pattern compared to previous cycles.
This short-term underperformance, combined with low volatility, makes Bitcoin increasingly resemble a core macro asset with similar risk levels to equities but different return drivers.
Options markets reflect this shift clearly. The implied volatility of short-term Bitcoin options declines in line with actual volatility, reducing hedging costs and making structured products more attractive.
For financial advisors previously blocked from Bitcoin by compliance departments due to “excessive volatility,” 2025 provides a clear quantitative argument: Bitcoin is less volatile than Nvidia, much less than tech stocks, and comparable to high-beta equity groups.
This paves the way for Bitcoin’s inclusion in 401(k), RIA portfolios, and even insurance companies with strict volatility constraints.
K33 forecasts that net ETF capital flows in 2026 will surpass 2025 as these channels expand, creating a self-reinforcing loop: institutional capital flows reduce volatility, lower volatility unlocks more institutional investment limits, which in turn attracts more capital.
However, this “calmness” depends on conditions. K33’s derivatives analysis shows that open interest in perpetual contracts steadily increased throughout 2025 in a “low volatility, strong upward trend” environment, culminating in the liquidation event on October 10, when $19 billion in long positions were wiped out in a single day.
This sell-off was linked to President Donald Trump’s trade tariff announcement and global risk-off sentiment, but the core mechanism was derivatives: excessive leverage, thin weekend liquidity, and margin calls.
Actual volatility may only be 2.2% for the entire year, but it still conceals “fat tail” days caused by leverage unwinding. The difference is that these shocks are now resolved within hours rather than weeks, and markets recover quickly thanks to spot demand from ETFs and corporate treasuries.
Bitcoin Enters a “Institutionalization” Phase in Terms of Volatility
The structural outlook for 2026 reinforces the view that volatility will continue to be compressed. K33 expects selling pressure from old holders to diminish as supply of two-year-old coins stabilizes, rather than being further triggered.
At the same time, the regulatory landscape is expanding with the US CLARITY Act, MiCA being fully implemented in Europe, and the opening of 401(k) investment channels and asset management at Morgan Stanley and Bank of America.
K33 predicts Bitcoin will outperform stocks and gold in 2026 as legal wins and new capital flows outweigh the selling pressure from existing holders.
While this forecast remains to be validated, the underlying mechanisms—deeper liquidity, mature infrastructure, and clearer legal frameworks—continue to support a low-volatility environment.
The ultimate state will be a Bitcoin market less like the “frontier speculative zone” of 2013 or 2017, and more like a high-liquidity macro asset, tightly anchored by institutions.
This does not mean Bitcoin will become boring or lack stories. It only indicates that the game has changed: smoother price paths, options and ETFs becoming more important than retail sentiment, and the real stories lying in market structure, leverage, and who is on each side of the trades.
2025 will be the year Bitcoin becomes “institutionally boring” in terms of volatility, even as it absorbs the largest legal and structural waves in history.
Key lesson: low actual volatility does not mean the asset is “dead,” but signals that the market has matured enough to absorb institutional-scale capital flows without self-destruction.
The cycle is not over—it just becomes more expensive to move.
