On December 31st, the market reported that Bitwise has officially filed for the issuance of 11 cryptocurrency ETF funds, with Sui being one of the notable altcoins included in the list.
Following this development, the price of SUI surged strongly, increasing nearly 19% in just three days, attracting significant investor interest.
Currently, Bitcoin is approaching and testing an important resistance zone around the $90,000 mark. Notably, Bitcoin’s dominance rate has decreased significantly since 12/30, indicating that capital is shifting towards the altcoin market.
In this context, the question arises whether the current upward momentum has enough strength to sustain, and whether Sui (SUI) is facing an opportunity to form a sustainable growth trend in the near future.
Why Sui could increase by another 70%
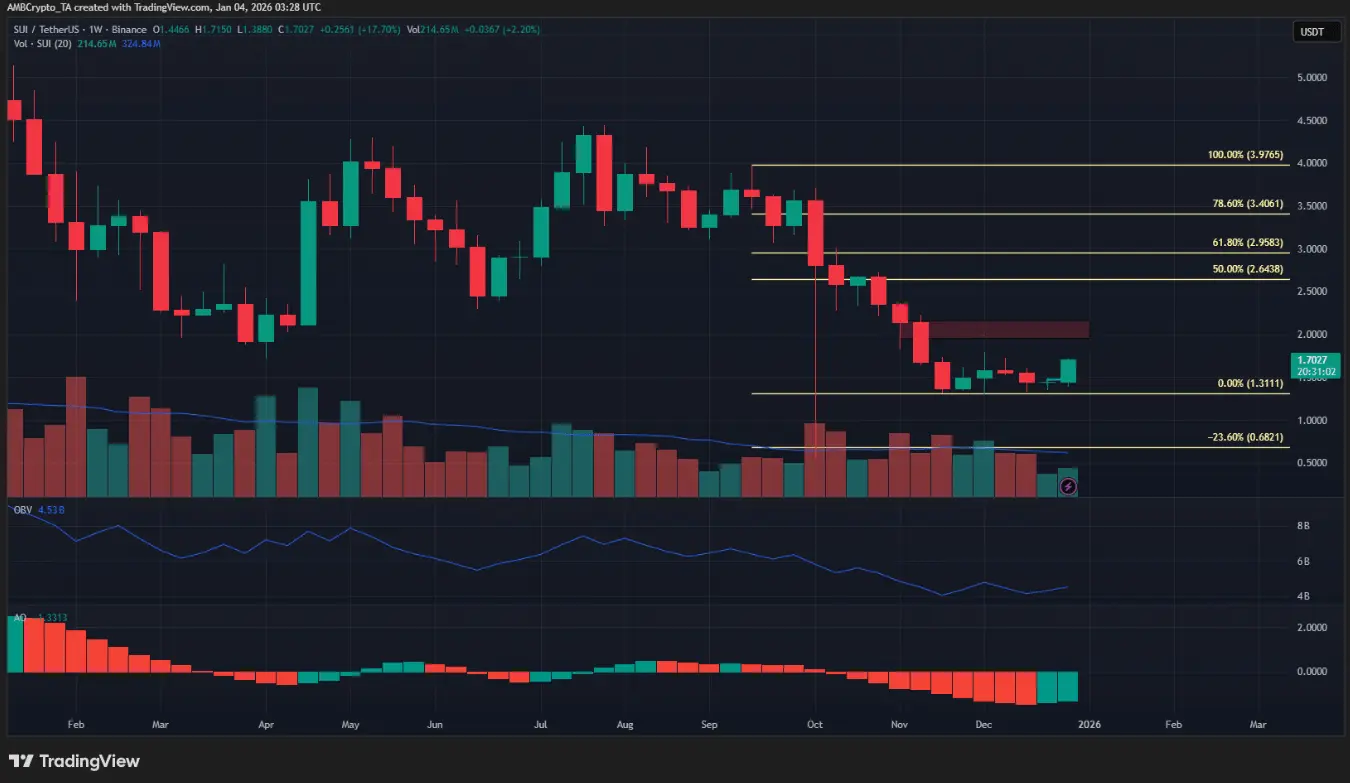 Weekly SUI/USDT chart | Source: TradingViewOn the weekly timeframe, the main trend of SUI remains bearish, although the recent recovery has attracted market attention. However, if the weekly candle can close firmly above the $1.79 level, this will send a positive signal that the bulls are temporarily regaining control and open up hope for a more noticeable recovery phase.
At that point, the price could be pushed towards higher target zones at $2.95 and $3.4 — important Fibonacci retracement levels acting as resistance above.
Nevertheless, momentum indicators and buying pressure on this timeframe still do not show a clear breakout, implying that the current rally may only be a technical rebound after previous weakness.
Potential reversal at the peak of the range
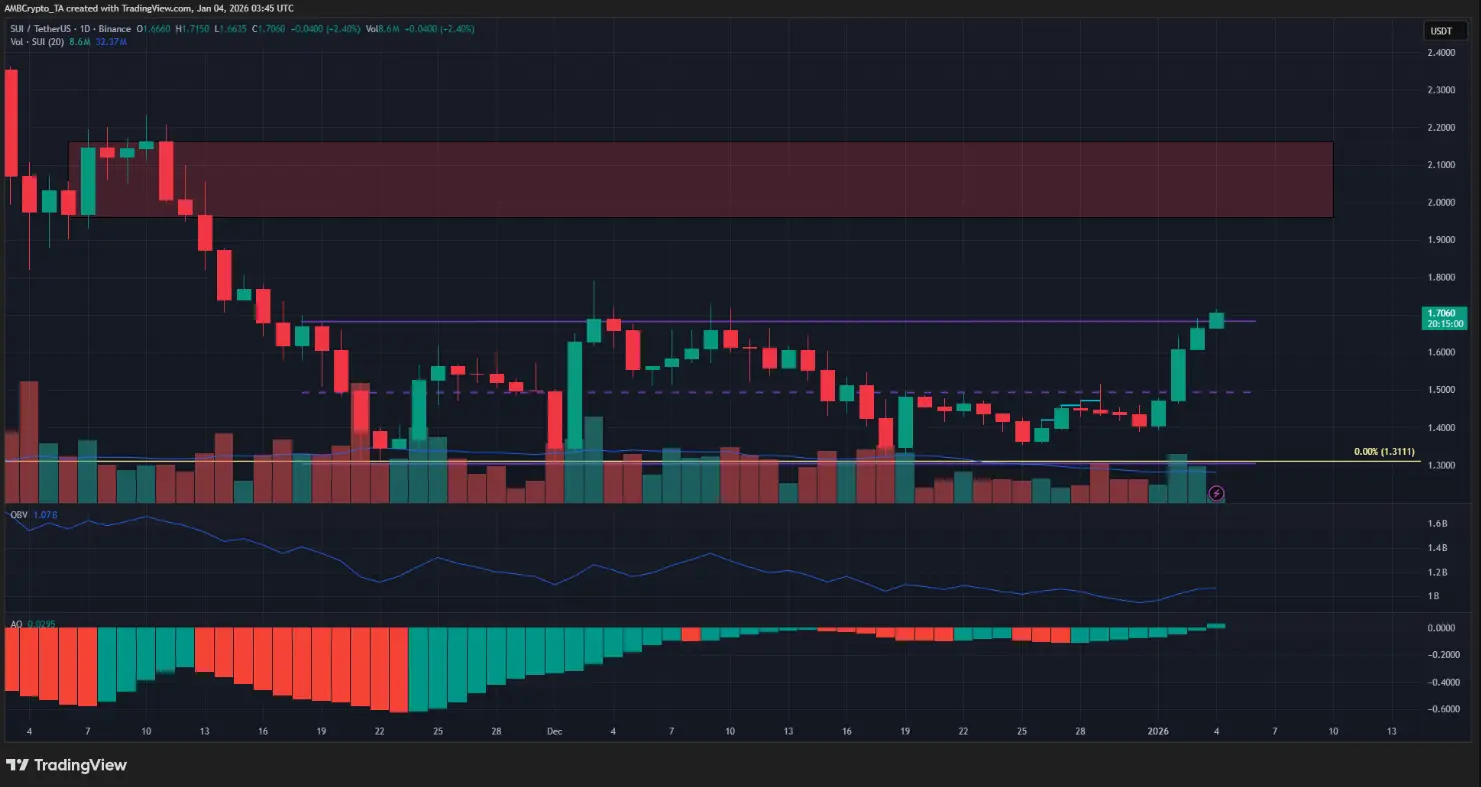 Daily SUI/USDT chart | Source: TradingViewThe oscillation pattern within the (purple zone) indicates an important peak at $1.68. At the time of writing, SUI is trading steadily above this level. If the price can record a clear daily candle closing above the upper boundary of the range, it will be a strong signal to reinforce confidence in the upward trend.
Conversely, failure to break out of the current range could serve as an early warning of increasing selling pressure and the risk of rejection. However, based on current developments, this negative scenario is considered unlikely.
Action for traders: Buy on breakout
The OBV indicator is gradually rising, while the Awesome Oscillator shows a bullish crossover — signs that demand and market momentum are improving significantly. At the same time, Bitcoin (BTC) has successfully broken through the local resistance zone around $90,000, further boosting momentum and reinforcing broad positive sentiment.
Based on the weekly chart signals, traders may consider a buy strategy upon confirmation of a breakout, aiming for higher targets, notably around the $3.40 zone.
Disclaimer: The information on this page may come from third parties and does not represent the views or opinions of Gate. The content displayed on this page is for reference only and does not constitute any financial, investment, or legal advice. Gate does not guarantee the accuracy or completeness of the information and shall not be liable for any losses arising from the use of this information. Virtual asset investments carry high risks and are subject to significant price volatility. You may lose all of your invested principal. Please fully understand the relevant risks and make prudent decisions based on your own financial situation and risk tolerance. For details, please refer to
Disclaimer.
Related Articles
Trump says the Strait of Hormuz will be “naturally open,” and risk-averse sentiment in the market is heating up
In his remarks, Trump said that the U.S. military would complete its strategic mission against Iran, prompting a cautious reaction in the markets. Brent crude oil prices rose, stocks fell, and risk-averse sentiment intensified. Iran has taken a hardline stance and clearly demanded a toll payment; the situation remains unclear, and geopolitical risks may continue to affect the markets.
GateNews4m ago
The truth behind Circle’s stock price plunge is revealed: regulatory repricing + intensified competition, the stablecoin landscape is changing
Circle (CRCL) stock price continues to weaken, affected by multiple factors such as regulatory repricing and others. At the same time, market participants are re-evaluating its profitability as Tether’s market expansion intensifies competition and impacts Circle’s market share. Profit-taking and strategic de-risking have led to price volatility, reflecting deeper changes in the crypto industry; the market is gradually shifting toward fundamentals-driven dynamics.
GateNews12m ago
Bitcoin demand turns negative, triggering an alert: giant whales keep reducing holdings, and selling pressure could suppress upside potential for a rebound
In April 2026, after Bitcoin pulled back for five consecutive months and then stabilized, demand remained weak, apparent demand was negative, and sell pressure was higher than buying. Bitcoin transfers by large mining companies and asset management institutions were seen as a sell-pressure signal; the whale cohort shifted to reducing holdings, and retail selling became even more pronounced. With market supply-demand imbalance, the upside room for a near-term rebound was limited.
GateNews15m ago
Bearish Analyst Declares Q2 2026 to Be a Bloody One for the Crypto Market
Bearish analyst declares Q2 2026 to be a bloody one for the crypto market.
He expects the price of BTC to likely set a bottom during this time.
He calls for an inevitable recession as oil prices could surge.
As the new month and start of Q2 2026 kick off, differing expectations take
CryptoNewsLand24m ago
Bitcoin Barely Avoids Equaling Worst Red Monthly Streak: What’s Next for April?
After another volatile month fueled by the war moves in the Middle East, bitcoin managed to scrape above the surface at the end and finished with a minor increase.
The focus has now turned to April and Q2, and _CryptoPotato_ turned to a leading expert about their take on the matter and what
CryptoPotato43m ago
‘Q2 Will Be Full of Blood’: Analyst Flips Fully Bearish on Bitcoin
Over the last few months, conflict in the Middle East has put pressure on crypto markets. Bitcoin faced a fresh decline of nearly 3% on Friday as the price dropped toward $66,000 from $69,200 yesterday.
Now, pseudonymous analyst Mr. Wall Street warned that the second quarter could be “full of
CryptoPotato47m ago
