Date: Wed, Dec 31, 2025 | 03:40 PM GMT
As the final hours of 2025 approach, the broader cryptocurrency market is showing modest strength. Both Bitcoin (BTC) and Ethereum (ETH) are trading slightly in the green, helping ease recent volatility and stabilize overall market sentiment. This calmer environment has allowed select altcoins — including Plasma (XPL) — to begin forming constructive technical setups after extended periods of downside pressure.
XPL is starting to attract attention with an impressive 11% daily jump, trimming its 60-day decline to roughly 43%. While the broader trend still reflects recovery mode, the more important signal is emerging on the daily chart, where price action is beginning to suggest a meaningful structural shift. If confirmed, this setup could mark the early stages of a bullish continuation heading into the new year.
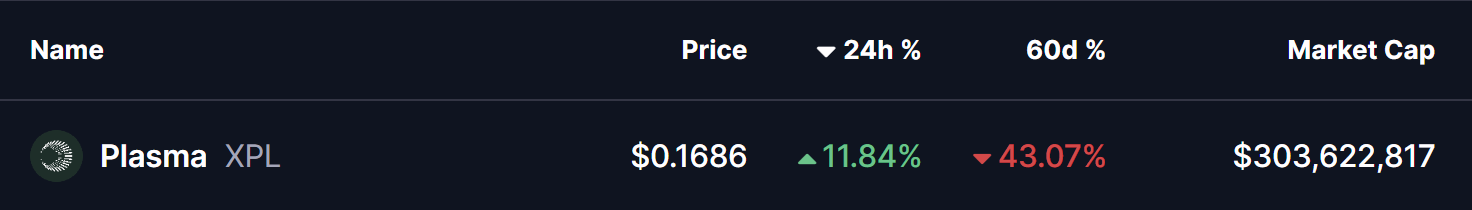
Source: Coinmarketcap
Rounding Bottom in Play
On the daily timeframe, XPL appears to be forming a textbook rounding bottom pattern — a classic bullish reversal structure that typically develops after a prolonged downtrend. This pattern reflects a slow but steady transition from selling dominance to accumulation, as bearish momentum fades and buyers gradually regain control.
Earlier in the trend, XPL faced strong rejection near the $0.3321 neckline zone, triggering a sharp decline that extended through November and December. That sell-off ultimately found a floor near the $0.1152 level, which has since proven to be a critical demand zone. Repeated defenses of this area prevented further downside and laid the foundation for a potential trend reversal.
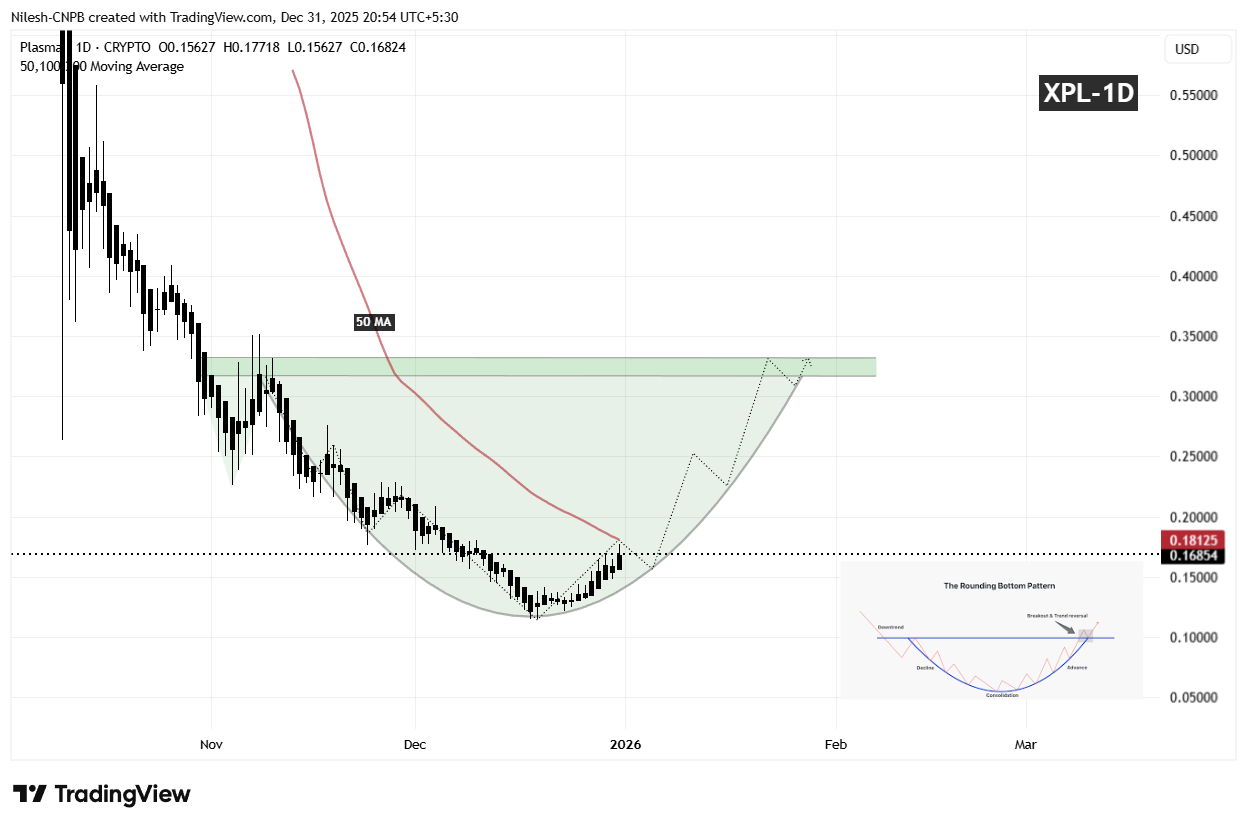
XPL Daily Chart/Coinsprobe (Source: Tradingview)
Since establishing that base, XPL has begun to curve higher in a rounded fashion, mirroring the classic structure of a developing bottom. This gradual recovery suggests that selling pressure is no longer aggressive, and that accumulation is taking place beneath the surface. The recent push back above the $0.16 region further reinforces the idea that buyers are positioning ahead of a larger directional move.
What’s Next for XPL?
For the rounding bottom pattern to gain confirmation, XPL needs to reclaim the 50-day moving average, currently positioned near the $0.1812 level. A sustained move above this area would signal a clear momentum shift and indicate that bulls are regaining control after months of corrective price action.
Looking higher, the most significant technical barrier remains the neckline resistance around $0.3321, highlighted by the prior distribution zone on the chart. A clean breakout above this region would validate the entire reversal structure and could open the door for a broader bullish expansion phase, with momentum traders and sidelined participants likely re-entering the market.
Until those levels are reclaimed, the pattern remains in its development phase. Short-term consolidation or minor pullbacks remain possible if price struggles near the 50-day moving average. However, as long as XPL continues to hold higher lows above the $0.1152 base, the broader bottoming structure remains intact.
Overall, XPL is approaching a technically important inflection point. The emerging rounding bottom formation, improving price structure, and proximity to key resistance levels suggest the coming sessions could prove decisive for Plasma’s next major directional move as the market transitions into 2026.
Disclaimer: The views and analysis presented in this article are for informational purposes only and reflect the author’s perspective, not financial advice. Technical patterns and indicators discussed are subject to market volatility and may or may not yield the anticipated results. Investors are advised to exercise caution, conduct independent research, and make decisions aligned with their individual risk tolerance.
About Author: Nilesh Hembade is the Founder and Lead Author of Coinsprobe, with over 5 years of experience in the cryptocurrency and blockchain industry. Since launching Coinsprobe in 2023, he has been providing daily, research-driven insights through in-depth market analysis, on-chain data, and technical research.
Disclaimer: The information on this page may come from third parties and does not represent the views or opinions of Gate. The content displayed on this page is for reference only and does not constitute any financial, investment, or legal advice. Gate does not guarantee the accuracy or completeness of the information and shall not be liable for any losses arising from the use of this information. Virtual asset investments carry high risks and are subject to significant price volatility. You may lose all of your invested principal. Please fully understand the relevant risks and make prudent decisions based on your own financial situation and risk tolerance. For details, please refer to
Disclaimer.
Related Articles
Dogecoin (DOGE) Could be on the Verge of a Huge Move: Crash or Rally Comes Next?
The biggest meme coin by market capitalization has been hovering within a tight $0.08-$0.09 range over the past week, with one key indicator signaling a major breakout in the near future.
Most analysts believe a move north is the more likely option, but the bearish conditions of the crypto market m
CryptoPotato8m ago
When to Buy Bitcoin Next? Analyst Outlines Exact Entry Levels
Bitcoin dumped hard in early February, plunging to a 15-month low of $60,000. This meant that it had shed over 50% of its value since early October when it peaked at over $126,000.
Although it has recovered roughly 20% since that low and sits close to $72,000 now, there are still some analysts
CryptoPotato17m ago
Bitcoin’s $70K Ceiling Won’t Break and Here’s Why
_Bitcoin grinds in a tight range as whale delta stays deeply negative and open interest fails to expand with price, signaling trouble for bulls eyeing $70K._
Bitcoin is still stuck. Price pushed toward $69K Thursday and got sold immediately. Again.
That pattern has played out multiple times
LiveBTCNews34m ago
Bittensor Price Faces Resistance as Bearish Signals Emerge
Key Insights
The Bittensor price rally from $144 to $375 shows slowing momentum as resistance near $380 continues to limit further upside expansion in recent sessions.
The TD Sequential indicator flashes a sell
CryptoNewsLand44m ago
Thinking of Buying Bittensor? Watch These TAO Price Correction Levels First
Bittensor (TAO) faces challenges amidst market volatility influenced by geopolitical tensions. Despite a recent price dip, strong staking interest indicates underlying stability. Key resistance and support levels suggest careful monitoring for potential breakout or deeper correction.
CaptainAltcoin44m ago
Solana Holds Key Support as Bitcoin Rally Lifts Crypto Market
Solana's price remained above $80 amid rising Bitcoin values, contributing to a broader crypto market recovery with a capitalization of $2.35 trillion. Institutional demand and easing geopolitical tensions supported this growth, while Solana led in decentralized finance activity, recording significant DEX and stablecoin volumes in March.
CryptoNewsLand48m ago
