
**Date: **Sat, Jan 03, 2026 | 06:10 AM GMT
As the 2026 kicks off, the broader cryptocurrency market is showing renewed stability. Bitcoin (BTC) and Ethereum (ETH) are both trading slightly in the green, with ETH posting gains of over 3% today. This steady performance among major assets has helped improve overall market sentiment, allowing select altcoins — including Bitcoin Cash (BCH) — to form constructive technical setups.
Bitcoin Cash is already responding positively, jumping nearly 5% on the day. However, beyond the short-term price move, the daily chart reveals a much more important development. BCH appears to be completing a classic reversal structure, hinting that the recent strength may be the early stage of a larger trend shift rather than just a temporary bounce.
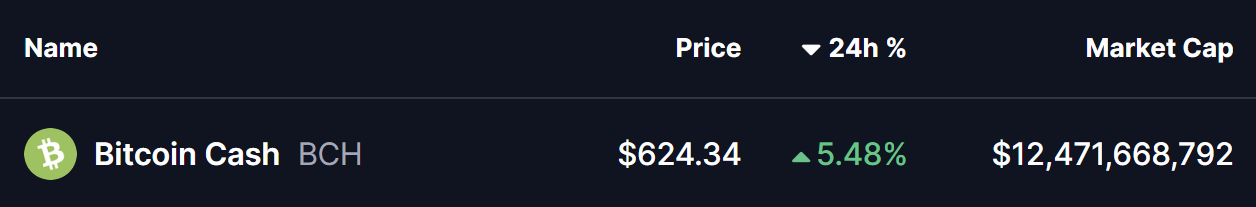
Source: Coinmarketcap
Rounding Bottom in Play?
On the daily timeframe, Bitcoin Cash is forming a rounding bottom pattern, a well-known bullish reversal formation that signals a gradual transition from selling pressure to sustained accumulation. Unlike sharp V-shaped reversals, rounding bottoms reflect patience from buyers and fading control from sellers over an extended period.
This structure began taking shape after BCH faced a strong rejection near the $630 level in September 2025. That rejection triggered a sharp sell-off, pushing price down to the $446.9 region. Crucially, bears failed to force a deeper breakdown. Instead, strong demand emerged, price stabilized, and volatility gradually compressed — laying the foundation for the rounded base visible on the chart.
As weeks passed, BCH began to print higher lows, slowly curving upward and completing the bottoming structure. The recovery has now brought price back toward the $600–$630 resistance zone, which marks the neckline of the rounding bottom and represents a key decision area for the trend.
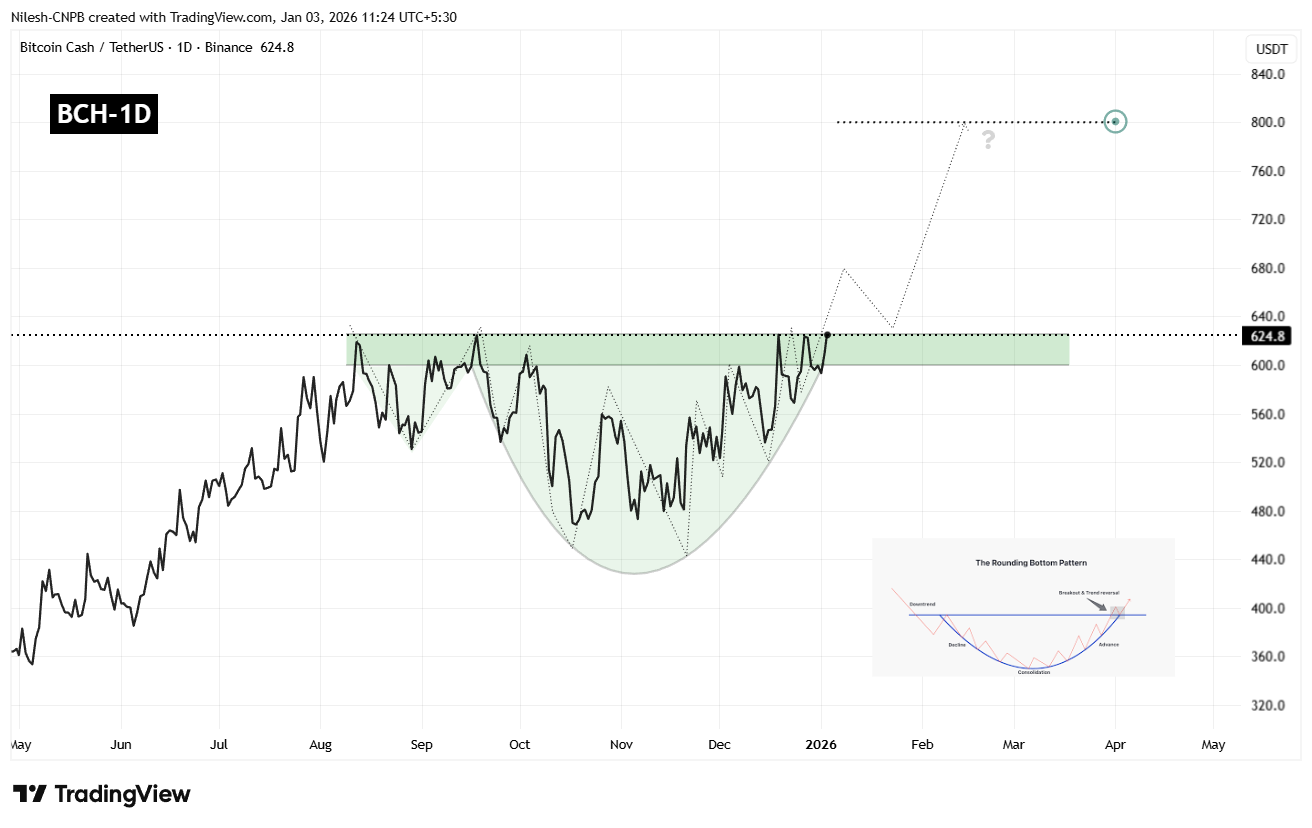
Bitcoin Cash (BCH) Daily Chart/Coinsprobe (Source: Tradingview)
Key Resistance in Focus
At present, BCH is trading near $624, repeatedly testing the $600–$630 zone. This area has historically acted as a supply zone, rejecting price advances multiple times in the past. A decisive daily close above this range would confirm a bullish breakout and signal a shift in market structure.
If bulls manage to push through this resistance and flip it into support, it would strongly validate the rounding bottom pattern and open the door for a continuation rally.
What’s Next for BCH?
A confirmed breakout above $630, followed by a successful retest of the zone as support, would significantly strengthen the bullish outlook. Based on the depth of the rounding bottom formation, the measured upside target points toward the $800–$820 region.
Reaching that level would represent a potential upside of approximately 27% from current prices, aligning well with historical behavior following similar rounding bottom breakouts.
That said, patience remains essential. Before a clean breakout occurs, BCH could still see short-term pullbacks — potentially toward the rising base of the rounded structure or near-term moving averages, which have acted as dynamic support during the recovery. Such retracements would not invalidate the bullish setup as long as price continues to hold above higher low levels.
For now, the $600–$630 zone remains the line in the sand. How BCH behaves around this resistance in the coming sessions will likely determine whether it enters a sustained bullish phase or remains range-bound a bit longer.
Disclaimer: The views and analysis presented in this article are for informational purposes only and reflect the author’s perspective, not financial advice. Technical patterns and indicators discussed are subject to market volatility and may or may not yield the anticipated results. Investors are advised to exercise caution, conduct independent research, and make decisions aligned with their individual risk tolerance.
About Author: Nilesh Hembade is the Founder and Lead Author of Coinsprobe, with over 5 years of experience in the cryptocurrency and blockchain industry. Since launching Coinsprobe in 2023, he has been providing daily, research-driven insights through in-depth market analysis, on-chain data, and technical research.
Disclaimer: The information on this page may come from third parties and does not represent the views or opinions of Gate. The content displayed on this page is for reference only and does not constitute any financial, investment, or legal advice. Gate does not guarantee the accuracy or completeness of the information and shall not be liable for any losses arising from the use of this information. Virtual asset investments carry high risks and are subject to significant price volatility. You may lose all of your invested principal. Please fully understand the relevant risks and make prudent decisions based on your own financial situation and risk tolerance. For details, please refer to
Disclaimer.
Related Articles
Bitcoin mining difficulty hits a new record
In February, global cryptocurrency mining saw significant developments, including a nearly 15% increase in Bitcoin's mining difficulty to a record 144.4 trillion. Bitdeer liquidated its BTC holdings and aimed to raise over 1,928,374,656,574,839,201 million for expansion. Market sentiment weakened after Trump's proposed tax increase, pushing Bitcoin below $65,000.
TapChiBitcoin4m ago
BTC 15-minute sharp decline of 1.32%: On-chain large transfers and long contract liquidations jointly exert pressure
Between 13:30 and 13:45 (UTC) on March 10, 2026, Bitcoin (BTC) experienced a short-term sharp decline, with a return of -1.32%. The price fluctuation range was from 69,723.0 to 70,921.5 USDT, with an amplitude of 1.69%. Trading volume during this period significantly increased, with on-chain large transfers rising by 18%. Market volatility intensified, accompanied by a rapid rise in panic sentiment, reflecting investors' high concern over sudden anomalies.
The main driver of this anomaly was the concentrated inflow of large on-chain transfers to exchanges, with some single transactions exceeding 1000 BTC, triggering institutional or large investor activity.
GateNews7m ago
BTC falls below $70,000, now at $69,813
Gate News Report, March 10, market data shows that Bitcoin has fallen below the $70,000 mark, currently trading at $69,813, with the 24-hour increase narrowing to 1.52%.
GateNews13m ago
BTC drops below 70,000 USDT
Gate News bot message, Gate market display, BTC drops below 70,000 USDT, current price 69,987.6 USDT.
CryptoRadar17m ago
Fake Police Officers Held French Couple at Knifepoint in $1M Bitcoin Robbery
Three suspects posing as police officers attacked a couple in Versailles, forcing them to transfer approximately €900,000 in Bitcoin. French authorities confirm the theft and are investigating the growing trend of violent robberies targeting crypto holders.
Decrypt18m ago
Today, the US Bitcoin ETF saw a net inflow of 2,070 BTC, while the Ethereum ETF experienced a net outflow of 24,138 ETH.
Gate News reports that on March 10th, according to Lookonchain monitoring, the US Bitcoin ETF saw a net inflow of 2,070 BTC, Ethereum ETF experienced a net outflow of 24,138 ETH, and Solana ETF had a net outflow of 33,350 SOL.
GateNews23m ago